一 简介
下面我们来编写一个检测系统环境、监控系统性能的脚本,并判断各项数据指标是否符合预设的阈值。如果数据有异常,就报警,如何报警,视情况而定。注意脚本中的很多预设值只是假设值,在实际生产环境中还需要根据业务和环境的需要,调整这些预设值。限于水平,本文仅获取部分性能参数指标,如果还有其他需要监控的数据,会在以后的学习中加进来的。
二 获取系统信息
1 获取本机日期时间
root@hehe:~# local_time=$(date +"%Y%m%d %H:%M:%S");echo ${local_time}
20221015 15:08:02
root@hehe:~#
2 获取本机ip地址
变量eth_name用于存放网口名字。视情况而赋值。
root@hehe:~# eth_name=eth1
root@hehe:~# local_ip=$(ifconfig ${eth_name} | grep -Eo "[0-9]{1,3}\.[0-9]{1,3}\.[0-9]{1,3}\.[0-9]{1,3}" | sed -n '1p');echo ${local_ip}
192.168.0.3
root@hehe:~#
3 获取可用内存
root@hehe:~# mem_free=$(cat /proc/meminfo | grep Available | tr -s " " | sed 's/:/ /g' | awk '{print $2}');echo ${mem_free}
434276
root@hehe:~#
报警:
如果可用内存小于XXXMB,报警。假设小于500BM就输出报警:现在剩余400多BM,报警啦
root@hehe:~# [ $mem_free -lt 512000 ] && echo "no mem:${local_time} - ${mem_free} - ${local_ip}"
no mem:20221015 15:08:02 - 434276 - 192.168.0.3
root@hehe:~#
4 获取根目录剩余空间
root@hehe:~# df
Filesystem     1K-blocks   Used Available Use% Mounted on
/dev/root        7244864 745604   6124580  11% /
devtmpfs          187532      4    187528   1% /dev
tmpfs                 40      0        40   0% /mnt/.psplash
tmpfs             253344    136    253208   1% /run
tmpfs             253344    108    253236   1% /var/volatile
/dev/mmcblk1p1    129039   6466    122573   6% /mmcblk1p1
root@hehe:~#
首先,获得"/"结尾的行,就是根目录啦。
root@hehe:~# df | grep "/$"
/dev/root        7244864 745604   6124580  11% /
root@hehe:~#
然后,去掉空格
root@hehe:~# df | grep "/$" | tr -s " "
/dev/root 7244864 745604 6124580 11% /
root@hehe:~#
第三,取出Available对应列的值。
root@host:~# df | grep "/$" |tr -s " " | cut -d" " -f4
11511
root@host:~#
最后,将这个值存放到变量中,齐活。
root@hehe:~# free_disk=$(df | grep "/$" |tr -s " " | cut -d" " -f4);echo ${free_disk}
6124580
root@hehe:~#
或者
root@hehe:~# free_disk=$(df | grep "/$" |tr -s " " | awk {'print $4'});echo ${free_disk}
6124580
root@hehe:~#
报警:
如果可用磁盘小于10GB,报警。现在剩余6GB,报警啦
root@hehe:~# [ ${free_disk} -lt 10485760 ] && echo "no disk:${local_time} - ${free_disk} - ${local_ip}"
no disk:20221015 15:08:02 - 6124580 - 192.168.0.3
root@hehe:~#
5 获取CPU15分钟平均负载
/proc/loadavg文件中前三个值分别是1分钟,5分钟和15分钟平均负载。第四个的分子是正在运行的进程数,分母是进程总数;最后一个是最近运行的进程ID号。
这也不知道是不是真的?一般来说每个CPU的当前活动进程数不大于3那么系统的性能就是良好的。如果每个CPU的任务数大于5,那么就表明机器的性能有严重问题。
我感觉大于1,就应该注意了吧。
对于下面的例子来说,系统有1个CPU,那么其每个CPU在1分钟内的进程数为:0.01/1 = 0.01。等于是CPU真的很闲啊,它也确实什么都没干。
root@hehe:~# cat /proc/loadavg
0.00 0.01 0.05 1/71 809
root@hehe:~# cat /proc/loadavg | cut -d' ' -f3
0.05
root@hehe:~# cpu_load=$(cat /proc/loadavg | cut -d' ' -f3);echo ${cpu_load}
0.05
root@hehe:~#
报警:
当CPU的15min平均负载超过1时,报警。我的cpu太闲了,手动给cpu_load一个值2.
root@hehe:~# cpu_load=2
root@hehe:~# [ $cpu_load -gt 1 ] && echo "cpu two busy:${local_time} - ${cpu_load} - ${local_ip}"
cpu two busy:20221015 15:08:02 - 2 - 192.168.0.3
root@hehe:~#
将值改为1,输出很happy
root@hehe:~# cpu_load=1
root@hehe:~# [ $cpu_load -gt 1 ] && echo "cpu two busy:${local_time} - ${cpu_load} - ${local_ip}" || echo "cpu very happy"
cpu very happy
root@hehe:~#
6 获取登录用户数
root@host:~# who
root            pts/0           00:00   Jan  1 00:24:00  192.168.0.5
root            pts/1           00:00   Jan  1 09:13:23  192.168.0.5
root@host:~# who | wc -l
2
root@host:~# login_user=$(who | wc -l);echo ${login_user}
2
root@host:~#
报警:
登录用户数如果超出预期,可能是黑客入侵,要报警。
root@hehe:~# login_user=3
root@hehe:~# [ $login_user -gt 2 ] && echo "bad man:${local_time} - ${login_user} - ${local_ip}" || echo "no bad man"
bad man:20221015 15:08:02 - 3 - 192.168.0.3
root@hehe:~# login_user=1
root@hehe:~# [ $login_user -gt 2 ] && echo "bad man:${local_time} - ${login_user} - ${local_ip}" || echo "no bad man"
no bad man
root@hehe:~#
似乎找到了偷懒的好方法,以后的测试数据,都使用两个假的,一个报警数据,一个安全数据,这样就可以做到覆盖测试了。
7 获取进程数
执行的命令本身也会占用一个进程
root@host:~# ps aux | wc -l
60
root@host:~# proc_num=$(ps aux | wc -l);echo ${proc_num}
61
root@host:~#
报警:
显示3个进程,CPU很happy,然后是100个进程,cpu很busy。
root@hehe:~# proc_num=3
root@hehe:~# [ $proc_num -gt 80 ] && echo "too many process:${local_time} - ${proc_num} - ${local_ip}" || echo "cpu is happy"
cpu is happy
root@hehe:~# proc_num=100
root@hehe:~# [ $proc_num -gt 80 ] && echo "too many process:${local_time} - ${proc_num} - ${local_ip}" || echo "cpu is happy"
too many process:20221015 15:08:02 - 100 - 192.168.0.3
root@hehe:~#
8 获取中断数
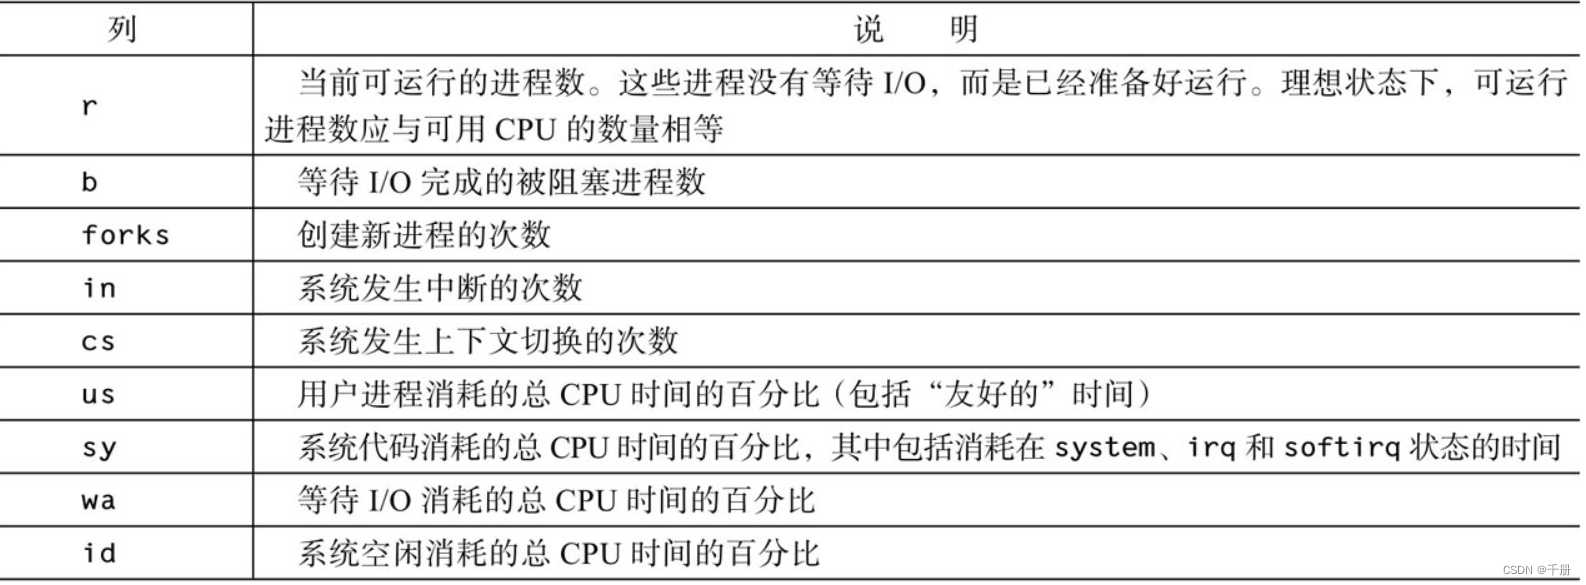
vmstat提供了一个低开销的良好系统性能视图。由于所有的性能统计数据都以文本形式呈现,并打印到标准输出,因此,捕捉测试中生成的数据,以及之后对其进行处理和绘图就会很方便。由于vmstat的开销如此之低,因此当你需要一目了然地监控系统健康状况时,让它在控制台上或窗口中持续运行,甚至是在负载非常重的服务器上是很实用的。
vmstat的每个列的含义:in列表示中断数,在我的系统中默认是第11列。
下面是分布测试,最后一步将该值irq数,保存到变量irq_num;
root@hehe:~# vmstat 1 2
procs -----------memory---------- ---swap-- -----io---- -system-- ------cpu-----
 r  b   swpd   free   buff  cache   si   so    bi    bo   in   cs us sy id wa st
 0  0      0 460324   4664  26664    0    0   452    13  102  296 11 13 76  0  0
 0  0      0 460340   4664  26692    0    0     0     0   22   31  0  0 100  0  0
root@hehe:~#
root@hehe:~# vmstat 1 2 | tail -n +4
 0  0      0 460316   4668  26752    0    0     0     0   14   27  0  0 100  0  0
root@hehe:~# vmstat 1 2 | tail -n +4 | tr -s " "
 0 0 0 460168 4672 26804 0 0 0 0 12 25 0 1 99 0 0
root@hehe:~# vmstat 1 2 | tail -n +4 | tr -s " " | awk '{print $11}'
15
root@hehe:~# irq_num=$(vmstat 1 2 | tail -n +4 | tr -s " " | awk '{print $11}');echo ${irq_num}
14
root@hehe:~#
报警:
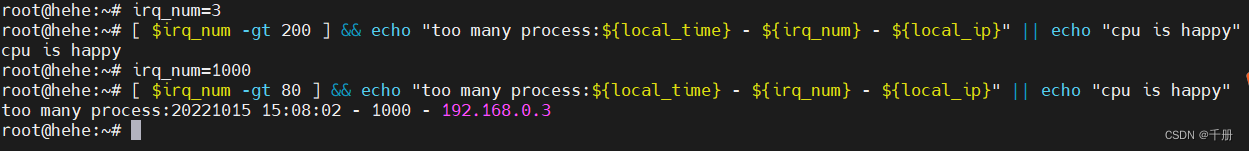
先3个irq,CPU很happy,然后是100个irq,cpu很busy。
root@hehe:~# irq_num=3
root@hehe:~# [ $irq_num -gt 200 ] && echo "too many process:${local_time} - ${irq_num} - ${local_ip}" || echo "cpu is happy"
cpu is happy
root@hehe:~# irq_num=1000
root@hehe:~# [ $irq_num -gt 80 ] && echo "too many process:${local_time} - ${irq_num} - ${local_ip}" || echo "cpu is happy"
too many process:20221015 15:08:02 - 1000 - 192.168.0.3
root@hehe:~#
截图:为啥截图是,算是自励吧。
 剩下的就不报警了。
9 获取上下文切换数
root@hehe:~# cs_num=$(vmstat 1 2 | tail -n +4 | tr -s " " | awk '{print $12}');echo ${cs_num}
32
root@hehe:~#
10 用户进程占用时间百分比
root@hehe:~# user_time=$(vmstat 1 2 | tail -n +4 | tr -s " " | awk '{print $13}');echo ${user_time}
1
root@hehe:~#
11 等待IO占用时间百分比
root@hehe:~# iow_time=$(vmstat 1 2 | tail -n +4 | tr -s " " | awk '{print $16}');echo ${iow_time}
0
root@hehe:~#
综合实例:
就是把上面这些东西复制到一个脚本中,累似了。改天再写。


![[BJDCTF2020]EzPHP](https://img-blog.csdnimg.cn/7bc295a160fc4036815b014ad15c3156.png)
![[CVPR2022] Cross-Model Pseudo-Labeling for Semi-Supervised Action Recognition](https://img-blog.csdnimg.cn/decf823f99cf4f938b06cf4b6dd88be0.png)