文章目录
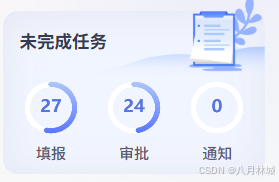
- 一、实现效果
- 二、话不多说,上源码
- 前言:我们在uniapp中开发的时候,开发的时候很正常,echarts的图形在h5页面上也是很正常的,但是当我们打包成安卓app或者使用安卓真机运行的时候,图形根本就没有渲染出来。以下是我的解决方法,摸索了两天,终于在我不懈的努力下搞定了
一、实现效果
二、话不多说,上源码
1、echarts代码必须写在 lang="renderjs"的script 中,调用的时候必须在:change中调用<script module="renderScript" lang="renderjs">
<template>
	<view class="content">
		<view class="taskModel">
			<view class="chat" id="chat1" :msg="msg1" :change:msg="renderScript.initChart">
			</view>
			<view class="chatText">填报</view>
		</view>
		<view class="taskModel">
			<view class="chat" id="chat2" :msg="msg2" :change:msg="renderScript.initChart">
			</view>
			<view class="chatText">审批</view>
		</view>
		<view class="taskModel">
			<view class="chat" id="chat3" :msg="msg3" :change:msg="renderScript.initChart">
			</view>
			<view class="chatText">通知</view>
		</view>
	</view>
</template>
<script>
export default {
	components:{Calendar},
	data() {
		this.chat1 = null
		return {
			msg1: 1,
			msg2: 1,
			msg3: 1
		};
	},
	created() {
	    // 调用方法
		this.getUnSuccTask()
	},
  methods: {
	    // 未完成任务
	    getUnSuccTask(){
	      // 这里是请求方法
		  this.$store.dispatch('actioncore/cpcGetApi', {url: '/user/PhoneDJTodoCount',param: null}).then(res => {
			if(res.data  != null){
				var approval = (res.data.approval != null && res.data.approval !== '') ? res.data.approval: 0;
				var meeting = (res.data.meeting != null && res.data.meeting !== '') ? res.data.meeting: 0;
				var todos = (res.data.todos != null && res.data.todos !== '') ? res.data.todos: 0;
				var total = approval+meeting+todos

				var msg1 = { // 填报
					total: total == 0 ? 100 : total,
					val: todos,
				}
				var msg2 = { // 审批
					total: total == 0 ? 100 : total ,
					val: approval,
				}
				var msg3 = { // 通知
					total: total == 0 ? 100 : total,
					val: meeting,
				}
				this.msg1 = msg1
				this.msg2 = msg2
				this.msg3 = msg3
			}
		  }).catch(() => {
		  })
	    }
  },
};
</script>
<script module="renderScript" lang="renderjs">
import {getIndexYH} from '@/utils/chartOptions.js'
import * as echarts from 'echarts'
  export default {
	methods: {
		// 这里也可以在renderjs中mounted中调用,但是只是初始化
		initChart(newValue, oldValue, ownerVm, vm) {
			if (newValue == 1) {
				return;
			}
			var option = {
			    title: [
			        {
			            text: '{a|'+cuVal+'}',
			            show: true,
			            x: 'center',
			            y: 'center',
			            textStyle: {
			                rich: {
			                    a: {
			                        fontSize: 14,
			                        color: '#5A75E1',
			                        padding: [0, 0,0, 0],
											  fontWeight: 'bold'
			                    }
			                },
			            },
			        },
			    ],
			    polar: {
			        center: ['50%', '50%'],
			        radius: ['75%', '100%'],
			    },
			    angleAxis: {
			        max: maxVal,
			        show: false,
			    },
			    radiusAxis: {
			        type: 'category',
			        show: true,
			        axisLabel: {
			            show: false,
			        },
			        axisLine: {
			            show: false,
			        },
			        axisTick: {
			            show: false,
			        },
			    },
			    series: [
			        {
			            name: '',
			            type: 'bar',
			            roundCap: true,
			            showBackground: true,
			            backgroundStyle: {
			                color: '#FFF',
			            },
			            data: [cuVal],
			            coordinateSystem: 'polar',
			            itemStyle: {
			                normal: {
			                    color: new echarts.graphic.LinearGradient(0, 1, 0, 0, [
			                        {
			                            offset: 0,
			                            color: '#5A76FF',
			                        },
			                        {
			                            offset: 1,
			                            color: '#AEC7FA',
			                        },
			                    ]),
			                },
			            },
			        },
			        {
			            name: '',
			            type: 'gauge',
			            radius: '54%',
			            axisLine: {
			                lineStyle: {
			                    color: [],
			                    width: 1,
			                },
			            },
			            axisLabel: {
			                show: false,
			            },
			            axisTick: {
			                show: false,
			            },
			            splitLine: {
			                show: false,
			            }
			        }
			    ],
			};
			var chart = echarts.init(document.getElementById(vm.$el.id))
			chart.setOption(option)
		}
	},
  };
</script>