程序:
路径改成自己的,阈值可以修改也可以默认
#zhouzhichao
#25年5月17日
#计算时频图中信号面积占检测框面积的比值


import os
import numpy as np
import pandas as pd
from PIL import Image

# Define the path to the directory containing the label txt files
label_dir = r'D:\实验室\论文\论文-多信号参数估计\JCR3\Principle\微调原理\diff_snr\snr_dataset\label_txt'
img_dir = r'D:\实验室\论文\论文-多信号参数估计\JCR3\Principle\微调原理\diff_snr\snr_dataset\6'
binary_output_dir = r'D:\实验室\论文\论文-多信号参数估计\JCR3\Principle\像素面积比值\binary img'

# Make sure the output directory exists
os.makedirs(binary_output_dir, exist_ok=True)

# Initialize lists for storing the results for each class
ratios_0 = []
ratios_1 = []
ratios_2 = []
ratios_3 = []

# Function to calculate the ratio of signal area to the bounding box area
def calculate_area_ratio(image_path, label_path, binary_output_dir):
    # Load the image and convert it to grayscale
    image = Image.open(image_path).convert('L')  # Convert to grayscale (L mode)
    image_array = np.array(image)

    # Read the label file
    with open(label_path, 'r') as file:
        labels = file.readlines()


    for label in labels:
        # Parse the label
        label_data = label.strip().split()
        class_id = int(label_data[0])  # Class ID
        x_center = float(label_data[1])  # x center normalized
        y_center = float(label_data[2])  # y center normalized
        box_width = float(label_data[3])  # box width normalized
        box_height = float(label_data[4])  # box height normalized

        # Convert the normalized values to pixel values based on image size
        img_width, img_height = image.size
        x_center_px = int(x_center * img_width)
        y_center_px = int(y_center * img_height)
        box_width_px = int(box_width * img_width)
        box_height_px = int(box_height * img_height)

        # Calculate the bounding box coordinates
        x_min = max(x_center_px - box_width_px // 2, 0)
        y_min = max(y_center_px - box_height_px // 2, 0)
        x_max = min(x_center_px + box_width_px // 2, img_width)
        y_max = min(y_center_px + box_height_px // 2, img_height)

        # Extract the bounding box region
        bbox_region = image_array[y_min:y_max, x_min:x_max]

        # Threshold the image (binary thresholding)
        binary_region = np.where(bbox_region > 128, 1, 0)  # 128 as threshold

        # Calculate the area of the signal inside the bounding box (sum of binary values)
        signal_area = np.sum(binary_region)

        # Calculate the area of the bounding box
        box_area = box_width_px * box_height_px

        # Save the binary image of the region to the output folder
        binary_image = Image.fromarray(binary_region.astype(np.uint8) * 255)  # Convert to 0-255 scale for saving
        binary_image.save(os.path.join(binary_output_dir, f'binary_{class_id}_{x_center_px}_{y_center_px}.png'))

        # Calculate the area ratio
        area_ratio = signal_area / box_area if box_area > 0 else 0

        if class_id==0:
            ratios_0.append(area_ratio)

        if class_id==1:
            ratios_1.append(area_ratio)

        if class_id == 2:
            ratios_2.append(area_ratio)

        if class_id == 3:
            ratios_3.append(area_ratio)


# Traverse all the label files and calculate area ratios
for label_file in os.listdir(label_dir):
    if label_file.endswith('.txt'):
        # Get corresponding image path
        label_path = os.path.join(label_dir, label_file)
        image_name = label_file.replace('.txt', '.jpg')  # Assuming image is in .jpg format
        image_path = os.path.join(img_dir, image_name)

        # Calculate area ratios for the current label file
        calculate_area_ratio(image_path, label_path, binary_output_dir)


data = {
    'ratios_0': ratios_0,
    'ratios_1': ratios_1,
    'ratios_2': ratios_2,
    'ratios_3': ratios_3
}

# 创建一个 DataFrame
df = pd.DataFrame(data)

# 保存到 Excel 文件
file_path = r'D:\实验室\论文\论文-多信号参数估计\JCR3\Principle\像素面积比值\area_ratios.xlsx'
df.to_excel(file_path, index=False)
print()
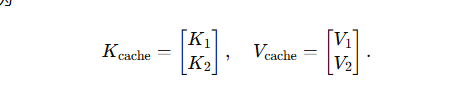
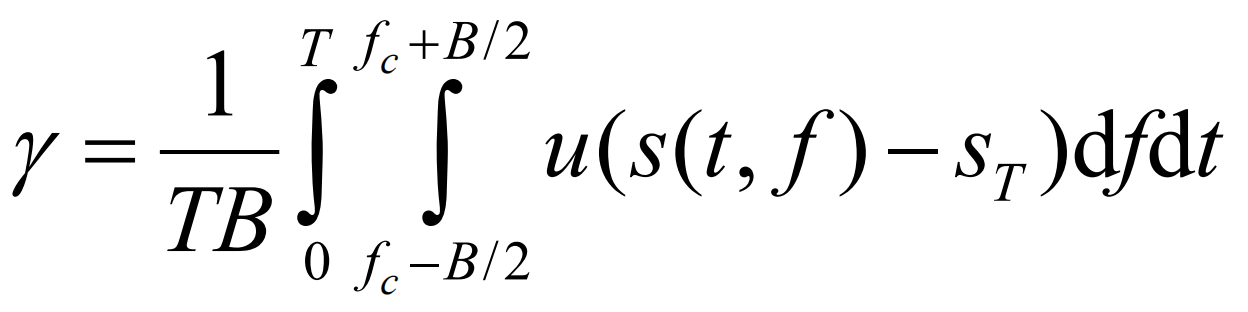
程序依照的公式:
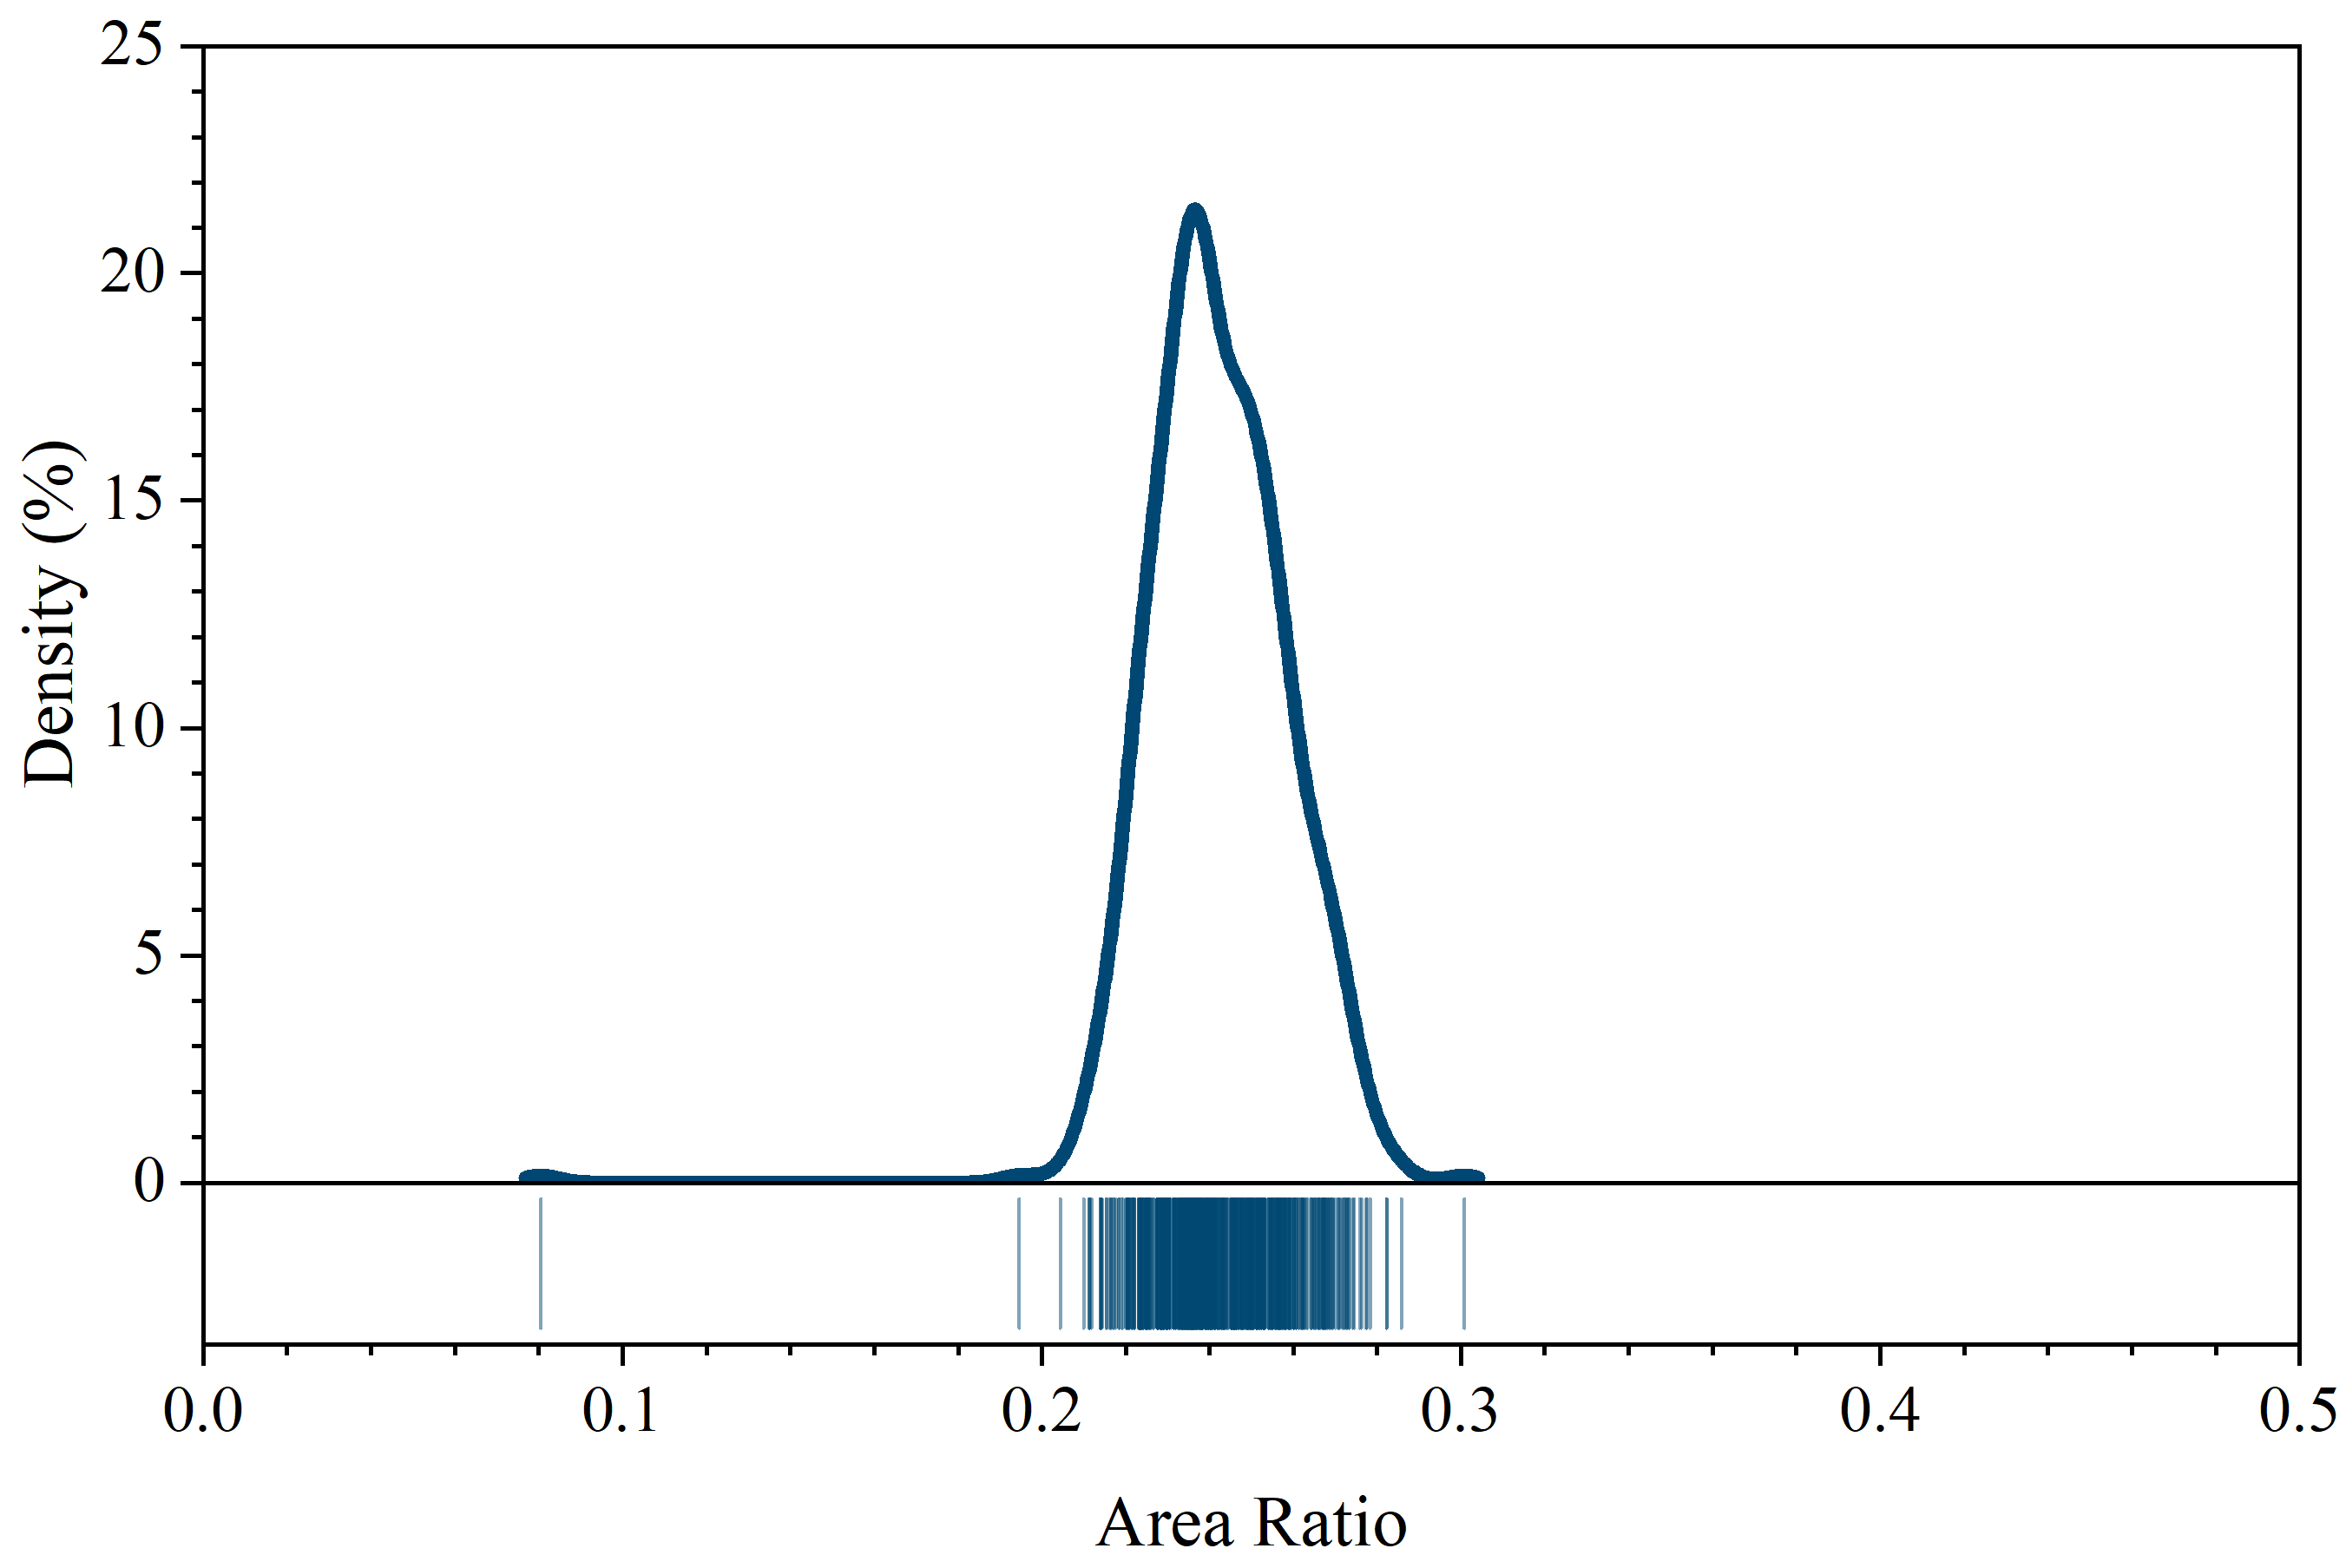
生成结果:
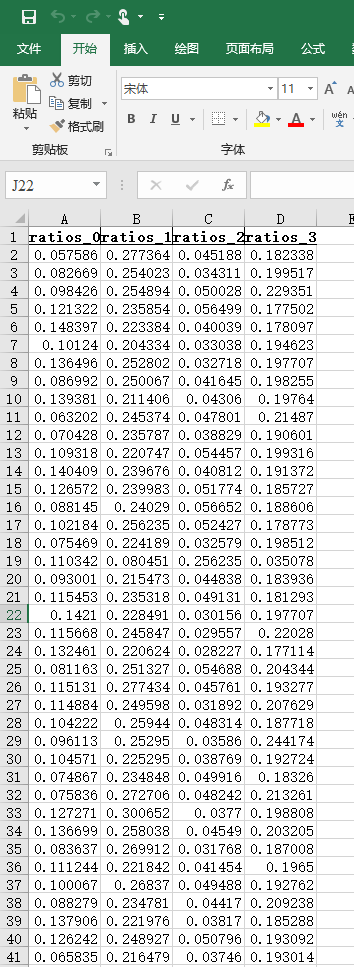
可用于绘制论文实验图: