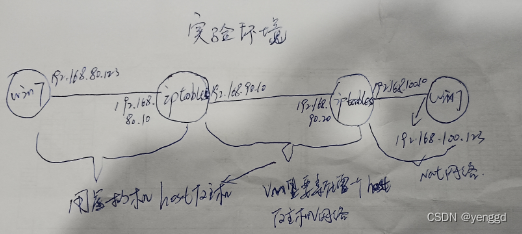
由于内存白菜价, 家里的虚拟机越来越多了。
1个是难以管理hostname 和 ip, 只靠/etc/hosts 去记住其实并不方便
试过宝塔linux面板, 可惜是单机的,不适用于管理集群linux服务器, 而且里面一股金钱气息。
至于他们另1个产品堡塔云, 估计是集群管理, 但是安装失败, 而且看了价格感觉像智商税。
公司用过Appdynamic, 功能强大可惜更不是我能想的。
只能还是去寻找开源方案。好在外能的google提供了一套成熟的开源方案
Prometheus - 用于管理机 - 集群服务器数据收集
node_exporter - 用于被管理节点 - 提供节点本身的服务器数据给Prometheus
Grafana - 数据展示工具
下面就会写出详细的安装步骤
1. 服务器准备
| No | hostname | ip | cpu 数 | memory | os | comment |
|---|---|---|---|---|---|---|
| 1 | amdeuc-vm0 | 10.0.1.155 | 1 | 2 | ubuntu 22.04 LTS server | 监控机 |
| 2 | amdeuc-vm1 | 10.0.1.156 | 2 | 8 | ubuntu 22.04 LTS server | 被监控机 |
| 3 | amdeuc-vm2 | 10.0.1.157 | 1 | 4 | ubuntu 22.04 LTS server | 被监控机 |
| 4 | amdeuc-vm3 | 10.0.1.158 | 1 | 4 | ubuntu 22.04 LTS server | 被监控机 |
2. 在宿主机安装Prometheus
2.1 安装
个人觉得不用下载安装包这么复杂, 直接从ubuntu源安装
sudo apt-get install prometheus
检查prometheus 有没有启动
gateman@amdeuc-vm0:~$ systemctl status prometheus
● prometheus.service - Monitoring system and time series database
     Loaded: loaded (/lib/systemd/system/prometheus.service; enabled; vendor preset: enabled)
     Active: active (running) since Thu 2022-11-24 15:58:52 UTC; 4h 3min ago
       Docs: https://prometheus.io/docs/introduction/overview/
             man:prometheus(1)
   Main PID: 23080 (prometheus)
      Tasks: 7 (limit: 23310)
     Memory: 44.6M
        CPU: 30.744s
     CGroup: /system.slice/prometheus.service
             └─23080 /usr/bin/prometheus
2.2 检查配置文件
gateman@amdeuc-vm0:/etc/prometheus$ cat prometheus.yml
# Sample config for Prometheus.

global:
  scrape_interval:     15s # Set the scrape interval to every 15 seconds. Default is every 1 minute.
  evaluation_interval: 15s # Evaluate rules every 15 seconds. The default is every 1 minute.
  # scrape_timeout is set to the global default (10s).

  # Attach these labels to any time series or alerts when communicating with
  # external systems (federation, remote storage, Alertmanager).
  external_labels:
      monitor: 'example'

# Alertmanager configuration
alerting:
  alertmanagers:
  - static_configs:
    - targets: ['localhost:9093']

# Load rules once and periodically evaluate them according to the global 'evaluation_interval'.
rule_files:
  # - "first_rules.yml"
  # - "second_rules.yml"

# A scrape configuration containing exactly one endpoint to scrape:
# Here it's Prometheus itself.
scrape_configs:
  # The job name is added as a label `job=<job_name>` to any timeseries scraped from this config.
  - job_name: 'prometheus'

    # Override the global default and scrape targets from this job every 5 seconds.
    scrape_interval: 5s
    scrape_timeout: 5s

    # metrics_path defaults to '/metrics'
    # scheme defaults to 'http'.

    static_configs:
      - targets: ['localhost:9090']

  - job_name: node
    # If prometheus-node-exporter is installed, grab stats about the local
    # machine by default.
    static_configs:
      - targets: ['localhost:9100']
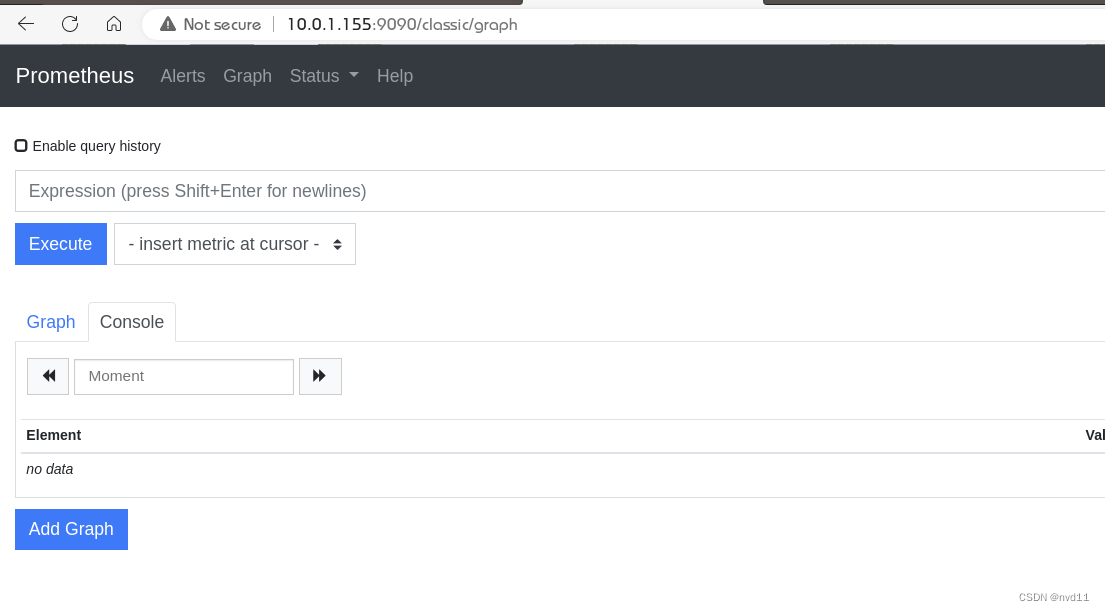
可以见prometheus 的 控制端口是9090
在浏览器访问服务器ip和9090 端口, 如果 prometheus 页面能打开就没什么问题
3. 在被监控节点安装node exporter
也是直接从ubuntu源里安装
sudo apt-get install prometheus-node-exporter
检查node exporter 服务有没有启动
gateman@amdeuc-vm3:~$ systemctl status prometheus-node-exporter
● prometheus-node-exporter.service - Prometheus exporter for machine metrics
     Loaded: loaded (/lib/systemd/system/prometheus-node-exporter.service; enabled; vendor preset: enabled)
     Active: active (running) since Fri 2022-11-25 11:49:24 UTC; 5min ago
       Docs: https://github.com/prometheus/node_exporter
   Main PID: 1567 (prometheus-node)
      Tasks: 4 (limit: 4460)
     Memory: 2.2M
        CPU: 7ms
     CGroup: /system.slice/prometheus-node-exporter.service
             └─1567 /usr/bin/prometheus-node-exporter

Nov 25 11:49:24 amdeuc-vm3 prometheus-node-exporter[1567]: ts=2022-11-25T11:49:24.830Z caller=node_exporter.go:115 level=info collector=thermal_zone
Nov 25 11:49:24 amdeuc-vm3 prometheus-node-exporter[1567]: ts=2022-11-25T11:49:24.830Z caller=node_exporter.go:115 level=info collector=time
Nov 25 11:49:24 amdeuc-vm3 prometheus-node-exporter[1567]: ts=2022-11-25T11:49:24.830Z caller=node_exporter.go:115 level=info collector=timex
Nov 25 11:49:24 amdeuc-vm3 prometheus-node-exporter[1567]: ts=2022-11-25T11:49:24.830Z caller=node_exporter.go:115 level=info collector=udp_queues
Nov 25 11:49:24 amdeuc-vm3 prometheus-node-exporter[1567]: ts=2022-11-25T11:49:24.830Z caller=node_exporter.go:115 level=info collector=uname
Nov 25 11:49:24 amdeuc-vm3 prometheus-node-exporter[1567]: ts=2022-11-25T11:49:24.830Z caller=node_exporter.go:115 level=info collector=vmstat
Nov 25 11:49:24 amdeuc-vm3 prometheus-node-exporter[1567]: ts=2022-11-25T11:49:24.830Z caller=node_exporter.go:115 level=info collector=xfs
Nov 25 11:49:24 amdeuc-vm3 prometheus-node-exporter[1567]: ts=2022-11-25T11:49:24.830Z caller=node_exporter.go:115 level=info collector=zfs
Nov 25 11:49:24 amdeuc-vm3 prometheus-node-exporter[1567]: ts=2022-11-25T11:49:24.830Z caller=node_exporter.go:199 level=info msg="Listening on" address=:9100
Nov 25 11:49:24 amdeuc-vm3 prometheus-node-exporter[1567]: ts=2022-11-25T11:49:24.830Z caller=tls_config.go:195 level=info msg="TLS is disabled." http2=false
可以简单监控端口是9100
4. 配置监控机的 prometheus.xml 加入被监控的节点
  - job_name: node
    # If prometheus-node-exporter is installed, grab stats about the local
    # machine by default.
    static_configs:
      - targets: ['localhost:9100', '10.0.1.156:9100', '10.0.1.157:9100', '10.0.1.158:9100']
然后重启服务
sudo systemctl restart prometheus
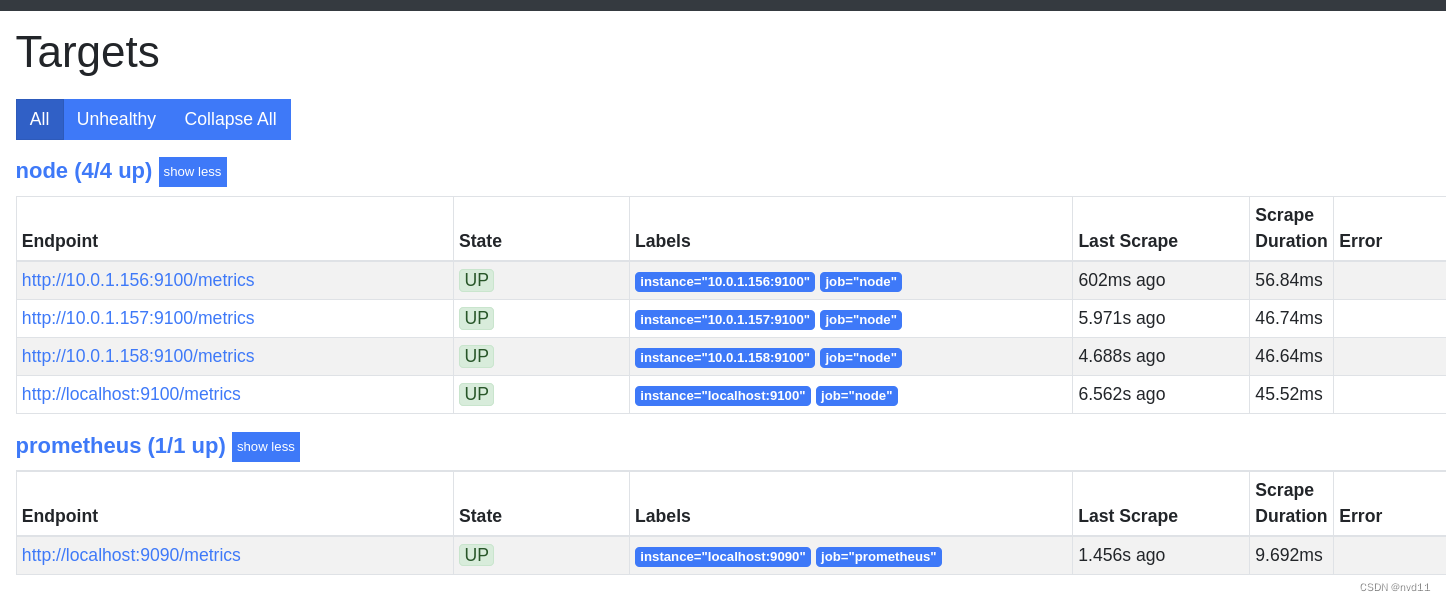
再打开 prometheus 的监控列表, 发现 已经有4个节点被监控了, 包括监控机本身
5.安装Grafana
没想到grafana居然不在ubuntu的默认仓库…
sudo wget -q -O - https://packages.grafana.com/gpg.key | sudo apt-key add -
echo "deb https://packages.grafana.com/oss/deb stable main" | sudo tee -a /etc/apt/sources.list.d/grafana.list
sudo apt-get update
sudo apt install grafana
安装完后检查服务有没有启动
systemctl status grafana-server
没有就手动起来
gateman@amdeuc-vm0:/etc/prometheus$ sudo systemctl start grafana-server
gateman@amdeuc-vm0:/etc/prometheus$ sudo systemctl enable grafana-server
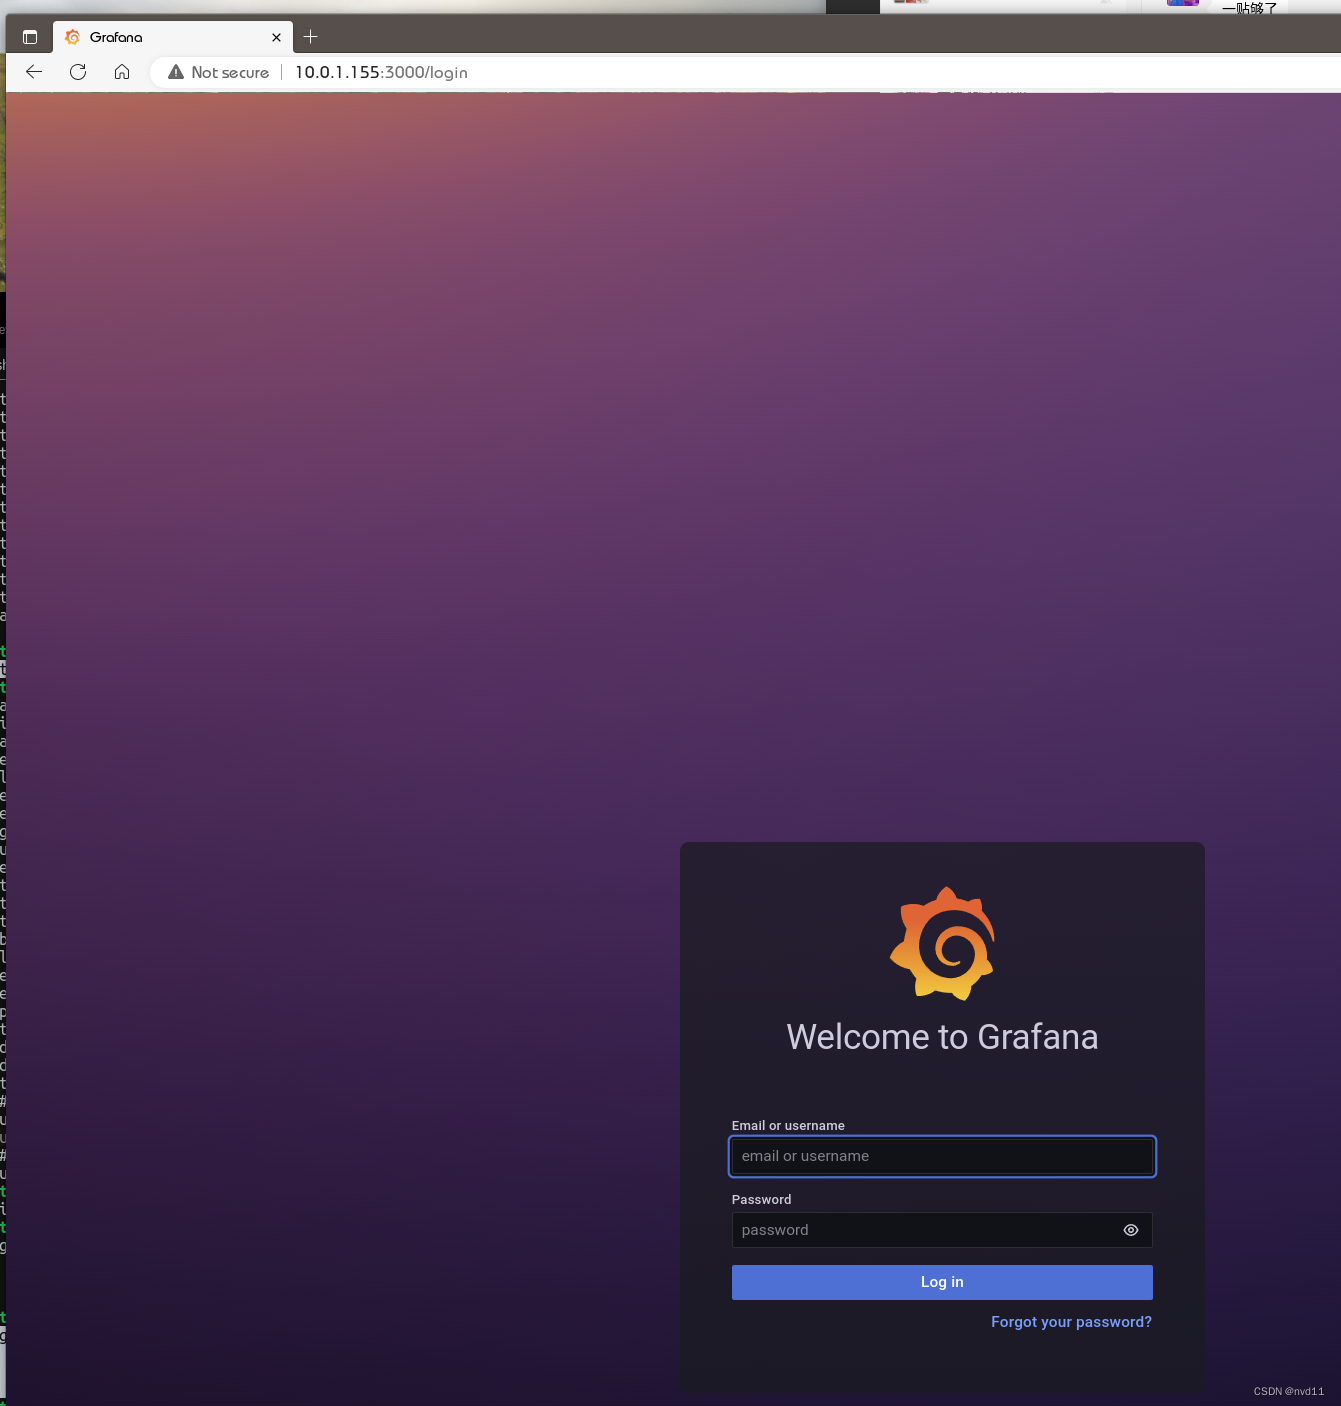
grafana 的默认端口是3000
再浏览器打开ip:3000, 如果见到grafana页面就代表安装好了
6.配置grafana
默认账号和密码都是admin 先登录再说
登录后马上要求你改密码的
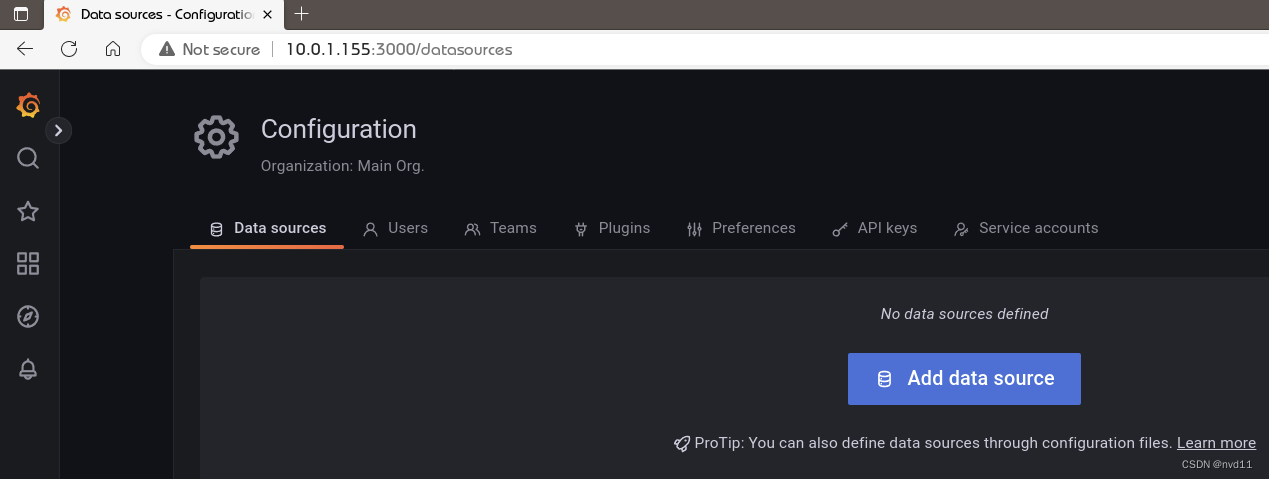
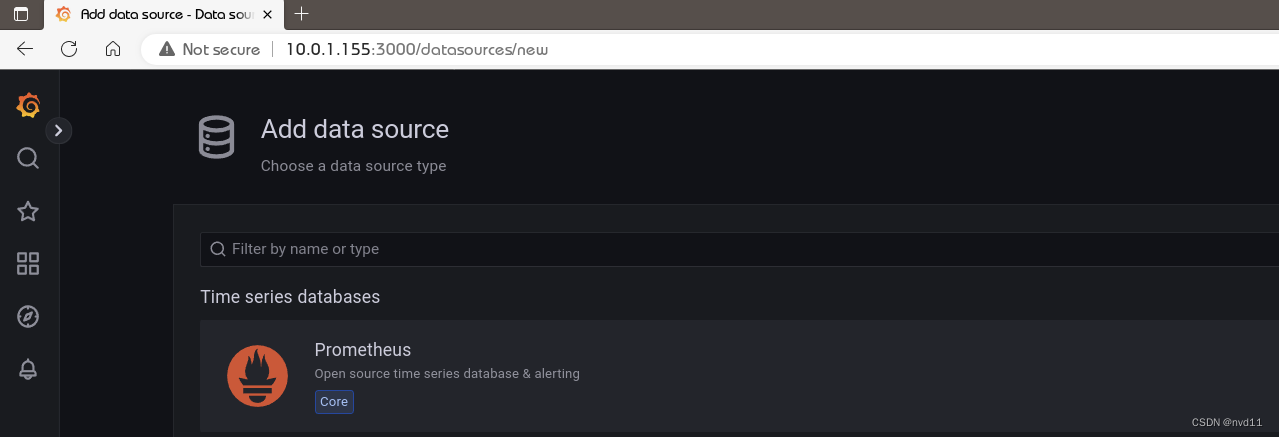
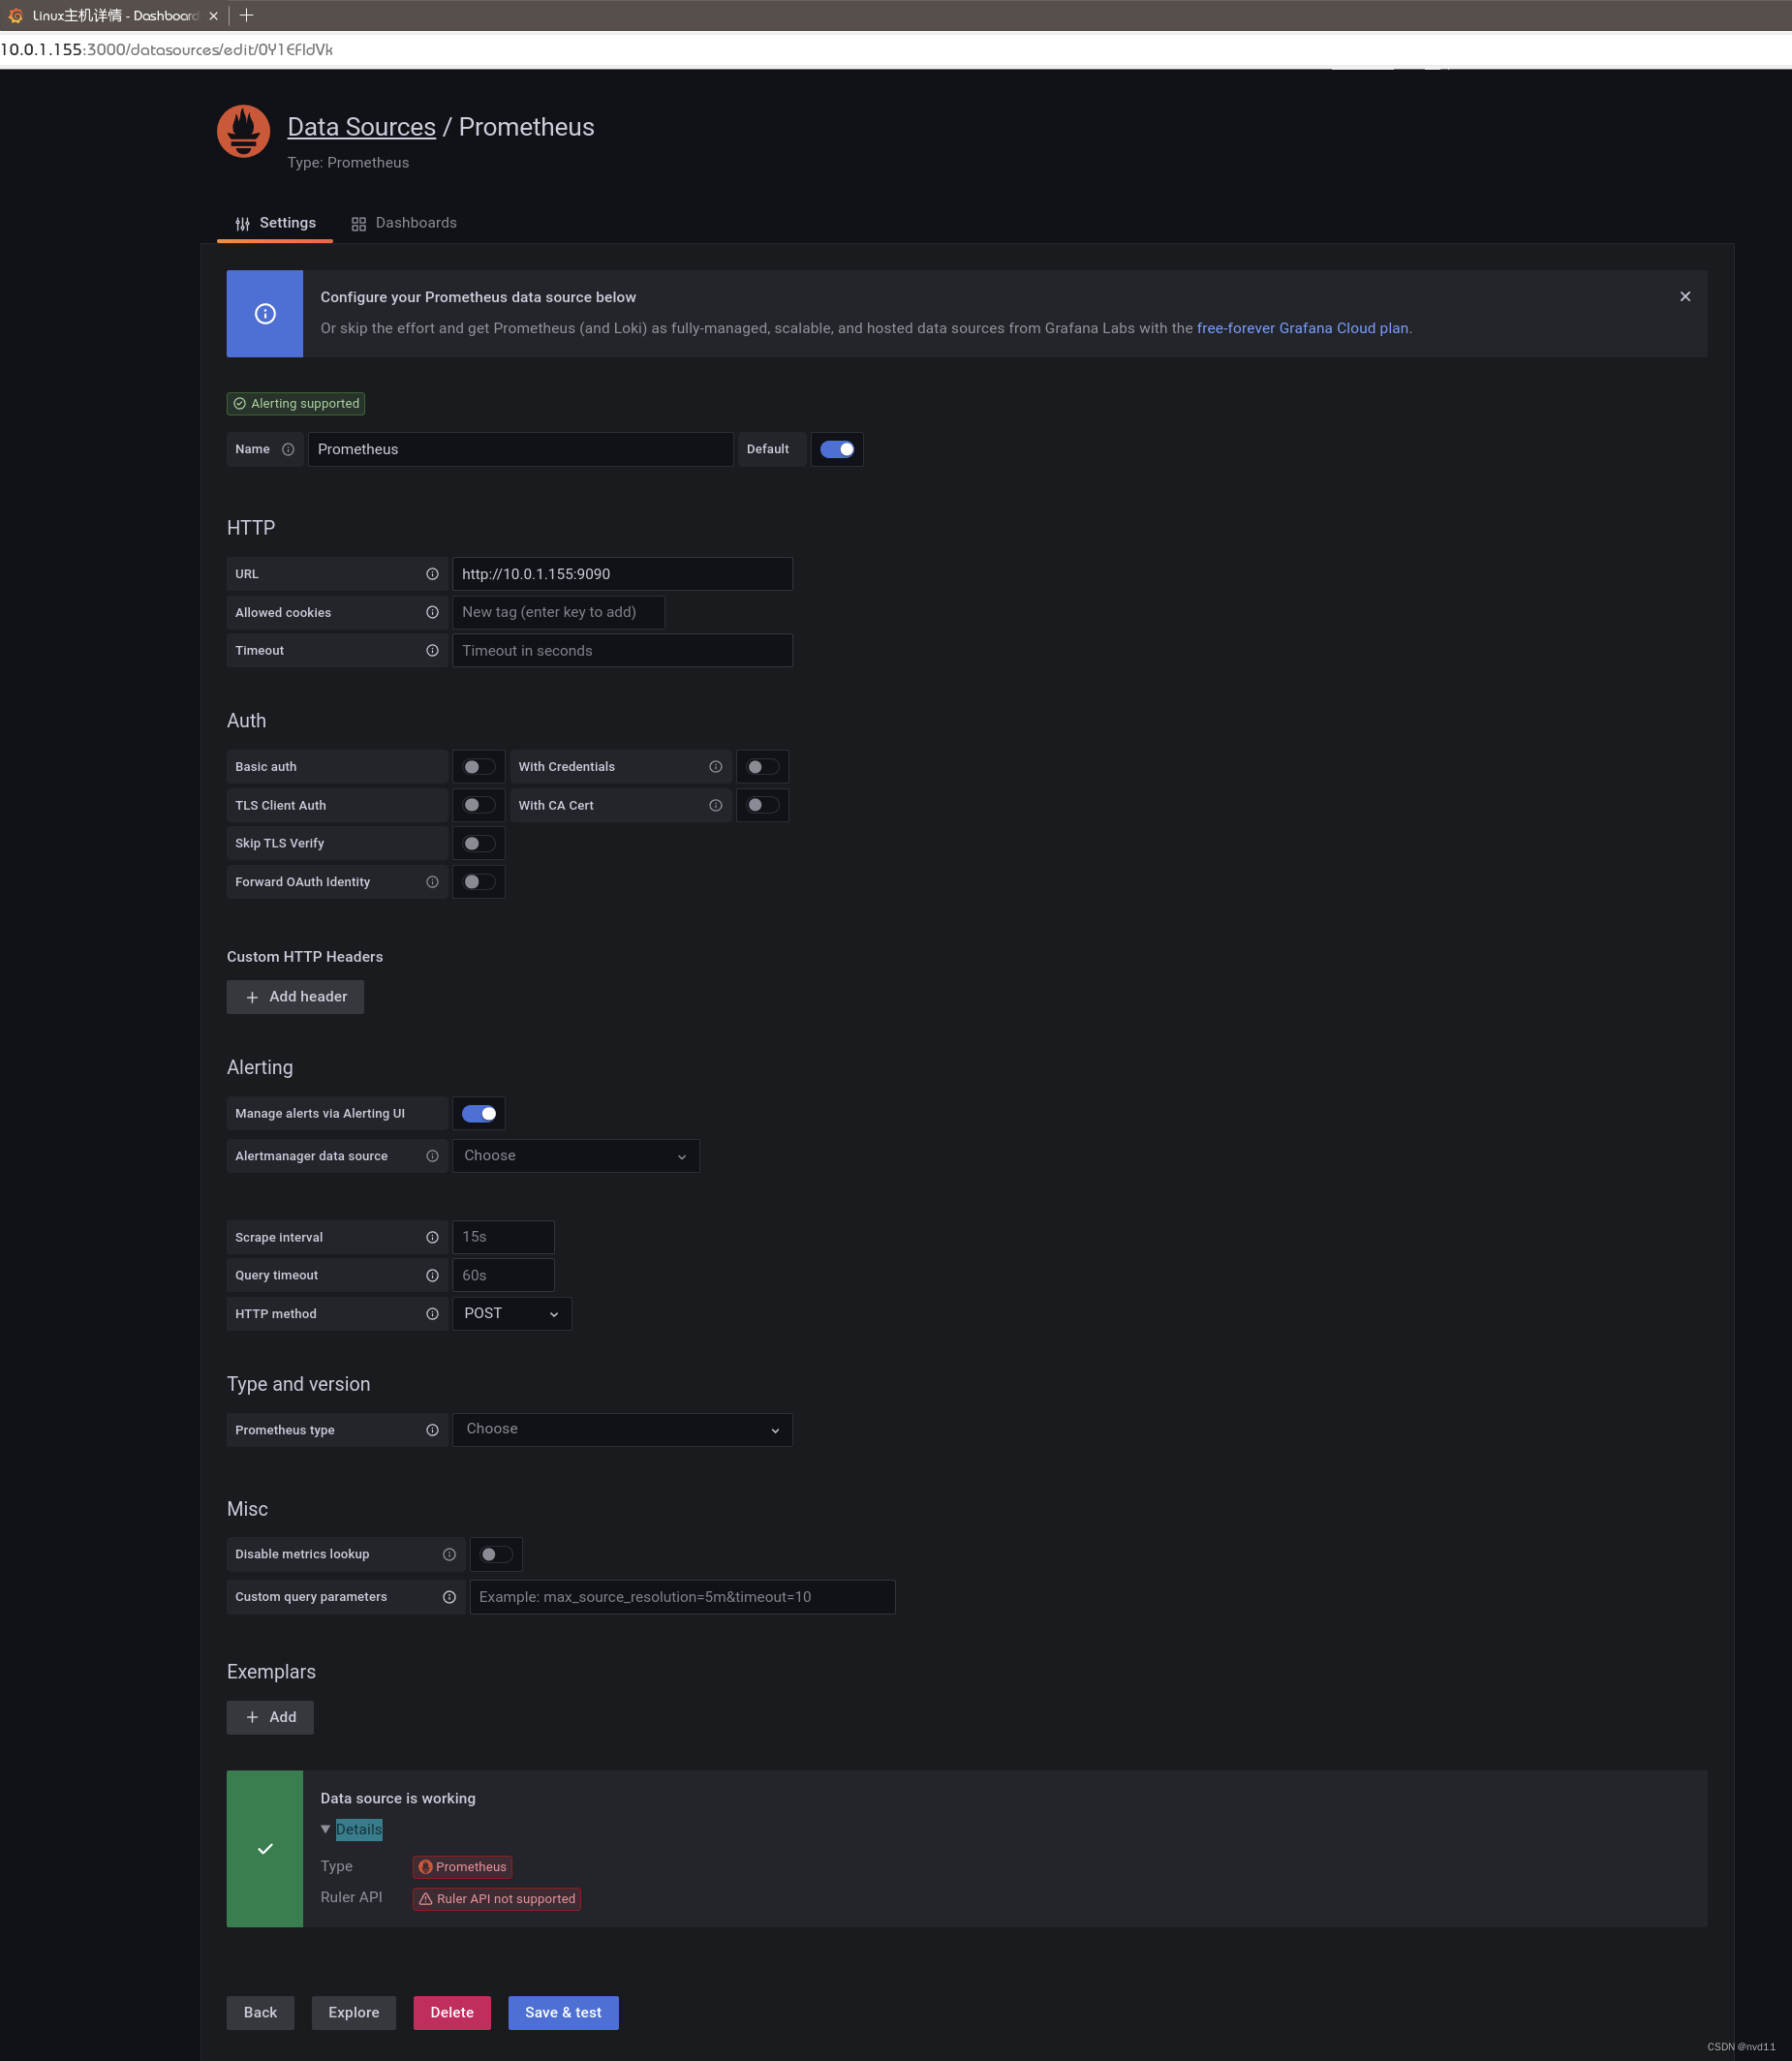
6.1 添加数据源
Configuration -> Data Sources ->add data source -> Prometheus
6.2 添加Dashboard
接下来我们先去下载一个模板
https://grafana.com/grafana/dashboards/?search=8919
把Json文件下载下来就好
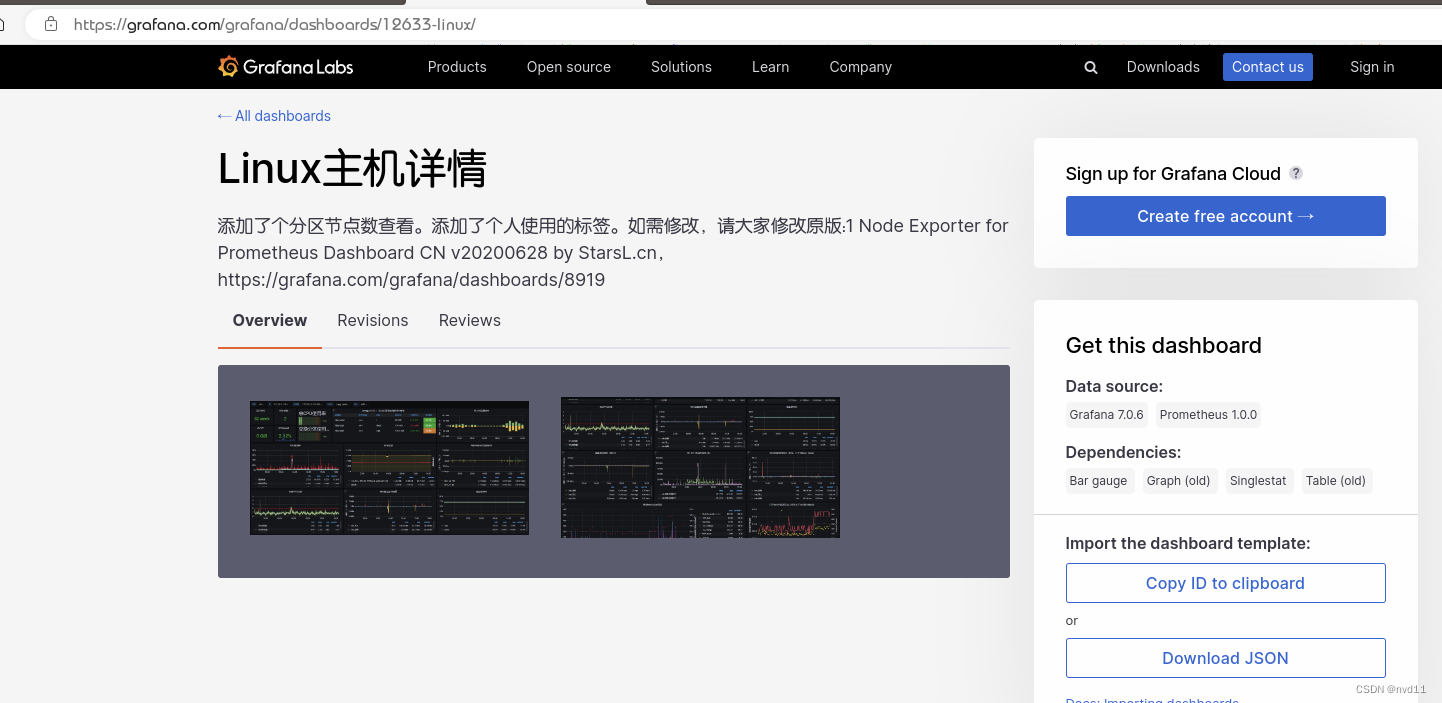
然后在grafana
New Dashboard -> Import Json
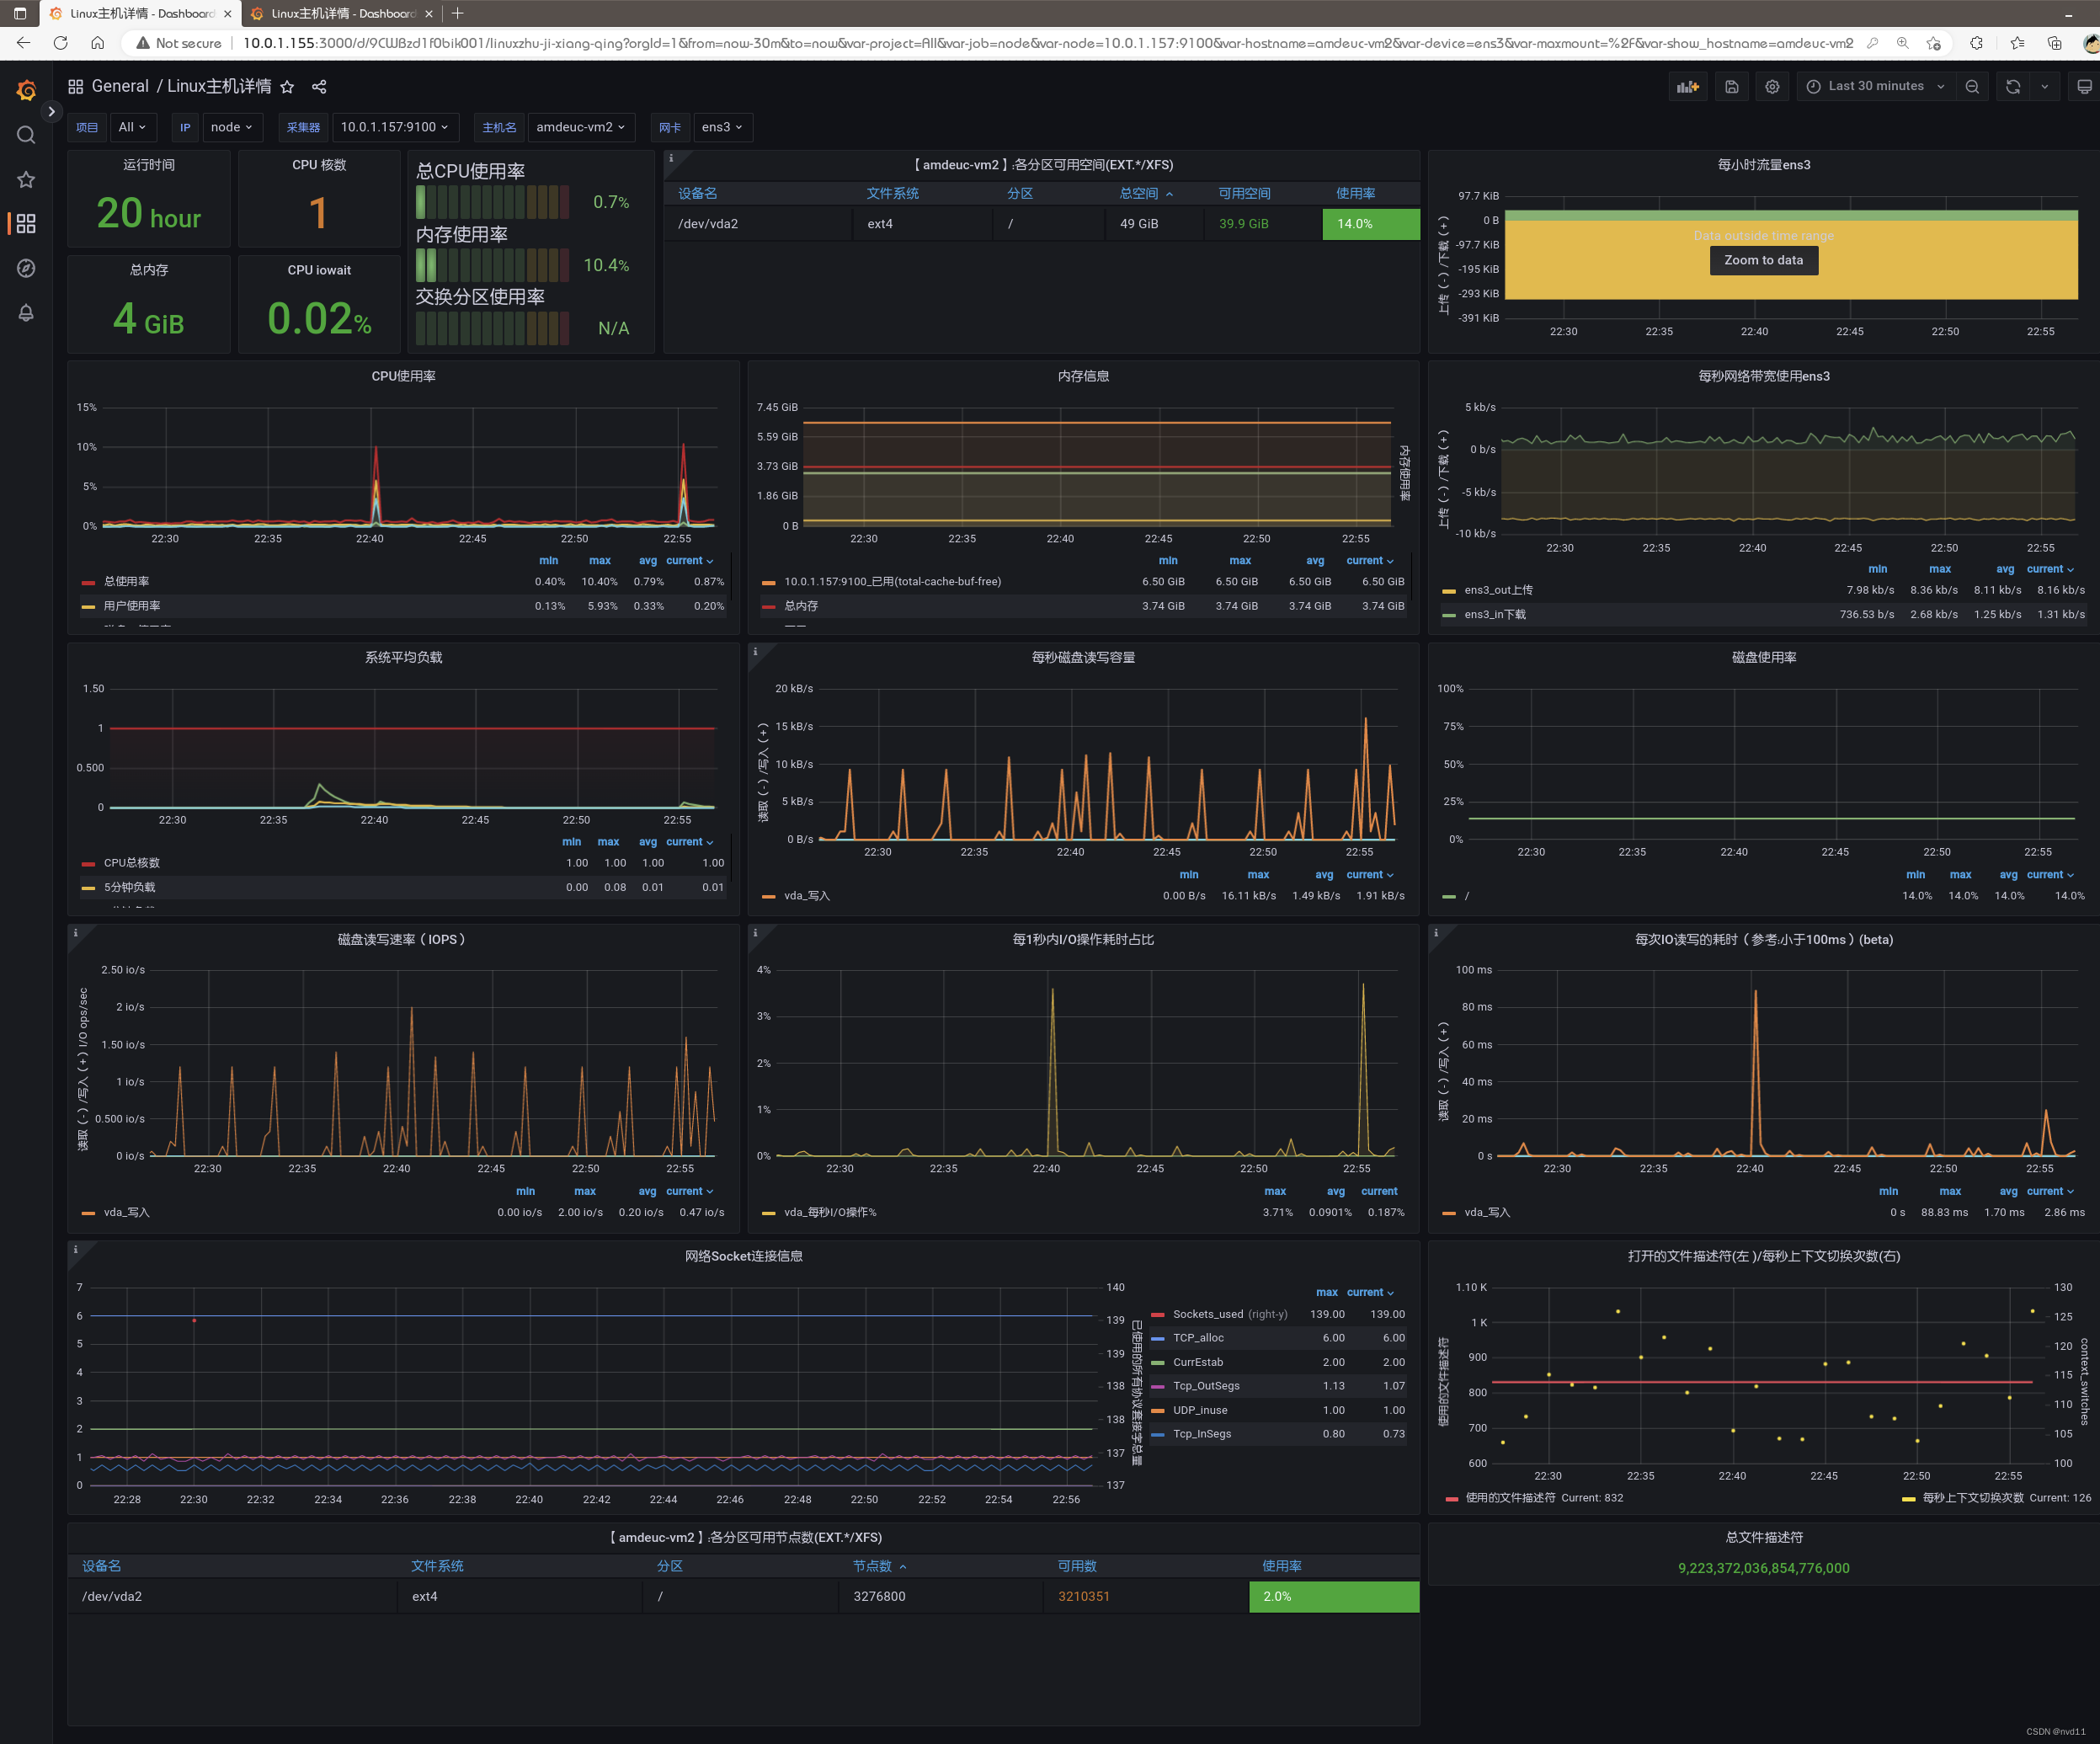
就得到1个比较完善的linux主机详情模板了


![[附源码]java毕业设计智能超市导购系统](https://img-blog.csdnimg.cn/115bad91fc904e0a91a29db6cabb1cce.png)