需求
收集 ES 的指标, 并进行展示和告警;
现状
- ES 通过 docker compose 安装
- 所在环境的 K8S 集群有 Prometheus 和 AlertManager 及 Grafana
方案
复用现有的监控体系, 通过: Prometheus 监控 ES.

具体实现为:
采集端 elasticsearch_exporter
可以监控的指标为:
| Name | Type | Cardinality | Help |
|---|---|---|---|
| elasticsearch_breakers_estimated_size_bytes | gauge | 4 | Estimated size in bytes of breaker |
| elasticsearch_breakers_limit_size_bytes | gauge | 4 | Limit size in bytes for breaker |
| elasticsearch_breakers_tripped | counter | 4 | tripped for breaker |
| elasticsearch_cluster_health_active_primary_shards | gauge | 1 | The number of primary shards in your cluster. This is an aggregate total across all indices. |
| elasticsearch_cluster_health_active_shards | gauge | 1 | Aggregate total of all shards across all indices, which includes replica shards. |
| elasticsearch_cluster_health_delayed_unassigned_shards | gauge | 1 | Shards delayed to reduce reallocation overhead |
| elasticsearch_cluster_health_initializing_shards | gauge | 1 | Count of shards that are being freshly created. |
| elasticsearch_cluster_health_number_of_data_nodes | gauge | 1 | Number of data nodes in the cluster. |
| elasticsearch_cluster_health_number_of_in_flight_fetch | gauge | 1 | The number of ongoing shard info requests. |
| elasticsearch_cluster_health_number_of_nodes | gauge | 1 | Number of nodes in the cluster. |
| elasticsearch_cluster_health_number_of_pending_tasks | gauge | 1 | Cluster level changes which have not yet been executed |
| elasticsearch_cluster_health_task_max_waiting_in_queue_millis | gauge | 1 | Max time in millis that a task is waiting in queue. |
| elasticsearch_cluster_health_relocating_shards | gauge | 1 | The number of shards that are currently moving from one node to another node. |
| elasticsearch_cluster_health_status | gauge | 3 | Whether all primary and replica shards are allocated. |
| elasticsearch_cluster_health_timed_out | gauge | 1 | Number of cluster health checks timed out |
| elasticsearch_cluster_health_unassigned_shards | gauge | 1 | The number of shards that exist in the cluster state, but cannot be found in the cluster itself. |
| elasticsearch_clustersettings_stats_max_shards_per_node | gauge | 0 | Current maximum number of shards per node setting. |
| elasticsearch_filesystem_data_available_bytes | gauge | 1 | Available space on block device in bytes |
| elasticsearch_filesystem_data_free_bytes | gauge | 1 | Free space on block device in bytes |
| elasticsearch_filesystem_data_size_bytes | gauge | 1 | Size of block device in bytes |
| elasticsearch_filesystem_io_stats_device_operations_count | gauge | 1 | Count of disk operations |
| elasticsearch_filesystem_io_stats_device_read_operations_count | gauge | 1 | Count of disk read operations |
| elasticsearch_filesystem_io_stats_device_write_operations_count | gauge | 1 | Count of disk write operations |
| elasticsearch_filesystem_io_stats_device_read_size_kilobytes_sum | gauge | 1 | Total kilobytes read from disk |
| elasticsearch_filesystem_io_stats_device_write_size_kilobytes_sum | gauge | 1 | Total kilobytes written to disk |
| elasticsearch_indices_active_queries | gauge | 1 | The number of currently active queries |
| elasticsearch_indices_docs | gauge | 1 | Count of documents on this node |
| elasticsearch_indices_docs_deleted | gauge | 1 | Count of deleted documents on this node |
| elasticsearch_indices_docs_primary | gauge | Count of documents with only primary shards on all nodes | |
| elasticsearch_indices_fielddata_evictions | counter | 1 | Evictions from field data |
| elasticsearch_indices_fielddata_memory_size_bytes | gauge | 1 | Field data cache memory usage in bytes |
| elasticsearch_indices_filter_cache_evictions | counter | 1 | Evictions from filter cache |
| elasticsearch_indices_filter_cache_memory_size_bytes | gauge | 1 | Filter cache memory usage in bytes |
| elasticsearch_indices_flush_time_seconds | counter | 1 | Cumulative flush time in seconds |
| elasticsearch_indices_flush_total | counter | 1 | Total flushes |
| elasticsearch_indices_get_exists_time_seconds | counter | 1 | Total time get exists in seconds |
| elasticsearch_indices_get_exists_total | counter | 1 | Total get exists operations |
| elasticsearch_indices_get_missing_time_seconds | counter | 1 | Total time of get missing in seconds |
| elasticsearch_indices_get_missing_total | counter | 1 | Total get missing |
| elasticsearch_indices_get_time_seconds | counter | 1 | Total get time in seconds |
...
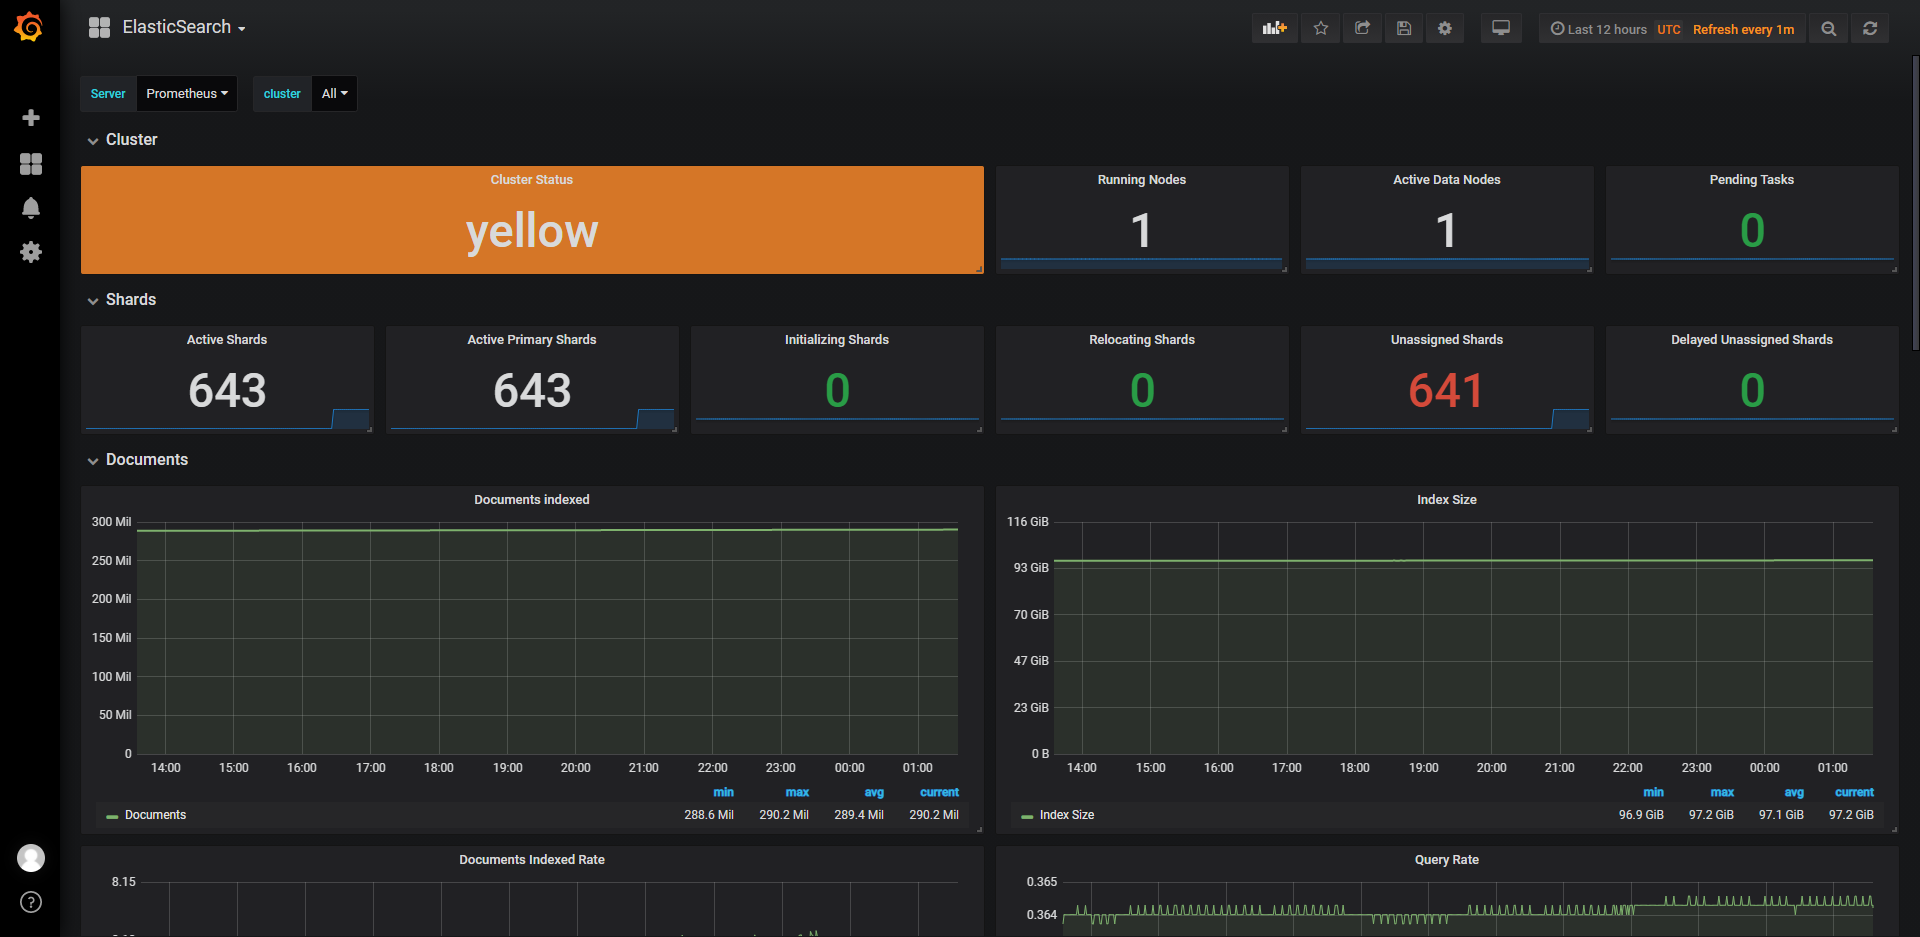
展示端 基于Grafana
📚️ Reference:
ElasticSearch dashboard for Grafana | Grafana Labs
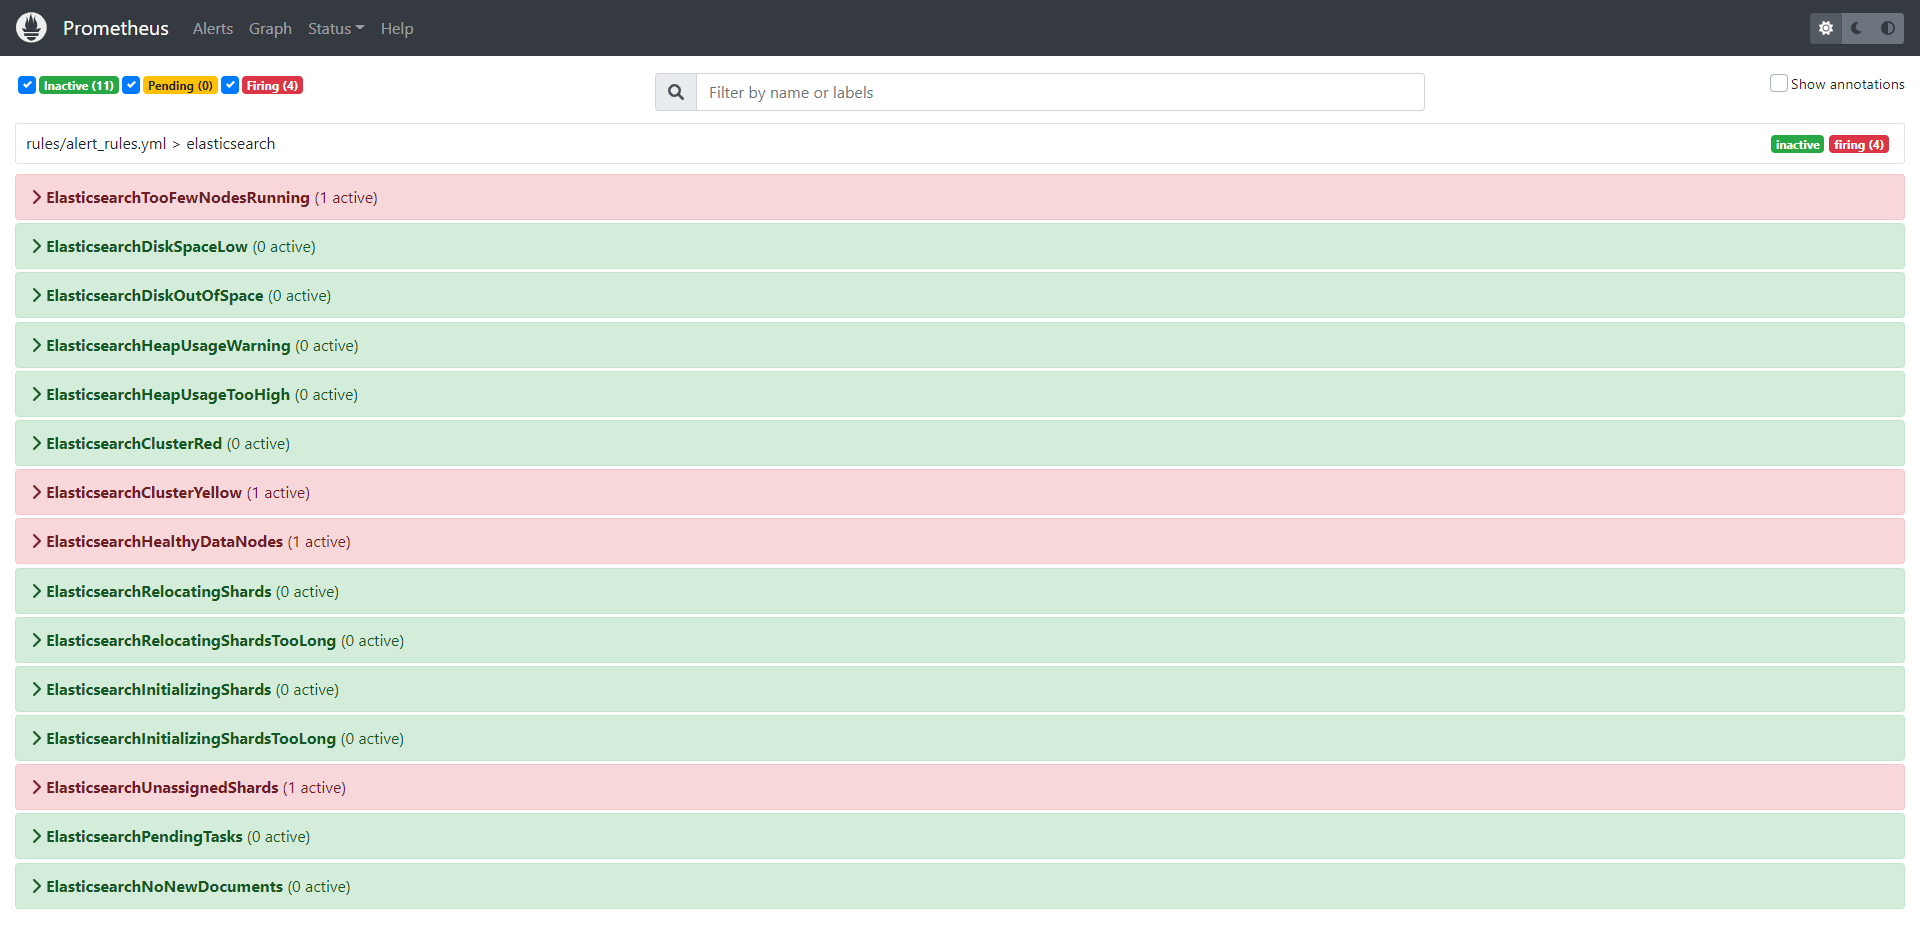
告警指标 基于prometheus alertmanager
📚️ Reference:
ElasticSearch:https://awesome-prometheus-alerts.grep.to/rules.html#elasticsearch-1
实施步骤
以下为手动实施步骤
Docker Compose
docker pull quay.io/prometheuscommunity/elasticsearch-exporter:v1.3.0docker-compose.yml 示例:
🐾 Warning:
exporter 在每次刮削时都会从 ElasticSearch 集群中获取信息,因此过短的刮削间隔会给 ES 主节点带来负载,特别是当你使用
--es.all和--es.indices运行时。我们建议你测量获取/_nodes/stats和/_all/_stats对你的ES集群来说需要多长时间,以确定你的刮削间隔是否太短。
原 ES 的 docker-copmose.yml 示例如下:
version: '3'
services:
  elasticsearch:
    image: elasticsearch-plugins:6.8.18
    ...
    ports:
      - 9200:9200
      - 9300:9300
    restart: always
增加了 elasticsearch_exporter 的yaml如下:
version: '3'
services:
  elasticsearch:
    image: elasticsearch-plugins:6.8.18
    ...
    ports:
      - 9200:9200
      - 9300:9300
    restart: always
  elasticsearch_exporter:
      image: quay.io/prometheuscommunity/elasticsearch-exporter:v1.3.0
      command:
      - '--es.uri=http://elasticsearch:9200'
      - '--es.all'
      - '--es.indices'
      - '--es.indices_settings'
      - '--es.indices_mappings'
      - '--es.shards'
      - '--es.snapshots'
      - '--es.timeout=30s'
      restart: always
      ports:
      - "9114:9114"
Prometheus 配置调整
prometheus 配置
Prometheus 增加静态抓取配置:
scrape_configs:
  - job_name: "es"
    static_configs:
      - targets: ["x.x.x.x:9114"]
说明:
x.x.x.x 为 ES Exporter IP, 因为 ES Exporter 通过 docker compose 和 ES部署在同一台机器, 所以这个 IP 也是 ES 的IP.
Prometheus Rules
增加 ES 相关的 Prometheus Rules:
groups:
  - name: elasticsearch
    rules:
      - record: elasticsearch_filesystem_data_used_percent
        expr: 100 * (elasticsearch_filesystem_data_size_bytes - elasticsearch_filesystem_data_free_bytes)
          / elasticsearch_filesystem_data_size_bytes
      - record: elasticsearch_filesystem_data_free_percent
        expr: 100 - elasticsearch_filesystem_data_used_percent
      - alert: ElasticsearchTooFewNodesRunning
        expr: elasticsearch_cluster_health_number_of_nodes < 3
        for: 0m
        labels:
          severity: critical
        annotations:
          description: "Missing node in Elasticsearch cluster\n  VALUE = {{ $value }}\n  LABELS = {{ $labels }}"
          summary: ElasticSearch running on less than 3 nodes(instance {{ $labels.instance }}, node {{$labels.node}})
      - alert: ElasticsearchDiskSpaceLow
        expr: elasticsearch_filesystem_data_free_percent < 20
        for: 2m
        labels:
          severity: warning
        annotations:
          summary: Elasticsearch disk space low (instance {{ $labels.instance }}, node {{$labels.node}})
          description: "The disk usage is over 80%\n  VALUE = {{ $value }}\n  LABELS = {{ $labels }}"
      - alert: ElasticsearchDiskOutOfSpace
        expr: elasticsearch_filesystem_data_free_percent < 10
        for: 0m
        labels:
          severity: critical
        annotations:
          summary: Elasticsearch disk out of space (instance {{ $labels.instance }}, node {{$labels.node}})
          description: "The disk usage is over 90%\n  VALUE = {{ $value }}\n  LABELS = {{ $labels }}"
      - alert: ElasticsearchHeapUsageWarning
        expr: (elasticsearch_jvm_memory_used_bytes{area="heap"} / elasticsearch_jvm_memory_max_bytes{area="heap"}) * 100 > 80
        for: 2m
        labels:
          severity: warning
        annotations:
          summary: Elasticsearch Heap Usage warning (instance {{ $labels.instance }}, node {{$labels.node}})
          description: "The heap usage is over 80%\n  VALUE = {{ $value }}\n  LABELS = {{ $labels }}"
      - alert: ElasticsearchHeapUsageTooHigh
        expr: (elasticsearch_jvm_memory_used_bytes{area="heap"} / elasticsearch_jvm_memory_max_bytes{area="heap"}) * 100 > 90
        for: 2m
        labels:
          severity: critical
        annotations:
          summary: Elasticsearch Heap Usage Too High (instance {{ $labels.instance }}, node {{$labels.node}})
          description: "The heap usage is over 90%\n  VALUE = {{ $value }}\n  LABELS = {{ $labels }}"
      - alert: ElasticsearchClusterRed
        expr: elasticsearch_cluster_health_status{color="red"} == 1
        for: 0m
        labels:
          severity: critical
        annotations:
          summary: Elasticsearch Cluster Red (instance {{ $labels.instance }}, node {{$labels.node}})
          description: "Elastic Cluster Red status\n  VALUE = {{ $value }}\n  LABELS = {{ $labels }}"
      - alert: ElasticsearchClusterYellow
        expr: elasticsearch_cluster_health_status{color="yellow"} == 1
        for: 0m
        labels:
          severity: warning
        annotations:
          summary: Elasticsearch Cluster Yellow (instance {{ $labels.instance }}, node {{$labels.node}})
          description: "Elastic Cluster Yellow status\n  VALUE = {{ $value }}\n  LABELS = {{ $labels }}"
      - alert: ElasticsearchHealthyDataNodes
        expr: elasticsearch_cluster_health_number_of_data_nodes < 3
        for: 0m
        labels:
          severity: critical
        annotations:
          summary: Elasticsearch Healthy Data Nodes (instance {{ $labels.instance }}, node {{$labels.node}})
          description: "Missing data node in Elasticsearch cluster\n  VALUE = {{ $value }}\n  LABELS = {{ $labels }}"
      - alert: ElasticsearchRelocatingShards
        expr: elasticsearch_cluster_health_relocating_shards > 0
        for: 0m
        labels:
          severity: info
        annotations:
          summary: Elasticsearch relocating shards (instance {{ $labels.instance }}, node {{$labels.node}})
          description: "Elasticsearch is relocating shards\n  VALUE = {{ $value }}\n  LABELS = {{ $labels }}"
      - alert: ElasticsearchRelocatingShardsTooLong
        expr: elasticsearch_cluster_health_relocating_shards > 0
        for: 15m
        labels:
          severity: warning
        annotations:
          summary: Elasticsearch relocating shards too long (instance {{ $labels.instance }}, node {{$labels.node}})
          description: "Elasticsearch has been relocating shards for 15min\n  VALUE = {{ $value }}\n  LABELS = {{ $labels }}"
      - alert: ElasticsearchInitializingShards
        expr: elasticsearch_cluster_health_initializing_shards > 0
        for: 0m
        labels:
          severity: info
        annotations:
          summary: Elasticsearch initializing shards (instance {{ $labels.instance }}, node {{$labels.node}})
          description: "Elasticsearch is initializing shards\n  VALUE = {{ $value }}\n  LABELS = {{ $labels }}"
      - alert: ElasticsearchInitializingShardsTooLong
        expr: elasticsearch_cluster_health_initializing_shards > 0
        for: 15m
        labels:
          severity: warning
        annotations:
          summary: Elasticsearch initializing shards too long (instance {{ $labels.instance }}, node {{$labels.node}})
          description: "Elasticsearch has been initializing shards for 15 min\n  VALUE = {{ $value }}\n  LABELS = {{ $labels }}"
      - alert: ElasticsearchUnassignedShards
        expr: elasticsearch_cluster_health_unassigned_shards > 0
        for: 0m
        labels:
          severity: critical
        annotations:
          summary: Elasticsearch unassigned shards (instance {{ $labels.instance }}, node {{$labels.node}})
          description: "Elasticsearch has unassigned shards\n  VALUE = {{ $value }}\n  LABELS = {{ $labels }}"
      - alert: ElasticsearchPendingTasks
        expr: elasticsearch_cluster_health_number_of_pending_tasks > 0
        for: 15m
        labels:
          severity: warning
        annotations:
          summary: Elasticsearch pending tasks (instance {{ $labels.instance }}, node {{$labels.node}})
          description: "Elasticsearch has pending tasks. Cluster works slowly.\n  VALUE = {{ $value }}\n  LABELS = {{ $labels }}"
      - alert: ElasticsearchNoNewDocuments
        expr: increase(elasticsearch_indices_docs{es_data_node="true"}[10m]) < 1
        for: 0m
        labels:
          severity: warning
        annotations:
          summary: Elasticsearch no new documents (instance {{ $labels.instance }}, node {{$labels.node}})
          description: "No new documents for 10 min!\n  VALUE = {{ $value }}\n  LABELS = {{ $labels }}"
并重启生效.
🐾Warning:
ElasticsearchTooFewNodesRunning告警的条件是 es 集群的node 少于 3个, 对于单节点 ES 会误报, 所以按需开启rule或按需屏蔽(slience).ElasticsearchHealthyDataNodes告警同上.
AlertManager 告警规则及收件人配置
按需调整, 示例如下:
'global':
  'smtp_smarthost': ''
  'smtp_from': ''
  'smtp_require_tls': false
  'resolve_timeout': '5m'
'receivers':
  - 'name': 'es-email'
    'email_configs':
      - 'to': 'sfw@example.com,sdfwef@example.com'
        'send_resolved': true
'route':
  'group_by':
    - 'job'
  'group_interval': '5m'
  'group_wait': '30s'
  'routes':
    - 'receiver': 'es-email'
      'match':
        'job': 'es'
并重启生效.
Grafana 配置
导入 json 格式的 Grafana Dashboard: (完整Dashboard可以直接通过 Grafana 搜索获取)
{
    "__inputs": [],
    "__requires": [
        {
            "type": "grafana",
            "id": "grafana",
            "name": "Grafana",
            "version": "5.4.0"
        },
        {
            "type": "panel",
            "id": "graph",
            "name": "Graph",
            "version": "5.0.0"
        },
        {
            "type": "datasource",
            "id": "prometheus",
            "name": "Prometheus",
            "version": "5.0.0"
        },
        {
            "type": "panel",
            "id": "singlestat",
            "name": "Singlestat",
            "version": "5.0.0"
        }
    ],
    "annotations": {
        "list": [
            {
                "builtIn": 1,
                "datasource": "-- Grafana --",
                "enable": true,
                "hide": true,
                "iconColor": "rgba(0, 211, 255, 1)",
                "name": "Annotations & Alerts",
                "type": "dashboard"
            }
        ]
    },
    "editable": true,
    "gnetId": null,
    "graphTooltip": 1,
    "id": null,
    "iteration": 1549021227642,
    "links": [],
    "panels": [
        {
            "gridPos": {
                "h": 1,
                "w": 24,
                "x": 0,
                "y": 0
            },
            "id": 90,
            "title": "Cluster",
            "type": "row"
        },
        {
            "cacheTimeout": null,
            "colorBackground": true,
            "colorPostfix": false,
            "colorPrefix": false,
            "colorValue": false,
            "colors": [
                "#299c46",
                "rgba(237, 129, 40, 0.89)",
                "#d44a3a"
            ],
            "format": "none",
            "gauge": {
                "maxValue": 100,
                "minValue": 0,
                "show": false,
                "thresholdLabels": false,
                "thresholdMarkers": true
            },
            "gridPos": {
                "h": 3,
                "w": 12,
                "x": 0,
                "y": 1
            },
            "id": 92,
            "interval": null,
            "links": [],
            "mappingType": 1,
            "mappingTypes": [
                {
                    "name": "value to text",
                    "value": 1
                },
                {
                    "name": "range to text",
                    "value": 2
                }
            ],
            "maxDataPoints": 100,
            "nullPointMode": "connected",
            "nullText": null,
            "postfix": "",
            "postfixFontSize": "50%",
            "prefix": "",
            "prefixFontSize": "50%",
            "rangeMaps": [
                {
                    "from": "null",
                    "text": "N/A",
                    "to": "null"
                }
            ],
            "sparkline": {
                "fillColor": "rgba(31, 118, 189, 0.18)",
                "full": false,
                "lineColor": "rgb(31, 120, 193)",
                "show": false
            },
            "tableColumn": "Value",
            "targets": [
                {
                    "expr": "scalar(elasticsearch_cluster_health_status{color=\"green\",cluster=~\"$cluster\"}) + scalar(elasticsearch_cluster_health_status{color=\"yellow\",cluster=~\"$cluster\"}) * 2 + scalar(elasticsearch_cluster_health_status{color=\"red\",cluster=~\"$cluster\"}) * 3",
                    "format": "time_series",
                    "instant": false,
                    "intervalFactor": 1,
                    "legendFormat": "",
                    "refId": "A"
                }
            ],
...
📚️ 参考文档
- prometheus-community/elasticsearch_exporter: Elasticsearch stats exporter for Prometheus (github.com)
- ElasticSearch dashboard for Grafana | Grafana Labs
- Awesome Prometheus alerts | Collection of alerting rules (grep.to)
本文由东风微鸣技术博客 EWhisper.cn 编写!