之前的文章中,分享过Matlab气泡图的绘制模板:

图虽说好看,但有一个缺点:需要手动调节两个图例的位置。
为了解决这一问题,我们不妨结合前段时间分享的紧凑排列多子图的绘制模板:

从而达到自动对齐排列的效果:
特别提示:本期内容『数据+代码』已上传资源群中,加群的朋友请自行下载。有需要的朋友可以关注同名公号【阿昆的科研日常】,后台回复关键词【绘图桶】查看加入方式。
模板中最关键的部分内容:
1. 数据准备
此部分主要是读取原始数据并初始化绘图参数。
% 读取数据load data.mat% 初始化绘图参数xx = data(:,1);yy = data(:,2);f1 = data(:,3);f2 = data(:,3)*10;
2. 颜色定义
作图不配色就好比做菜不放盐,总让人感觉少些味道。
但颜色搭配比较考验个人审美,需要多加尝试。
这里直接使用TheColor配色工具中的SCI权威配色库:
map = TheColor('sci',2068);% map = flipud(map);

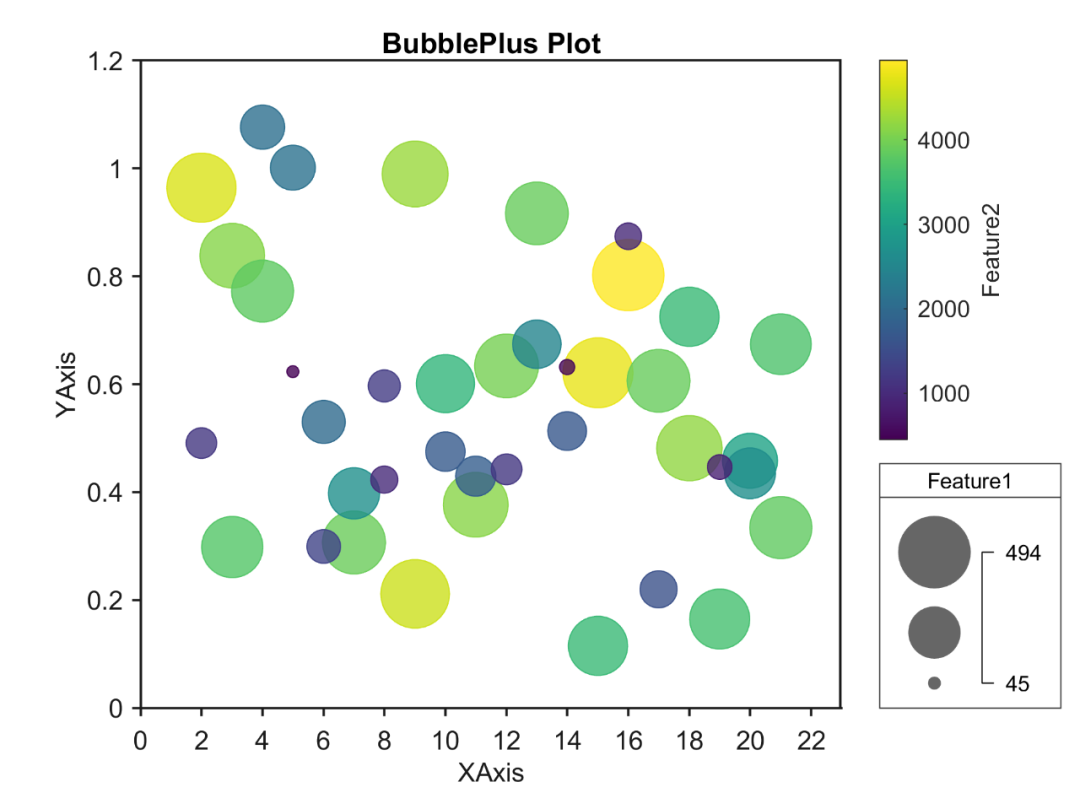
3. 进阶气泡图绘制
利用‘tiledlayout’和‘bubblechart’命令,绘制初始进阶气泡图。
t = tiledlayout(1,1);nexttilebubblechart(xx, yy, f1, f2,'MarkerFaceAlpha',0.8);bubblesize([5 30])hTitle = title('BubblePlus Plot');hXLabel = xlabel('XAxis');hYLabel = ylabel('YAxis');
4. 细节优化
为了插图的美观,将初始进阶气泡图赋上之前选择的颜色,并对图形细节等进行美化:
% 赋色colormap(map)% 坐标轴美化set(gca, 'Box', 'off', ... % 边框'Layer','top',... % 图层'LineWidth',1,... % 线宽'XGrid', 'off', 'YGrid', 'off', ... % 网格'TickDir', 'out', 'TickLength', [.01 .01], ... % 刻度'XMinorTick', 'off', 'YMinorTick', 'off', ... % 小刻度'XColor', [.1 .1 .1], 'YColor', [.1 .1 .1],... % 坐标轴颜色'XTick', 0:2:24,... % 坐标区刻度、范围'XLim', [0 23],...'YTick', 0:0.2:1.2,...'YLim', [0 1.2])% 添加图例% 颜色条cb = colorbar;cb.Label.String = 'Feature2';cb.Layout.Tile = 'east';% 气泡尺寸blgd = bubblelegend('Feature1',...'Style','vertical',...'BubbleSizeOrder','descending',...'box','on',...'NumBubbles',3,... ...'FontName', 'Arial',...'FontSize', 9);bt = get(blgd,'Title');bt.FontWeight = 'normal';bt.FontName = 'Arial';bt.FontSize = 9;blgd.Layout.Tile = 'east';% 字体和字号set(gca, 'FontName', 'Arial', 'FontSize', 11)set([hXLabel,hYLabel], 'FontName', 'Arial', 'FontSize', 11)set(hTitle, 'FontSize', 12, 'FontWeight' , 'bold')% 背景颜色set(gcf,'Color',[1 1 1])% 添加上、右框线xc = get(gca,'XColor');yc = get(gca,'YColor');unit = get(gca,'units');ax = axes( 'Units', unit,...'Position',get(gca,'Position'),...'XAxisLocation','top',...'YAxisLocation','right',...'Color','none',...'XColor',xc,...'YColor',yc);set(ax, 'linewidth',1,...'XTick', [],...'YTick', []);
设置完毕后,以期刊所需分辨率、格式输出图片。
%% 图片输出figW = figureWidth;figH = figureHeight;set(figureHandle,'PaperUnits',figureUnits);set(figureHandle,'PaperPosition',[0 0 figW figH]);fileout = 'test';print(figureHandle,[fileout,'.png'],'-r300','-dpng');
以上。