< template>
< div ref = "chart" style = "height: 100%" > < /div>
< /template>
< script>
import * as echarts from "echarts" ;
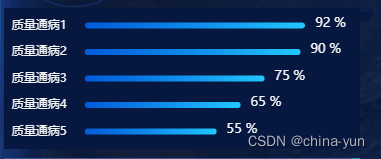
var cate = [ "质量通病1" , "质量通病2" , "质量通病3" , "质量通病4" , "质量通病5" ] ;
//数据值,顺序和Y轴的名字一一对应
var barData = [ 92 , 90 , 75 , 65 , 55 ] ;
export default {
name: "LineChart" ,
props: [ "dataList" , "xAxisLabel" , "yAxisLabel" , "legend" ] ,
watch: {
dataList ( ) {
this.initChart( ) ;
} ,
} ,
mounted ( ) {
this.initChart( ) ;
} ,
methods: {
initChart ( ) {
const chart = echarts.init( this.$refs .chart) ;
const option = {
backgroundColor: "#061740" ,
tooltip: {
trigger: "axis" ,
axisPointer: {
type: "shadow" ,
} ,
} ,
//图表位置
grid: {
left: "5%" ,
right: "10%" ,
bottom: "3%" ,
top: "3%" ,
containLabel: true,
} ,
//X轴
xAxis: {
type: "value" ,
axisLine: {
show: false,
} ,
axisTick: {
show: false,
} ,
//不显示X轴刻度线和数字
splitLine: { show: false } ,
axisLabel: { show: false } ,
} ,
yAxis: {
type: "category" ,
data: cate,
//升序
inverse: true,
splitLine: { show: false } ,
axisLine: {
show: false,
} ,
axisTick: {
show: false,
} ,
//key和图间距
offset: 10 ,
//动画部分
animationDuration: 300 ,
animationDurationUpdate: 300 ,
//key文字大小
nameTextStyle: {
fontSize: 5 ,
} ,
axisLabel: {
textStyle: {
color: "#F5F5F5" , //更改坐标轴文字颜色
fontSize: 12 , //更改坐标轴文字大小
} ,
} ,
} ,
series: [
{
//柱状图自动排序,排序自动让Y轴名字跟着数据动
realtimeSort: true,
name: "数量" ,
type: "bar" ,
data: barData,
barWidth: 6 ,
barGap: 10 ,
smooth: true,
valueAnimation: true,
//Y轴数字显示部分
label: {
normal: {
show: true,
position: "right" ,
valueAnimation: true,
offset: [ 5 , -2] ,
textStyle: {
color: "#F5F5F5" ,
fontSize: 13 ,
} ,
formatter: "{c} %" ,
} ,
} ,
itemStyle: {
emphasis: {
barBorderRadius: 7 ,
} ,
//颜色样式部分
normal: {
barBorderRadius: 8 ,
color: new echarts.graphic.LinearGradient( 0 , 0 , 1 , 0 , [
{ offset: 0 , color: "rgba(0, 108, 255, 0.5)" } ,
{ offset: 1 , color: "rgba(34, 200, 255, 1)" } ,
] ) ,
} ,
} ,
} ,
] ,
//动画部分
animationDuration: 0 ,
animationDurationUpdate: 3000 ,
animationEasing: "linear" ,
animationEasingUpdate: "linear" ,
} ;
chart.setOption( option) ;
window.addEventListener( "resize" , ( ) = > {
chart.resize( ) ;
} ) ;
} ,
} ,
} ;
< /script>