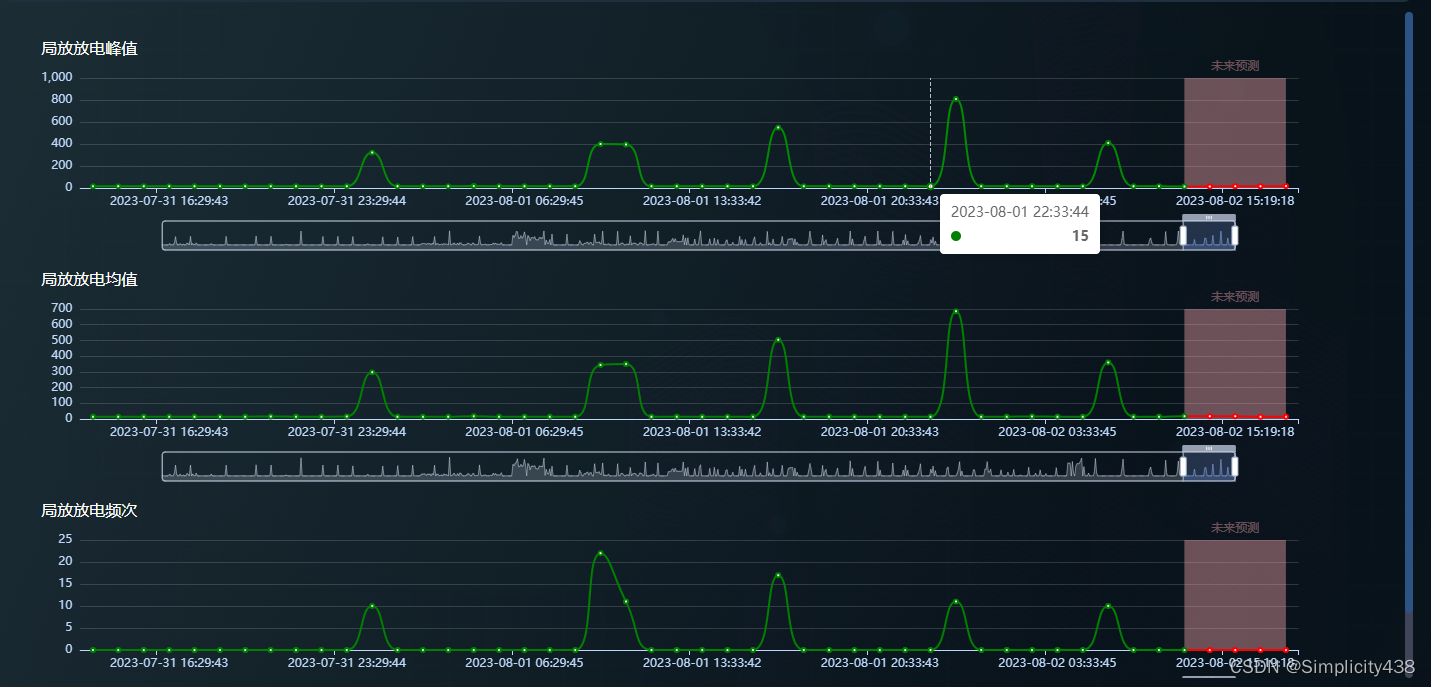
1.效果图
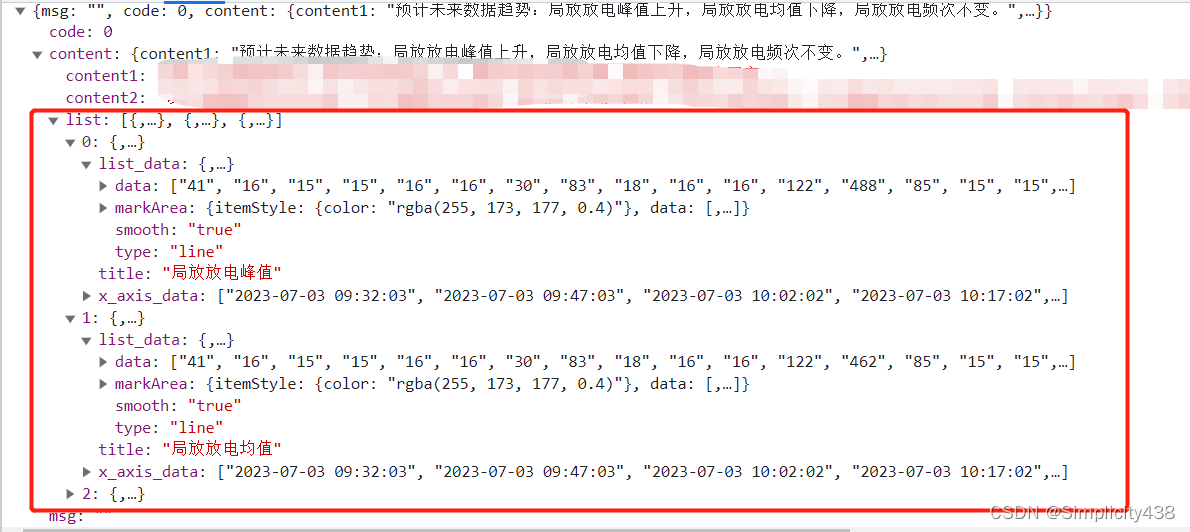
2.接口数据
3.开发如下
<div class="chart-list">
  <div v-for="(item,index) in chartData" :key="index" style="margin-top:5px;">
    <div>{{item.title}}</div>
    <div  :id="'myChart'+index" style="width: 100%;height: 200px;margin-bottom: 10px;"></div>
  </div>
</div>
获取接口数据
getPredictionData() {
  getPredictionData({
    id: this.detector,
    type:this.detectorType,
  }).then(res => {
    this.content1 = res.content1
    this.content2 = res.content2
    this.chartData = res.list;
    this.forecastChartShow(this.chartData)
  }).catch(err => {
    // Message.error(err)
  })
},
生成图表,this.$nextTick是关键
forecastChartShow(data) {
  data.map((item, index) => {
    this.$nextTick(() =>{
      let myChart= echarts.getInstanceByDom(document.getElementById('myChart'+index)); //有的话就获取已有echarts实例的DOM节点。
      if (myChart== null) { // 如果不存在,就进行初始化。
        myChart= echarts.init(document.getElementById('myChart'+index));
      }
      myChart.setOption({
      ........
      })
    })
  });
},