文章目录
- 安装Eharts
- 代码演示
- 最终效果
安装Eharts
官方快速上手地址
npm install echarts --save
代码演示
<script setup>
import {onMounted, ref} from "vue";
// import echarts from "echarts";
import * as echarts from 'echarts';
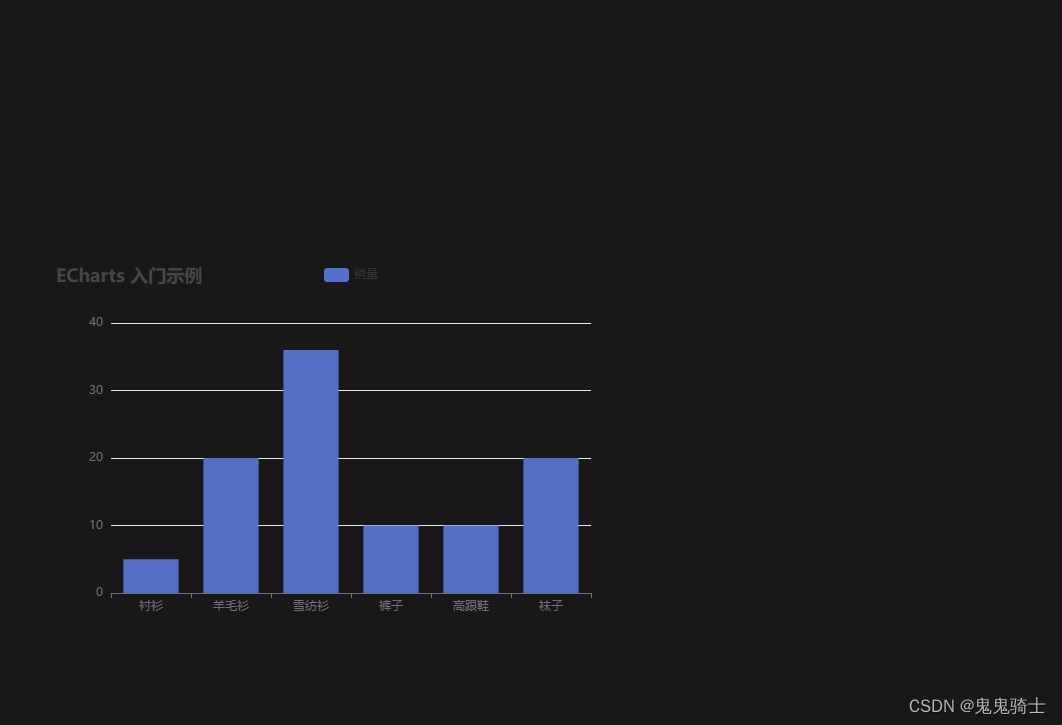
const option = ref({
title: {
text: 'ECharts 入门示例'
},
tooltip: {},
legend: {
data: ['销量']
},
xAxis: {
data: ['衬衫', '羊毛衫', '雪纺衫', '裤子', '高跟鞋', '袜子']
},
yAxis: {},
series: [
{
name: '销量',
type: 'bar',
data: [5, 20, 36, 10, 10, 20]
}
]
})
onMounted( ()=>{
// 基于准备好的dom,初始化echarts实例
const myChart = echarts.init(document.getElementById('main'));
// 使用刚指定的配置项和数据显示图表。
myChart.setOption(option.value);
})
</script>
<template>
<div id="main" style="width: 600px;height:400px;"></div>
</template>
最终效果