案例需求:
将Vue数据模型中的数据以表格的形式渲染展示

具体代码如下:
<!DOCTYPE html>
<html lang="en">
  <head>
    <meta charset="UTF-8" />
    <meta name="viewport" content="width=device-width, initial-scale=1.0" />
    <title>Vue指令案例</title>
    <script src="js/vue.js"></script>
  </head>
  <body>
    <div id="app">
      <table border="1" align="center" cellSpacing="0">
        <!-- 第一行内容 -->
        <tr>
          <!-- 第一行从左至右列的内容 -->
          <th>编号</th>
          <th>姓名</th>
          <th>年龄</th>
          <th>性别</th>
          <th>成绩</th>
          <th>等级</th>
        </tr>
        <!-- 后面的数据,进行循环遍历 -->
          <tr v-for="(user,index) in users">
            <td>{{index+1}}</td>
            <td>{{user.name}}</td>
            <td>{{user.age}}</td>
            <td>
                <!-- 使用无语义标签span -->
                <span v-show="user.gender==1">男</span>
                <span v-show="user.gender==2">女</span>
            </td>
            <td>{{user.score}}</td>
            <td v-if="user.score==100">灰常优秀</td>
            <td v-else>我是真的low</td>
        </tr>
        </div>
      </table>
    </div>
  </body>
  <script>
    new Vue({
      el: "#app",
      data: {
        users: [
          {
            name: "法老爷爷",
            age: 20,
            gender: 1,
            score: 100,
          },
          {
            name: "蔡徐坤",
            age: 100,
            gender: 2,
            score: 0.3,
          },
          {
            name: "小鬼泰裤辣",
            age:65,
            gender: 2,
            score: 0.0,
          },
          {
            name: "Capper可是雪啊~",
            age:36,
            gender: 2,
            score: 0.5,
          },
        ],
      },
    });
  </script>
</html>
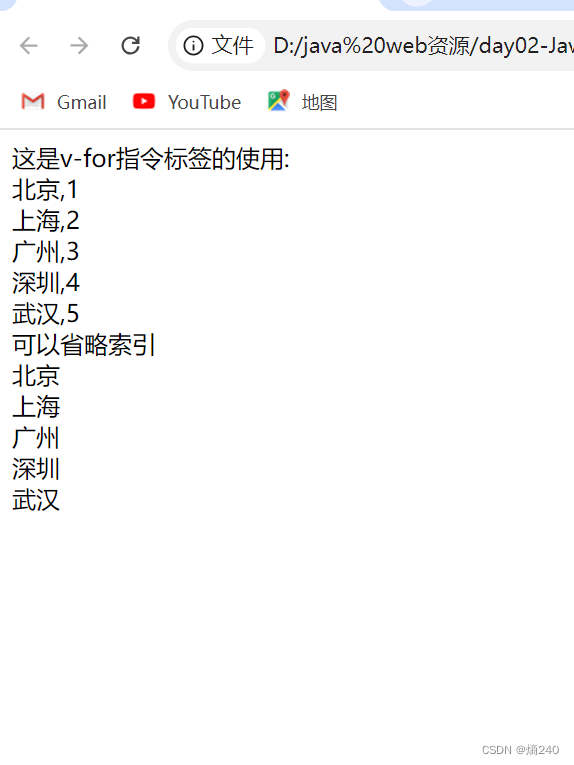
运行结果为:
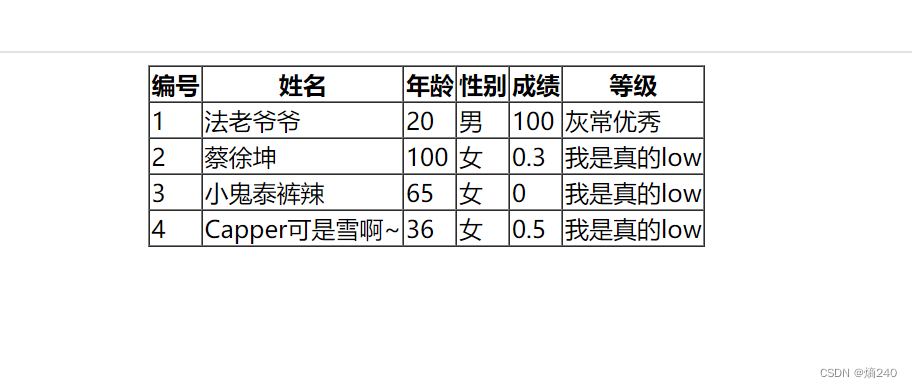
PS:法老YYDS