Matplotlib入门[04]——处理图像
参考:
- https://ailearning.apachecn.org/
- Matplotlib官网
图片来源:百度(如有侵权,立删)
使用Jupyter进行练习
![[外链图片转存失败,源站可能有防盗链机制,建议将图片保存下来直接上传(img-Hh5lvXwt-1670315527470)(https://matplotlib.org/stable/_static/images/logo2.svg)]](https://img-blog.csdnimg.cn/4a28df8f12a6437ea7c465ef9086ff7c.png)
import matplotlib.pyplot as plt
import matplotlib.image as mpimg
import numpy as np
Cricket.png

导入图像
首先导入上面的图像,注意 matplotlib 默认只支持 PNG 格式的图像,可以使用 mpimg.imread 方法读入这幅图像:
img = mpimg.imread('Cricket.png')
print("shape: ",img.shape)
print("dtype: ",img.dtype)
shape:  (463, 719, 3)
dtype:  float32
这是一个 463 x 719 x 3 的 RGB 图像,并且每个像素使用 uint8 分别表示 RGB 三个通道的值。不过在处理的时候,matplotlib 将它们的值归一化到 0.0~1.0 之间:
显示图像
使用 plt.imshow() 可以显示图像:
imgplot = plt.imshow(img)

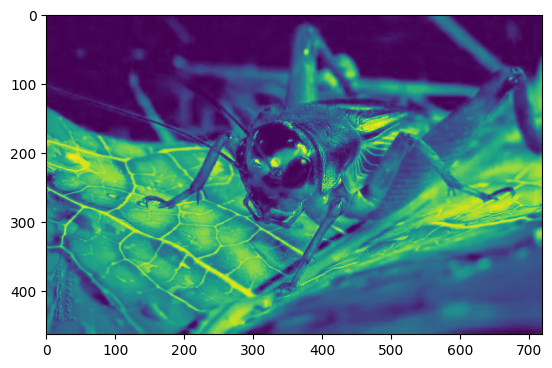
伪彩色图像
从单通道模拟彩色图像:
lum_img = img[:,:,0]
imgplot = plt.imshow(lum_img)
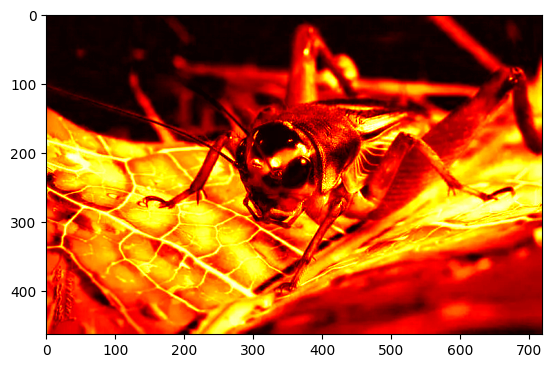
改变colormap
imgplot = plt.imshow(lum_img)
imgplot.set_cmap('hot')
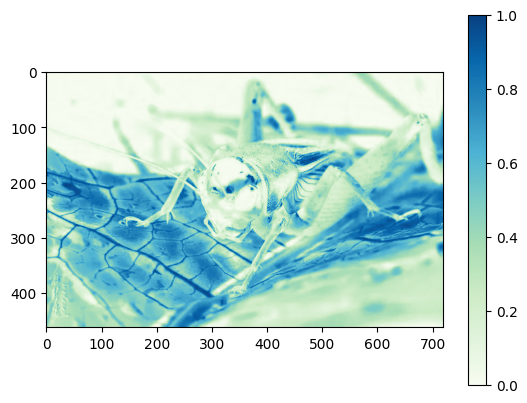
显示色度条
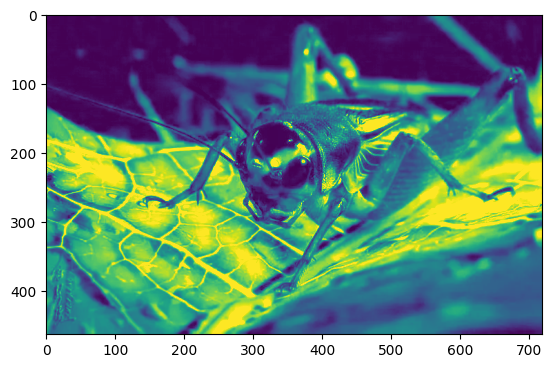
imgplot = plt.imshow(lum_img)
imgplot.set_cmap('GnBu')
plt.colorbar()
plt.show()
限制显示范围
查看直方图
plt.hist(lum_img.flatten(), 256, range=(0.0,1.0), fc='k', ec='k')
plt.show()

将显示范围设为 0.0-0.8:
imgplot = plt.imshow(lum_img)
imgplot.set_clim(0.0,0.8)