背景
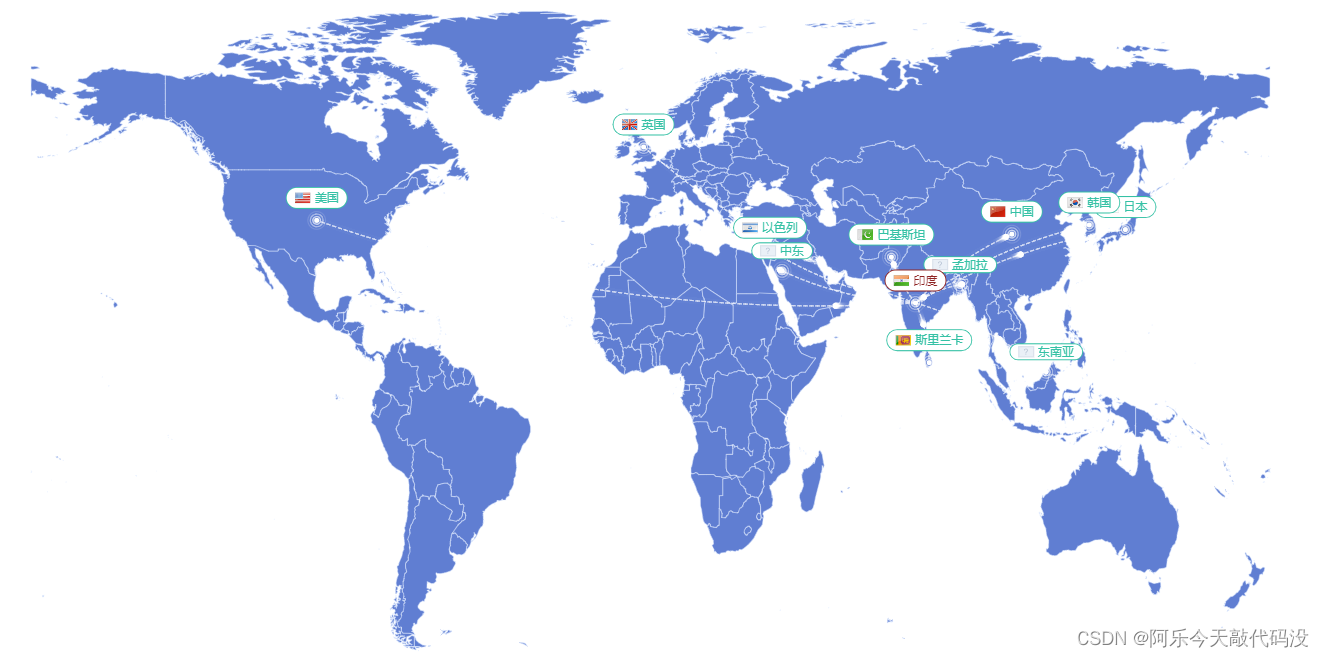
最近项目开发,需要开发一个世界地图,并且实现经纬度对应的点对点轨线动效,效果如下:
问题
- 如何在刚打开页面的时候就显示地点名称
- label如何同时添加图片和背景色
- label怎么动态修改字体颜色及图片以及动态边框色
- 添加动效及轨线
- 世界地图json数据
所有配置项代码放在4处,来不及看详解的看官请拉到4处适量食用
解决
1.如何在刚打开页面的时候就显示地点名称
一开始考虑到有样式使用html来写比较方便,我是想使用tooltip来做的,因为tooltip的formatter可以使用html标签来写,但是查询了官网和各大论坛也没找到能一下子显示所有tooltip的api,只找到了显示某个tooltip的api,
dispatchAction
  charts.dispatchAction({
                        type: 'showTip',
                        position: [-100, -150], // 自己可以设置显示位置 负数为正方向 正数为反方向
                        seriesIndex:0,  // 显示第几个series
                        dataIndex: 1 // 显示第几个数据
                    });
所以也就放弃了,选择使用label来写,虽然路程艰辛但是好在实现了功能
2.label如何同时添加图片和背景色
首先我们知道label的formatter是无法编译html标签的,我们只能按照
{ 类名 | 变量 }
的形式进行样式修改,同时我们需要注意的是,这种写法是无法在两个类名的外部包裹父类的,例如
{ 父类名 | { 类名A | 变量一 }{ 类名B | 变量 二} }
这种写法是不被允许的。所以我们可以将父类的样式写入label的normal中,其他子类样式按照formatter+rich的方法写,同时rich允许使用
backgroundColor: {
image:‘https://www.xiaohongshu.com/explore/6136147700000000010240c0’,
},
的方式来添加图片:
label: {
            normal: {
              show: true,
              position: 'top', //显示位置
              padding: [2,8,2,8],
              borderRadius: 10,
              backgroundColor: '#fff',  //整个label背景色
              borderWidth: 1,
              align: 'center',
              offset: [0, -5],
              formatter: (data) => '{a|}{b|' +type+ '}',
              rich: {
                a: {
                  backgroundColor: {
                   image:'https://www.xiaohongshu.com/explore/6136147700000000010240c0',
                  },
                  height: 11,
                },

                b: {
                  color: '#35c1a5',
                  fontSize: 12,
                  padding: [0, 0, -2, 4],
                  align: 'center',
                },
              },
            },
          },
3.怎么动态修改字体颜色及图片以及动态边框色
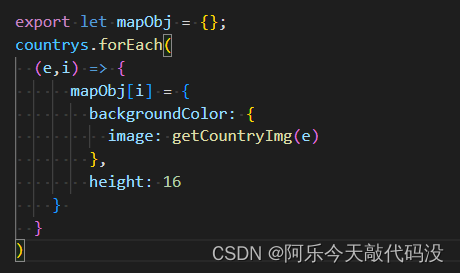
首先修改字体颜色只需要在formatter中根据需求进行判断给予不同的类名即可,动态图片,根据官方文档可知rich-》下的所有样式都是不支持接收参数的,所以我们只能在类名上做文章,因为我这里图片是存储在前端本地的,所以需要一一罗列出来,同时图表数据中每一条都给予了唯一key值用来与样式类名进行对应
  label: {
            normal: {
              show: true,
              position: 'top', //显示位置
              padding: [2, 8, 2, 8],
              borderRadius: 10,
              backgroundColor: '#fff',
              borderWidth: 1,
              align: 'center',
              offset: [0, -5],
              formatter: (data) => {
              //动态字体颜色
                let type = ['a', 'b', 'c'][data.data.type];
                // data.data.key唯一类名,用于确定图片
                return '{' + data.data.key + '|}{' + type + '|' + data.name + '}';
              },
              rich: {
                ...mapObj,
                  height: 11,
                },
                a: {
                  color: '#8e2323',
                  fontSize: 12,
                  padding: [0, 0, -2, 4],
                  align: 'center',
                },
                b: {
                  color: '#35c1a5',
                  fontSize: 12,
                  padding: [0, 0, -2, 4],
                  align: 'center',
                },
                c: {
                  color: '#e26647',
                  fontSize: 12,
                  padding: [0, 0, -2, 4],
                  align: 'center',
                },
              },
            },
          },
最后,你可能注意到我这段lebel代码中并未给予边框色,是因为根据据官方文档可知,我们可以在图表数据中给予label属性进行配置项覆盖,例如
[{name:‘美国’,value:[111.222.2],label:{borderColor:‘red’}}]
4.添加动效及轨线
这里我将放所有的option代码,各位看官自行阅读理解
//图表配置
export const chartOption = (data) => {
  return {
    geo: {
      map: 'world',
      zoom: 1.2,
      show: true,
      roam: false,
      tooltip: { show: false },
      label: {
        emphasis: { show: true },
      },
      itemStyle: {
        normal: {
          show: 'true',
          color: 'rgb(96,126,210)', //地图背景色
          borderColor: '#E1ECFF',
          //省市边界线
        },
        emphasis: {
          show: 'true',
          color: '#BDC8D7', //悬浮背景}
        },
      },
      series: [
        {
          type: 'lines', //绘制连线zlevel: 2,
          animation: false,
          large: true,
          effect: {
            show: true,
            constantSpeed: 20,
            symbol: 'pin',
            symbolSize: 10,
            trailLength: 0.1,
            color: '#fff',
          },
          lineStyle: {
            color: '#fff',
            width: 1,
            opacity: 0.2,
            curveness: 0.1,
            type: 'dashed',
          },
          data: lienData.value,
        },
        {
          type: 'effectScatter', //绘制点
          coordinateSystem: 'geo',
          zlevel: 2,
          rippleEffect: {
            period: 4, //动画时间,值越小速度越快
            brushType: 'stroke', //波纹绘制方式stroke, fili
            scale: 4, //波纹圆环最大限制,值越大波纹越大
          },
          symbolSize: function () {
            return 5;
          },

          itemStyle: { color: '#fff' },
          label: {
            normal: {
              show: true,
              position: 'top', //显示位置
              padding: [2, 8, 2, 8],
              borderRadius: 10,
              backgroundColor: '#fff',
              borderWidth: 1,
              align: 'center',
              offset: [0, -5],
              formatter: (data) => {
                let type = ['a', 'b', 'c'][data.data.type];
                return '{' + data.data.key + '|}{' + type + '|' + data.name + '}';
              },
              rich: {
                ...mapObj,
                any: {
                  backgroundColor: {
                    image: new URL('./assets/imge/country/anyrun.svg', import.meta.url).href,
                  },
                  height: 11,
                },
                a: {
                  color: '#8e2323',
                  fontSize: 12,
                  padding: [0, 0, -2, 4],
                  align: 'center',
                },
                b: {
                  color: '#35c1a5',
                  fontSize: 12,
                  padding: [0, 0, -2, 4],
                  align: 'center',
                },
                c: {
                  color: '#e26647',
                  fontSize: 12,
                  padding: [0, 0, -2, 4],
                  align: 'center',
                },
              },
            },
          },
          data: data,
        },
        {
          type: 'effectScatter', //绘制中心辐射点
          coordinateSystem: 'geo',
          zlevel: 2,
          rippleEffect: {
            period: 5, //动画时间,值越小速度越快
            brushType: 'stroke', //波纹绘制方式 stroke, fillscale: 5
          },
          data: lienData.value,
        },
      ],
    },
  };
};
需要注意的是我这里按照需求格式化的图表数据结构大概为
[{ name:‘地点名’,value:[经度,纬度],key:‘确定动态图片的唯一key’,label:{ label边框样式 } }]
代码中lienData数据格式为,这是官方规定的数据格式
[{ fromName:‘起点名’,toName:‘终点名’,coords:[[起点经度,起点纬度][终点经度,终点纬度]] }]
5.世界地图json数据
世界地图json下载
![YumRepo Error: All mirror URLs are not using ftp, http[s] or file解决办法](https://img-blog.csdnimg.cn/f52718ef424445db87f2d099bcbefcee.png)


![PMP项目管理-[第五章]范围管理](https://img-blog.csdnimg.cn/4cfaa76a85e849cc8a1342f36915c990.png)