前提环境:
- Docker环境
涉及参考文档:
- Prometheus 录制规则
- Prometheus 警报规则
语法检查规则
promtool check rules /path/to/example.rules.yml
一:录制规则语法
groups 语法:
groups:
  [ - <rule_group> ]
rule_group 语法
# The name of the group. Must be unique within a file.
name: <string>

# How often rules in the group are evaluated.
[ interval: <duration> | default = global.evaluation_interval ]

# Limit the number of alerts an alerting rule and series a recording
# rule can produce. 0 is no limit.
[ limit: <int> | default = 0 ]

rules:
  [ - <rule> ... ]
rules 语法
# The name of the time series to output to. Must be a valid metric name.
record: <string>

# The PromQL expression to evaluate. Every evaluation cycle this is
# evaluated at the current time, and the result recorded as a new set of
# time series with the metric name as given by 'record'.
expr: <string>

# Labels to add or overwrite before storing the result.
labels:
  [ <labelname>: <labelvalue> ]
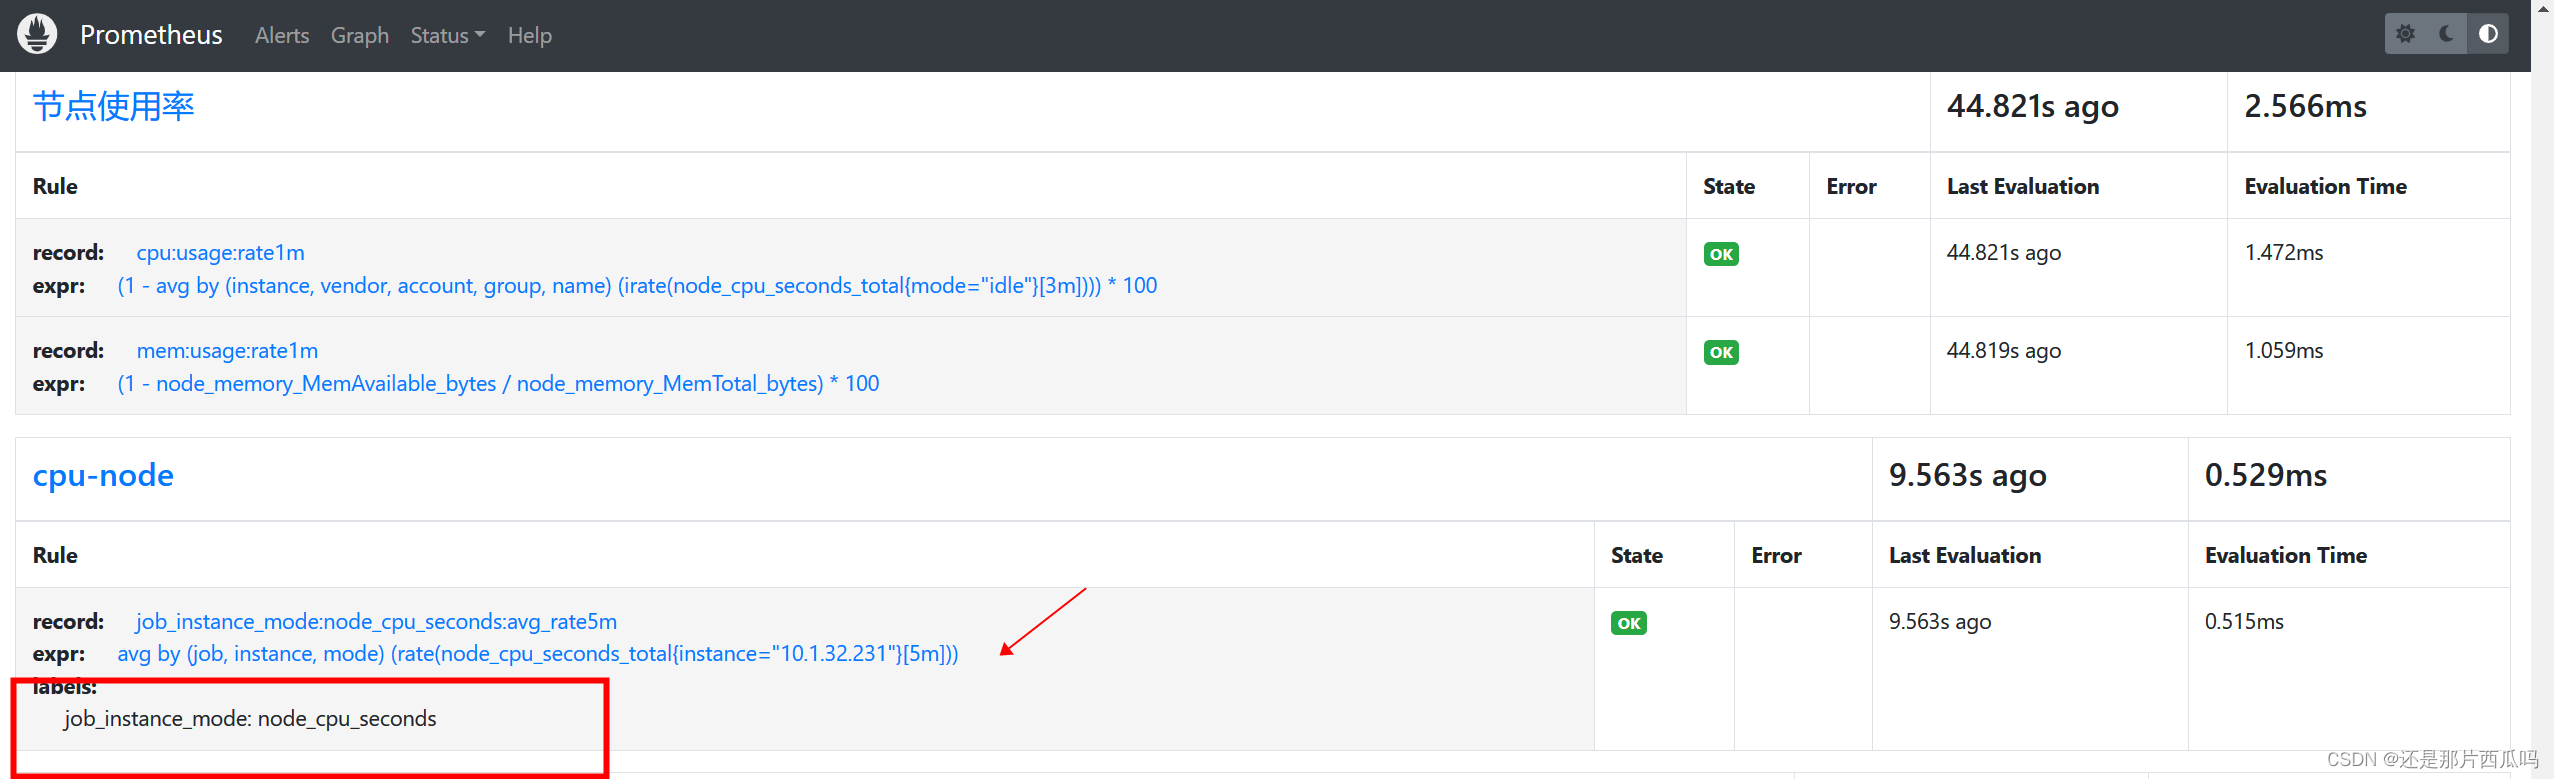
示例规则文件:
groups:
- name: cpu-node
  rules:
  - record: job_instance_mode:node_cpu_seconds:avg_rate5m
    expr: avg by (job, instance, mode) (rate(node_cpu_seconds_total{instance="10.1.32.231"}[5m]))
    labels:
      job_instance_mode: node_cpu_seconds
二:警报规则语法
警报规则允许您根据 Prometheus 自定义警报条件 表达式语言表达式和发送有关触发警报的通知 到外部服务。
语法格式:
# The name of the alert. Must be a valid label value.
alert: <string>   # 告警名称

# The PromQL expression to evaluate. Every evaluation cycle this is
# evaluated at the current time, and all resultant time series become
# pending/firing alerts.
expr: <string>    # 自定义语法

# Alerts are considered firing once they have been returned for this long.
# Alerts which have not yet fired for long enough are considered pending.
[ for: <duration> | default = 0s ]    # 持续设定时间才触发,在此之间一直处于等待告警状态(pending)

# Labels to add or overwrite for each alert.
labels:
  [ <labelname>: <tmpl_string> ]	  # 告警名称标签

# Annotations to add to each alert.
annotations:						  #
  [ <labelname>: <tmpl_string> ]
定义警报规则:
标签和注释值可以使用控制台进行模板化模板。该变量保存警报实例的标签键/值对。已配置的 可以通过变量访问外部标签。该变量保存警报实例的评估值
groups:
- name: Dos端口探针
rules:
- alert: Dos端口探针 #告警名称
expr: probe_success{job="Dos-Port-Status"}==0 #匹配规则
for: 1m # 一直持续时间,才触发告警规则
labels: # 标签部分
severity: critical
team: "{{ $labels.job }}" # $labels.job ——> Prometheus 主配置文件定义的Job名称
annotations: # 注解部分
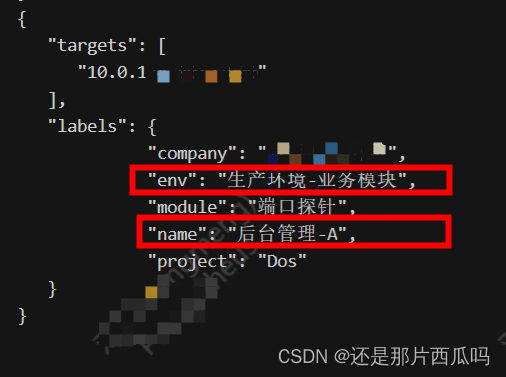
summary: '{{$labels.env}} TCP探测失败' # 采集主机的标签名称
description: '{{ $labels.env}}【{{ $labels.name}}】TCP探测端口失败,当前状态码:{{$value}}' # 采集主机的标签名称
触发效果


![[数据结构]---八大经典排序算法详解](https://img-blog.csdnimg.cn/0e8142407d4d4211b8615f4750ab6a65.png#pic_center)