An Euler diagram (/ˈɔɪlər/, OY-lər) is a diagrammatic means of representing sets and their relationships. They are particularly useful for explaining complex hierarchies and overlapping definitions. They are similar to another set diagramming technique, Venn diagrams. Unlike Venn diagrams, which show all possible relations between different sets, the Euler diagram shows only relevant relationships.
The first use of “Eulerian circles” is commonly attributed to Swiss mathematician Leonhard Euler (1707–1783). In the United States, both Venn and Euler diagrams were incorporated as part of instruction in set theory as part of the new math movement of the 1960s. Since then, they have also been adopted by other curriculum fields such as reading[1] as well as organizations and businesses.
Euler diagrams consist of simple closed shapes in a two-dimensional plane that each depict a set or category. How or whether these shapes overlap demonstrates the relationships between the sets. Each curve divides the plane into two regions or “zones”: the interior, which symbolically represents the elements of the set, and the exterior, which represents all elements that are not members of the set. Curves that do not overlap represent disjoint sets, which have no elements in common. Two curves that overlap represent sets that intersect, that have common elements; the zone inside both curves represents the set of elements common to both sets (the intersection of the sets). A curve completely within the interior of another is a subset of it.
Venn diagrams are a more restrictive form of Euler diagrams. A Venn diagram must contain all 2n logically possible zones of overlap between its n curves, representing all combinations of inclusion/exclusion of its constituent sets. Regions not part of the set are indicated by coloring them black, in contrast to Euler diagrams, where membership in the set is indicated by overlap as well as color.
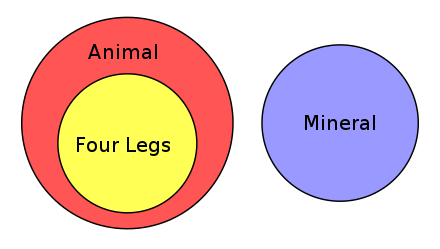
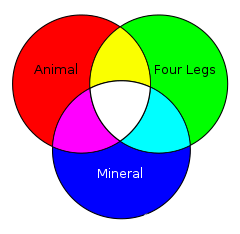
An Euler diagram illustrating that the set of “animals with four legs” is a subset of “animals”, but the set of “minerals” is disjoint (has no members in common) with “animals”
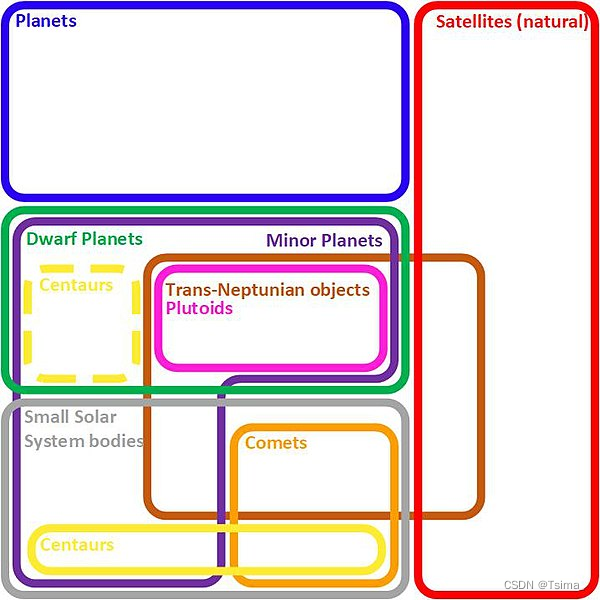
An Euler diagram showing the relationships between different Solar System objects
Contents
- 1 History
- 2 Relation between Euler and Venn diagrams
- 2.1 Example: Euler- to Venn-diagram and Karnaugh map
- 3 Gallery
- 4 See also
1 History
As shown in the illustration to the right, Sir William Hamilton in his posthumously published Lectures on Metaphysics and Logic (1858–60) erroneously asserts that the original use of circles to “sensualize … the abstractions of Logic” (p. 180) was not Leonhard Paul Euler (1707–1783) but rather Christian Weise (1642–1708) in his Nucleus Logicae Weisianae that appeared in 1712 posthumously, however, the latter book was actually written by Johann Christian Lange rather than Weise.[2][3] He references Euler’s Letters to a German Princess [Partie II, Lettre XXXV, February 17, 1791, ed. Cournot (1842), pp. 412–417. – ED.][nb 1]
In Hamilton’s illustration the four categorical propositions that can occur in a syllogism as symbolized by the drawings A, E, I and O are:[4]
A: The Universal Affirmative, Example: “All metals are elements”.
E: The Universal Negative, Example: “No metals are compound substances”.
I: The Particular Affirmative, Example: “Some metals are brittle”.
O: The Particular Negative, Example: “Some metals are not brittle”.
In his 1881 Symbolic Logic Chapter V “Diagrammatic Representation”, John Venn (1834–1923) comments on the remarkable prevalence of the Euler diagram:
“…of the first sixty logical treatises, published during the last century or so, which were consulted for this purpose:-somewhat at random, as they happened to be most accessible :-it appeared that thirty four appealed to the aid of diagrams, nearly all of these making use of the Eulerian Scheme.” (Footnote 1 page 100)
But nevertheless, he contended, “the inapplicability of this scheme for the purposes of a really general Logic” (page 100) and on page 101 observed that, “It fits in but badly even with the four propositions of the common Logic to which it is normally applied.” Venn ends his chapter with the observation illustrated in the examples below—that their use is based on practice and intuition, not on a strict algorithmic practice:
“In fact … those diagrams not only do not fit in with the ordinary scheme of propositions which they are employed to illustrate, but do not seem to have any recognized scheme of propositions to which they could be consistently affiliated.” (pp. 124–125)
Finally, in his Chapter XX HISTORIC NOTES Venn gets to a crucial criticism (italicized in the quote below); observe in Hamilton’s illustration that the O (Particular Negative) and I (Particular Affirmative) are simply rotated:
“We now come to Euler’s well-known circles which were first described in his Lettres a une Princesse d’Allemagne (Letters 102–105). The weak point about these consists in the fact that they only illustrate in strictness the actual relations of classes to one another, rather than the imperfect knowledge of these relations which we may possess, or wish to convey, by means of the proposition. Accordingly they will not fit in with the propositions of common logic, but demand the constitution of a new group of appropriate elementary propositions… This defect must have been noticed from the first in the case of the particular affirmative and negative, for the same diagram is commonly employed to stand for them both, which it does indifferently well”. (italics added: page 424)
(Sandifer 2003 reports that Euler makes such observations too; Euler reports that his figure 45 (a simple intersection of two circles) has 4 different interpretations). Whatever the case, armed with these observations and criticisms, Venn then demonstrates (pp. 100–125) how he derived what has become known as his Venn diagrams from the “…old-fashioned Euler diagrams.” In particular he gives an example, shown on the left.
By 1914, Louis Couturat (1868–1914) had labeled the terms as shown on the drawing on the right. Moreover, he had labeled the exterior region (shown as a’b’c’) as well. He succinctly explains how to use the diagram – one must strike out the regions that are to vanish:
“VENN’S method is translated in geometrical diagrams which represent all the constituents, so that, in order to obtain the result, we need only strike out (by shading) those which are made to vanish by the data of the problem.” (italics added p. 73)
Given the Venn’s assignments, then, the unshaded areas inside the circles can be summed to yield the following equation for Venn’s example:
“No Y is Z and ALL X is Y: therefore No X is Z” has the equation x’yz’ + xyz’ + x’y’z for the unshaded area inside the circles (but this is not entirely correct; see the next paragraph).
In Venn the 0th term, x’y’z’, i.e. the background surrounding the circles, does not appear. Nowhere is it discussed or labeled, but Couturat corrects this in his drawing. The correct equation must include this unshaded area shown in boldface:
“No Y is Z and ALL X is Y: therefore No X is Z” has the equation x’yz’ + xyz’ + x’y’z + x’y’z’ .
In modern usage the Venn diagram includes a “box” that surrounds all the circles; this is called the universe of discourse or the domain of discourse.
Couturat now observes that, in a direct algorithmic (formal, systematic) manner, one cannot derive reduced Boolean equations, nor does it show how to arrive at the conclusion “No X is Z”. Couturat concluded that the process “has … serious inconveniences as a method for solving logical problems”:
“It does not show how the data are exhibited by canceling certain constituents, nor does it show how to combine the remaining constituents so as to obtain the consequences sought. In short, it serves only to exhibit one single step in the argument, namely the equation of the problem; it dispenses neither with the previous steps, i. e., “throwing of the problem into an equation” and the transformation of the premises, nor with the subsequent steps, i. e., the combinations that lead to the various consequences. Hence it is of very little use, inasmuch as the constituents can be represented by algebraic symbols quite as well as by plane regions, and are much easier to deal with in this form.”(p. 75)
Thus the matter would rest until 1952 when Maurice Karnaugh (1924– ) would adapt and expand a method proposed by Edward W. Veitch; this work would rely on the truth table method precisely defined in Emil Post’s 1921 PhD thesis “Introduction to a general theory of elementary propositions” and the application of propositional logic to switching logic by (among others) Claude Shannon, George Stibitz, and Alan Turing.[nb 2] For example, in chapter “Boolean Algebra”, Hill and Peterson (1968, 1964) present sections 4.5ff “Set Theory as an Example of Boolean Algebra”, and in it they present the Venn diagram with shading and all. They give examples of Venn diagrams to solve example switching-circuit problems, but end up with this statement:
“For more than three variables, the basic illustrative form of the Venn diagram is inadequate. Extensions are possible, however, the most convenient of which is the Karnaugh map, to be discussed in Chapter 6.” (p. 64)
In Chapter 6, section 6.4 “Karnaugh Map Representation of Boolean Functions” they begin with:
“The Karnaugh map1 [1Karnaugh 1953] is one of the most powerful tools in the repertory of the logic designer. … A Karnaugh map may be regarded either as a pictorial form of a truth table or as an extension of the Venn diagram.” (pp. 103–104)
The history of Karnaugh’s development of his “chart” or “map” method is obscure. Karnaugh in his 1953 referenced Veitch 1951, Veitch referenced Claude E. Shannon 1938 (essentially Shannon’s Master’s thesis at M.I.T.), and Shannon in turn referenced, among other authors of logic texts, Couturat 1914. In Veitch’s method the variables are arranged in a rectangle or square; as described in Karnaugh map, Karnaugh in his method changed the order of the variables to correspond to what has become known as (the vertices of) a hypercube.
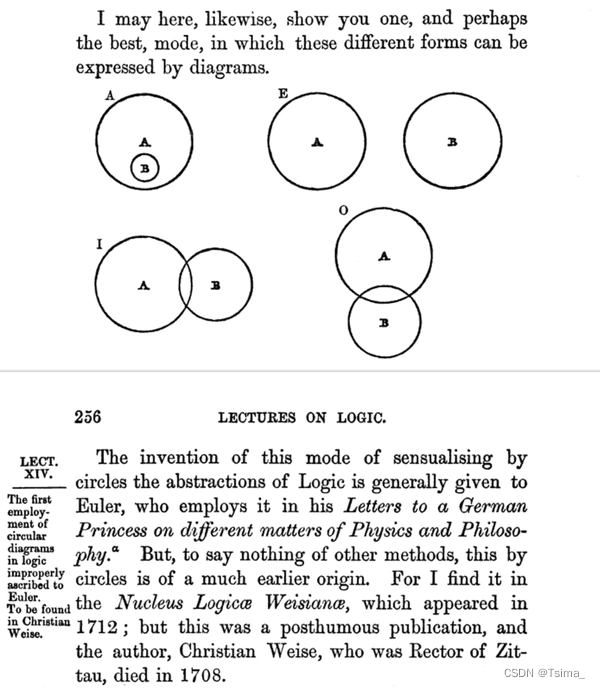
A page from Hamilton’s Lectures on Logic. The symbolism A, E, I, and O refers to the categorical statements that can occur in a syllogism. The small text to the left erroneously states: “The first employment of circular diagrams in logic improperly ascribed to Euler. To be found in Christian Weise”, a book actually written by Johann Christian Lange.[2][3]
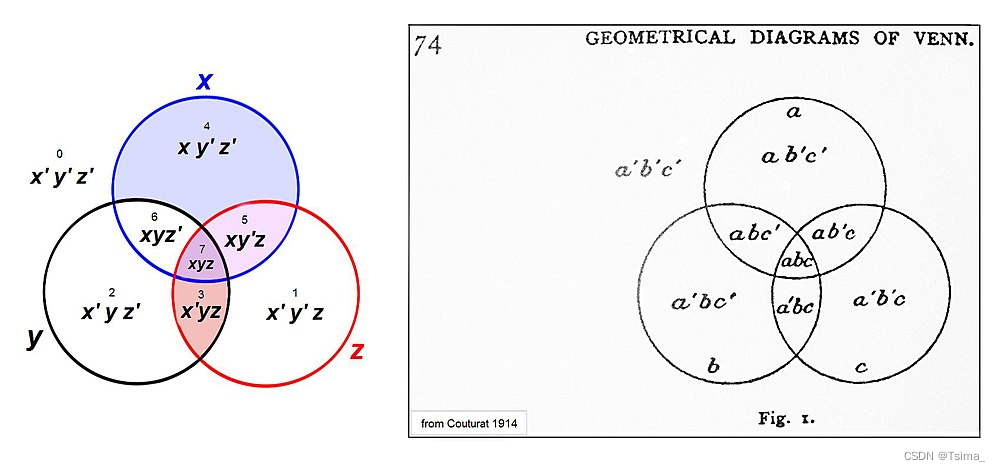
On the right is page 74 from Couturat 1914 wherein he labels the 8 regions of the Venn diagram. The modern name for these “regions” is minterms. These are shown on the left with the variables x, y and z per Venn’s drawing. The symbolism is as follows: logical AND ( & ) is represented by arithmetic multiplication, and the logical NOT ( ~ ) is represented by " ’ " after the variable, e.g. the region x’y’z is read as “NOT x AND NOT y AND z” i.e. ~x & ~y & z.
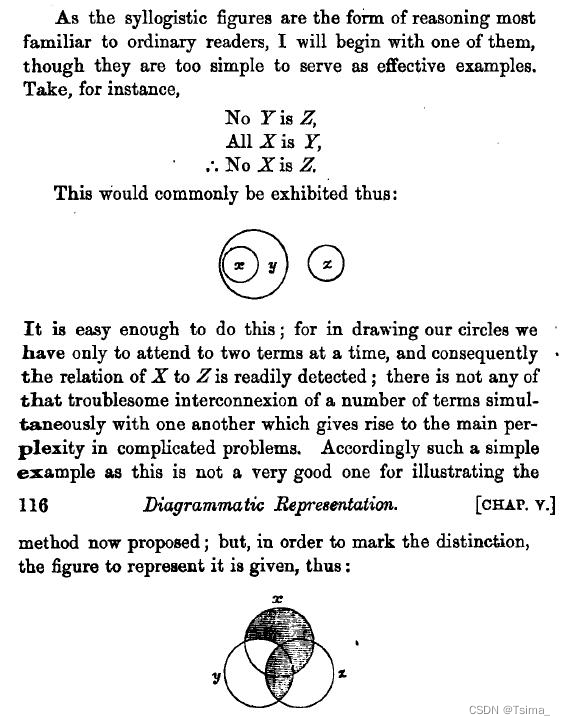
Composite of two pages 115–116 from Venn 1881 showing his example of how to convert a syllogism of three parts into his type of diagram. Venn calls the circles “Eulerian circles” (cf Sandifer 2003, Venn 1881:114 etc) in the “Eulerian scheme” (Venn 1881:100) of “old-fashioned Eulerian diagrams” (Venn 1881:113).
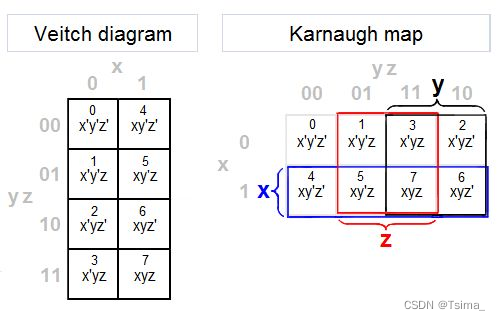
Both the Veitch diagram and Karnaugh map show all the minterms, but the Veitch is not particularly useful for reduction of formulas. Observe the strong resemblance between the Venn and Karnaugh diagrams; the colors and the variables x, y, and z are per Venn’s example.
2 Relation between Euler and Venn diagrams
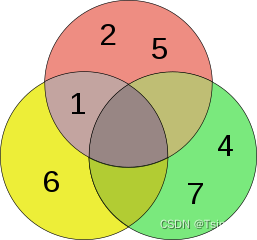
Venn diagrams are a more restrictive form of Euler diagrams. A Venn diagram must contain all 2n logically possible zones of overlap between its n curves, representing all combinations of inclusion/exclusion of its constituent sets. Regions not part of the set are indicated by coloring them black, in contrast to Euler diagrams, where membership in the set is indicated by overlap as well as color. When the number of sets grows beyond 3 a Venn diagram becomes visually complex, especially compared to the corresponding Euler diagram. The difference between Euler and Venn diagrams can be seen in the following example. Take the three sets:
{\displaystyle A={1,,2,,5}}A={1,,2,,5}
{\displaystyle B={1,,6}}B={1,,6}
{\displaystyle C={4,,7}}C={4,,7}
The Euler and the Venn diagrams of those sets are:
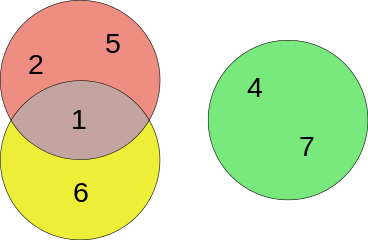
Euler diagram
Venn diagram
In a logical setting, one can use model-theoretic semantics to interpret Euler diagrams, within a universe of discourse. In the examples below, the Euler diagram depicts that the sets Animal and Mineral are disjoint since the corresponding curves are disjoint, and also that the set Four Legs is a subset of the set of Animals. The Venn diagram, which uses the same categories of Animal, Mineral, and Four Legs, does not encapsulate these relationships. Traditionally the emptiness of a set in Venn diagrams is depicted by shading in the region. Euler diagrams represent emptiness either by shading or by the absence of a region.
Often a set of well-formedness conditions are imposed; these are topological or geometric constraints imposed on the structure of the diagram. For example, connectedness of zones might be enforced, or concurrency of curves or multiple points might be banned, as might tangential intersection of curves. In the adjacent diagram, examples of small Venn diagrams are transformed into Euler diagrams by sequences of transformations; some of the intermediate diagrams have concurrency of curves. However, this sort of transformation of a Venn diagram with shading into an Euler diagram without shading is not always possible. There are examples of Euler diagrams with 9 sets that are not drawable using simple closed curves without the creation of unwanted zones since they would have to have non-planar dual graphs.
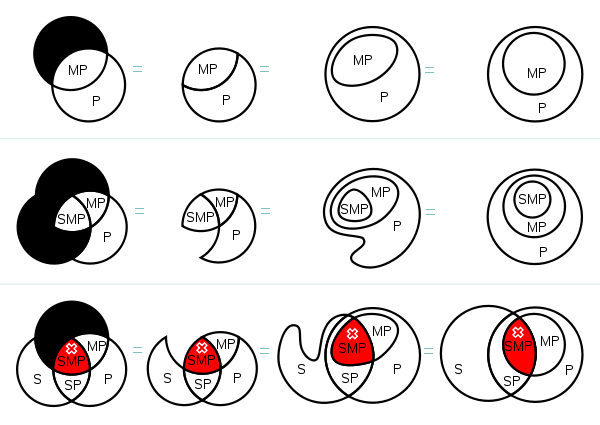
Examples of small Venn diagrams (on left) with shaded regions representing empty sets, showing how they can be easily transformed into equivalent Euler diagrams (right)
2.1 Example: Euler- to Venn-diagram and Karnaugh map
This example shows the Euler and Venn diagrams and Karnaugh map deriving and verifying the deduction “No Xs are Zs”. In the illustration and table the following logical symbols are used:
-
1 can be read as “true”, 0 as “false”
- for NOT and abbreviated to ’ when illustrating the minterms e.g. x’ =defined NOT x,
- for Boolean OR (from Boolean algebra: 0 + 0 = 0, 0 + 1 = 1 + 0 = 1, 1 + 1 = 1)
& (logical AND) between propositions; in the minterms AND is omitted in a manner similar to arithmetic multiplication: e.g. x’y’z =defined ~x & ~y & z (From Boolean algebra: 0·0 = 0, 0·1 = 1·0 = 0, 1·1 = 1, where “·” is shown for clarity)
→ (logical IMPLICATION): read as IF … THEN …, or " IMPLIES ", P → Q = defined NOT P OR Q
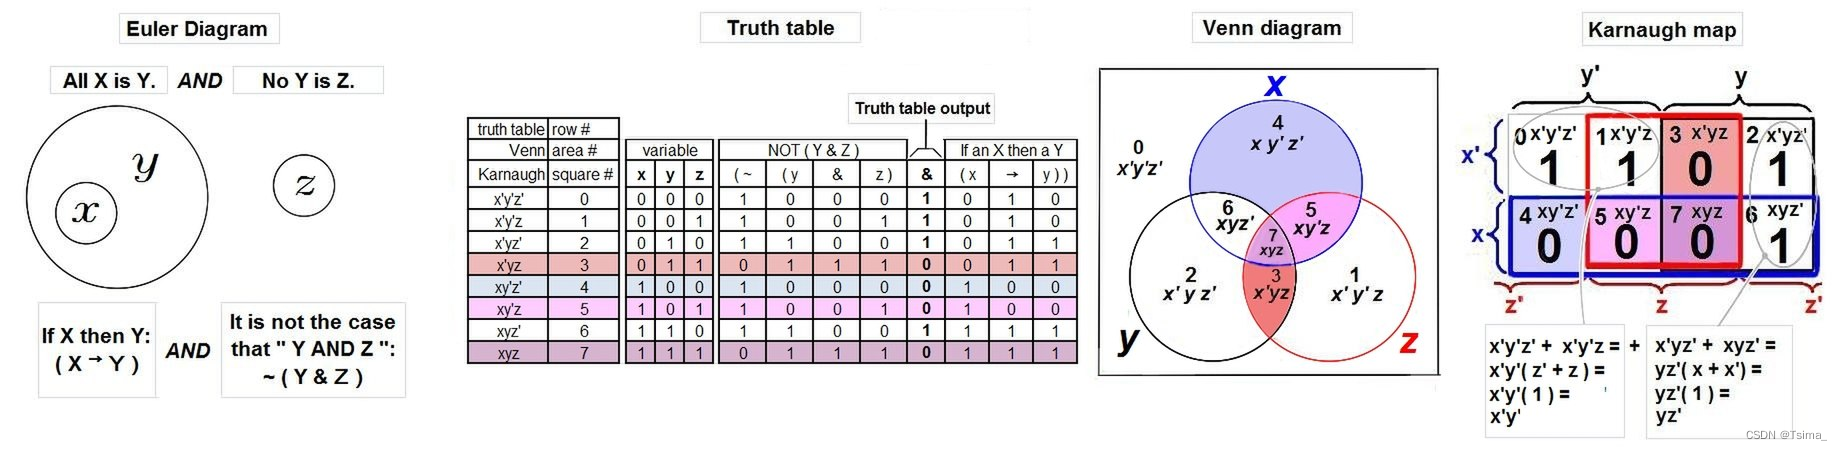
Before it can be presented in a Venn diagram or Karnaugh Map, the Euler diagram’s syllogism “No Y is Z, All X is Y” must first be reworded into the more formal language of the propositional calculus: " ‘It is not the case that: Y AND Z’ AND ‘If an X then a Y’ ". Once the propositions are reduced to symbols and a propositional formula ( ~(y & z) & (x → y) ), one can construct the formula’s truth table; from this table the Venn and/or the Karnaugh map are readily produced. By use of the adjacency of "1"s in the Karnaugh map (indicated by the grey ovals around terms 0 and 1 and around terms 2 and 6) one can “reduce” the example’s Boolean equation i.e. (x’y’z’ + x’y’z) + (x’yz’ + xyz’) to just two terms: x’y’ + yz’. But the means for deducing the notion that “No X is Z”, and just how the reduction relates to this deduction, is not forthcoming from this example.
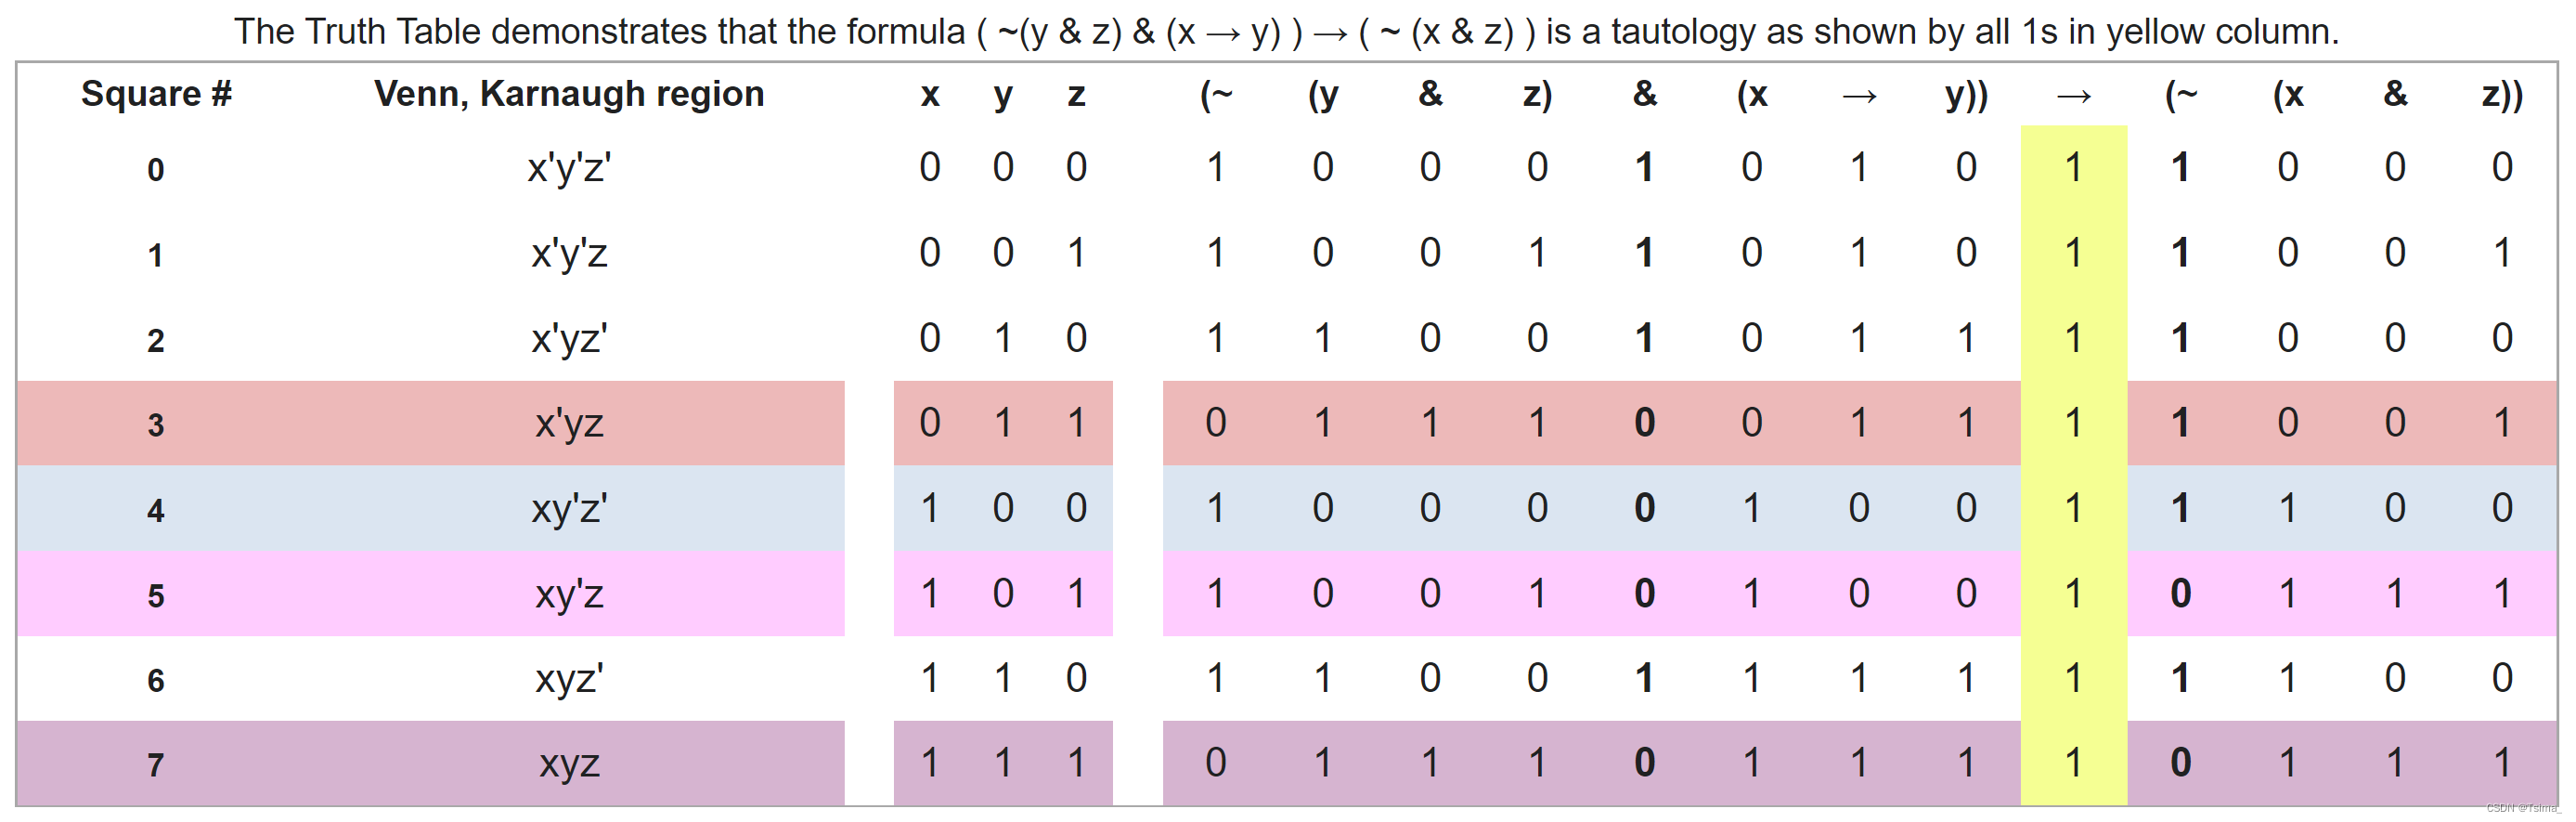
Given a proposed conclusion such as “No X is a Z”, one can test whether or not it is a correct deduction by use of a truth table. The easiest method is put the starting formula on the left (abbreviate it as P) and put the (possible) deduction on the right (abbreviate it as Q) and connect the two with logical implication i.e. P → Q, read as IF P THEN Q. If the evaluation of the truth table produces all 1s under the implication-sign (→, the so-called major connective) then P → Q is a tautology. Given this fact, one can “detach” the formula on the right (abbreviated as Q) in the manner described below the truth table.
Given the example above, the formula for the Euler and Venn diagrams is:
“No Ys are Zs” and “All Xs are Ys”: ( ~(y & z) & (x → y) ) =defined P
And the proposed deduction is:
“No Xs are Zs”: ( ~ (x & z) ) =defined Q
So now the formula to be evaluated can be abbreviated to:
( ~(y & z) & (x → y) ) → ( ~ (x & z) ): P → Q
IF ( “No Ys are Zs” and “All Xs are Ys” ) THEN ( “No Xs are Zs” )
At this point the above implication P → Q (i.e. ~(y & z) & (x → y) ) → ~(x & z) ) is still a formula, and the deduction – the “detachment” of Q out of P → Q – has not occurred. But given the demonstration that P → Q is tautology, the stage is now set for the use of the procedure of modus ponens to “detach” Q: “No Xs are Zs” and dispense with the terms on the left.[nb 3]
Modus ponens (or “the fundamental rule of inference”[5]) is often written as follows: The two terms on the left, P → Q and P, are called premises (by convention linked by a comma), the symbol ⊢ means “yields” (in the sense of logical deduction), and the term on the right is called the conclusion:
P → Q, P ⊢ Q
For the modus ponens to succeed, both premises P → Q and P must be true. Because, as demonstrated above the premise P → Q is a tautology, “truth” is always the case no matter how x, y and z are valued, but “truth” is only the case for P in those circumstances when P evaluates as “true” (e.g. rows 0 OR 1 OR 2 OR 6: x’y’z’ + x’y’z + x’yz’ + xyz’ = x’y’ + yz’).[nb 4]
P → Q , P ⊢ Q
i.e.: ( ~(y & z) & (x → y) ) → ( ~ (x & z) ) , ( ~(y & z) & (x → y) ) ⊢ ( ~ (x & z) )
i.e.: IF “No Ys are Zs” and “All Xs are Ys” THEN “No Xs are Zs”, “No Ys are Zs” and “All Xs are Ys” ⊢ “No Xs are Zs”
One is now free to “detach” the conclusion “No Xs are Zs”, perhaps to use it in a subsequent deduction (or as a topic of conversation).
The use of tautological implication means that other possible deductions exist besides “No Xs are Zs”; the criterion for a successful deduction is that the 1s under the sub-major connective on the right include all the 1s under the sub-major connective on the left (the major connective being the implication that results in the tautology). For example, in the truth table, on the right side of the implication (→, the major connective symbol) the bold-face column under the sub-major connective symbol " ~ " has the all the same 1s that appear in the bold-faced column under the left-side sub-major connective & (rows 0, 1, 2 and 6), plus two more (rows 3 and 4).
3 Gallery
A Venn diagram shows all possible intersections.
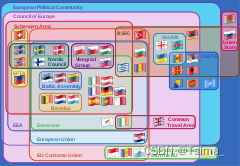
Euler diagram visualizing a real situation, the relationships between various supranational European organizations. (clickable version)
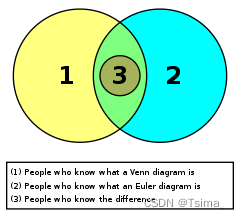
Humorous diagram comparing Euler and Venn diagrams.
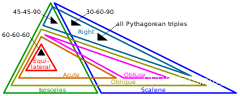
Euler diagram of types of triangles, using the definition that isosceles triangles have at least (rather than exactly) 2 equal sides.
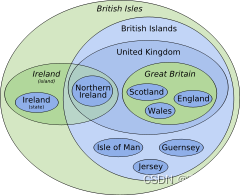
Euler diagram of terminology of the British Isles.
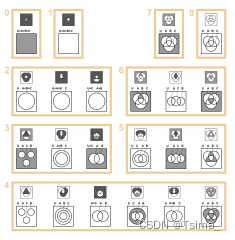
The 22 (of 256) essentially different Venn diagrams with 3 circles (top) and their corresponding Euler diagrams (bottom)
Some of the Euler diagrams are not typical, and some are even equivalent to Venn diagrams. Areas are shaded to indicate that they contain no elements.
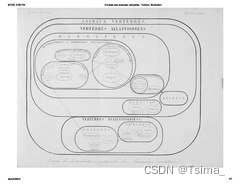
Henri Milne -Edwards’s (1844) diagram of relationships of vertebrate animals, illustrated as a series of nested sets.
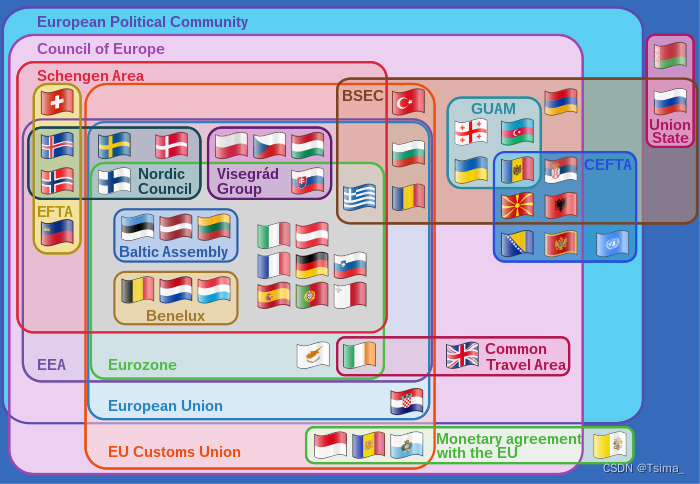
A clickable Euler diagram[file] showing the relationships between various multinational European organisations and agreements.
4 See also
Rainbow box
Spider diagram – an extension of Euler diagrams adding existence to contour intersections.
Venn diagram


![[附源码]java毕业设计游戏账号交易平台](https://img-blog.csdnimg.cn/1c06cd7d0cde43748fca7ef1f5273b5b.png)