pdf-lib https://blog.csdn.net/Shi_haoliu/article/details/148157624?spm=1001.2014.3001.5501
为了完成在pdf中导出echarts图,如果边框加在dom上面,pdf-lib导出svg的时候并不会导出边框,所以只能在echarts图上面加边框
grid的边框是在图里面
graphic相当于是加了一个图层
注:必须固定echarts图的大小
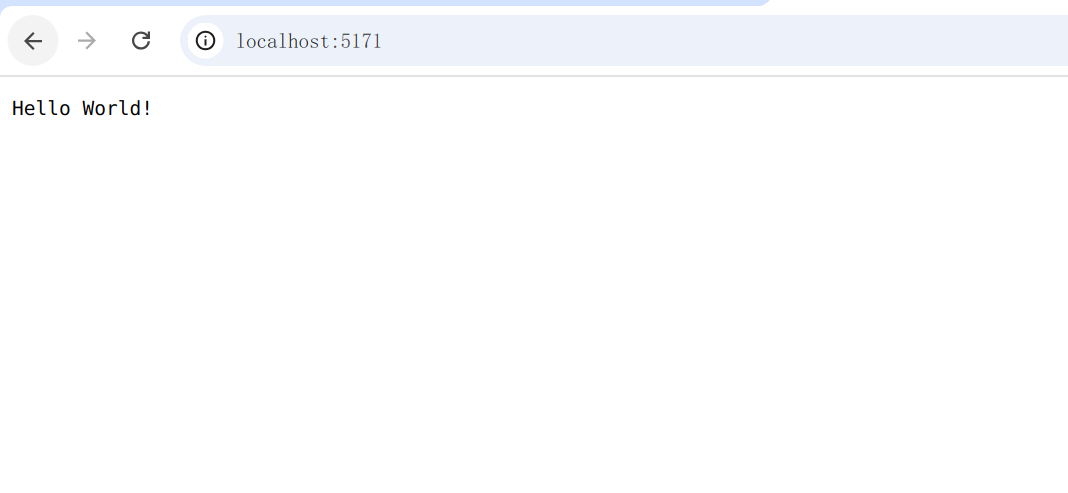
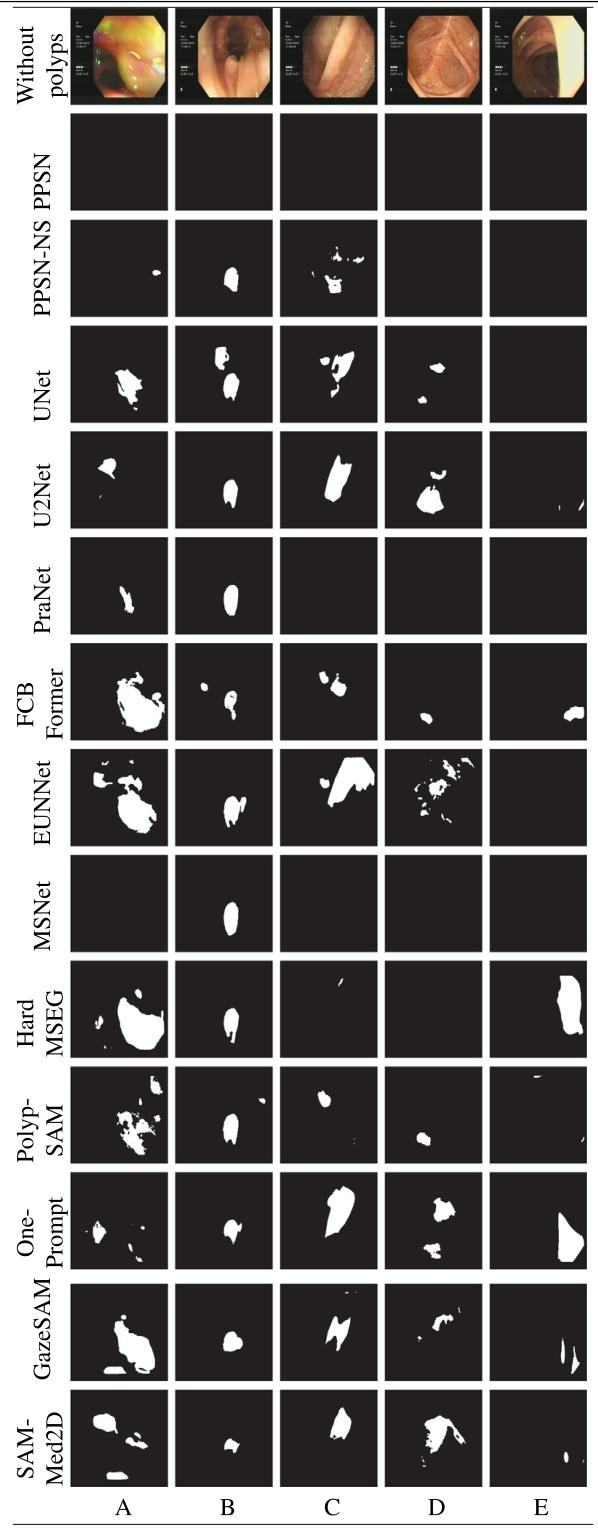
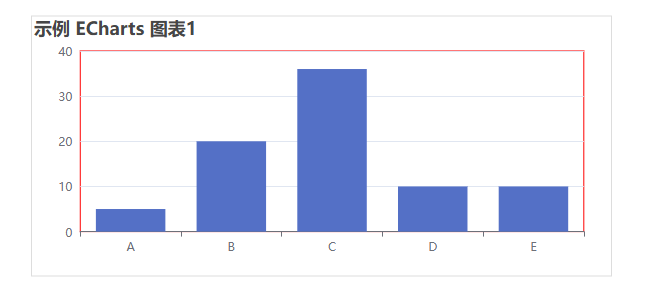
页面显示
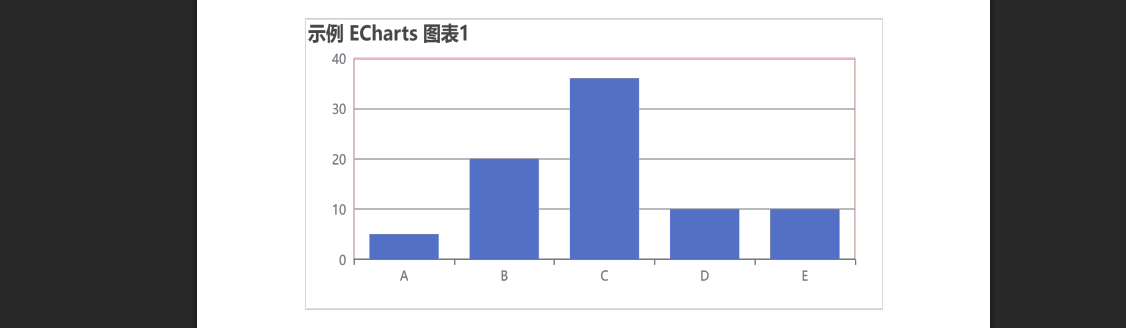
pdf导出显示
代码
const chart = this.$echarts.init(this.$refs.chartRef, "", {
        renderer: "svg", // 强制使用 SVG
        devicePixelRatio: 2, // 通常设为 2(Retina 屏)或更高,这样在页面上图片不会变糊了
      });
      chart.setOption({
        title: { text: "示例 ECharts 图表1" },
        tooltip: {},
        grid: {
          left: "5%",
          right: "5%",
          top: "14%",
          bottom: "10%",
          borderColor: "red", // 边框颜色
          borderWidth: 0.5, // 边框宽度
          show: true,
          containLabel: true,
        },
        graphic: [
          {
            type: "group",
            left: "0%",
            top: "center",
            children: [
              {
                type: "rect",
                z: 1,
                left: "center",
                top: "middle",
                shape: {
                //图的宽高和位置
                  width: 580,
                  height: 260,
                },
                style: {
                  // fill: "#ddd",
                  stroke: "#ddd",
                  lineWidth: 1,
                  //阴影设置
                  // shadowBlur: 8,
                  // shadowOffsetX: 3,
                  // shadowOffsetY: 3,
                  // shadowColor: "rgba(0,0,0,0.2)",
                  fill: "none", //不填充内容图层
                },
              },
            ],
          },
        ],
        xAxis: { data: ["A", "B", "C", "D", "E"] },
        yAxis: {},
        series: [
          {
            name: "数量",
            type: "bar",
            data: [5, 20, 36, 10, 10],
          },
        ],
      });