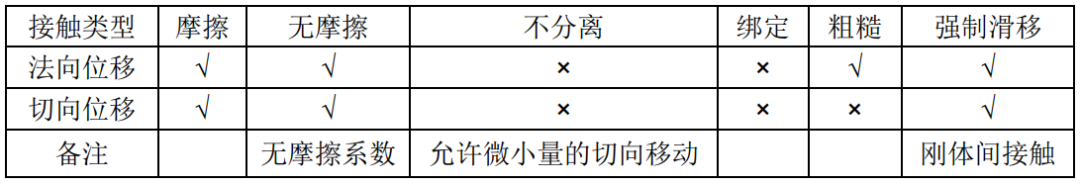
用jfreechart生成心电图
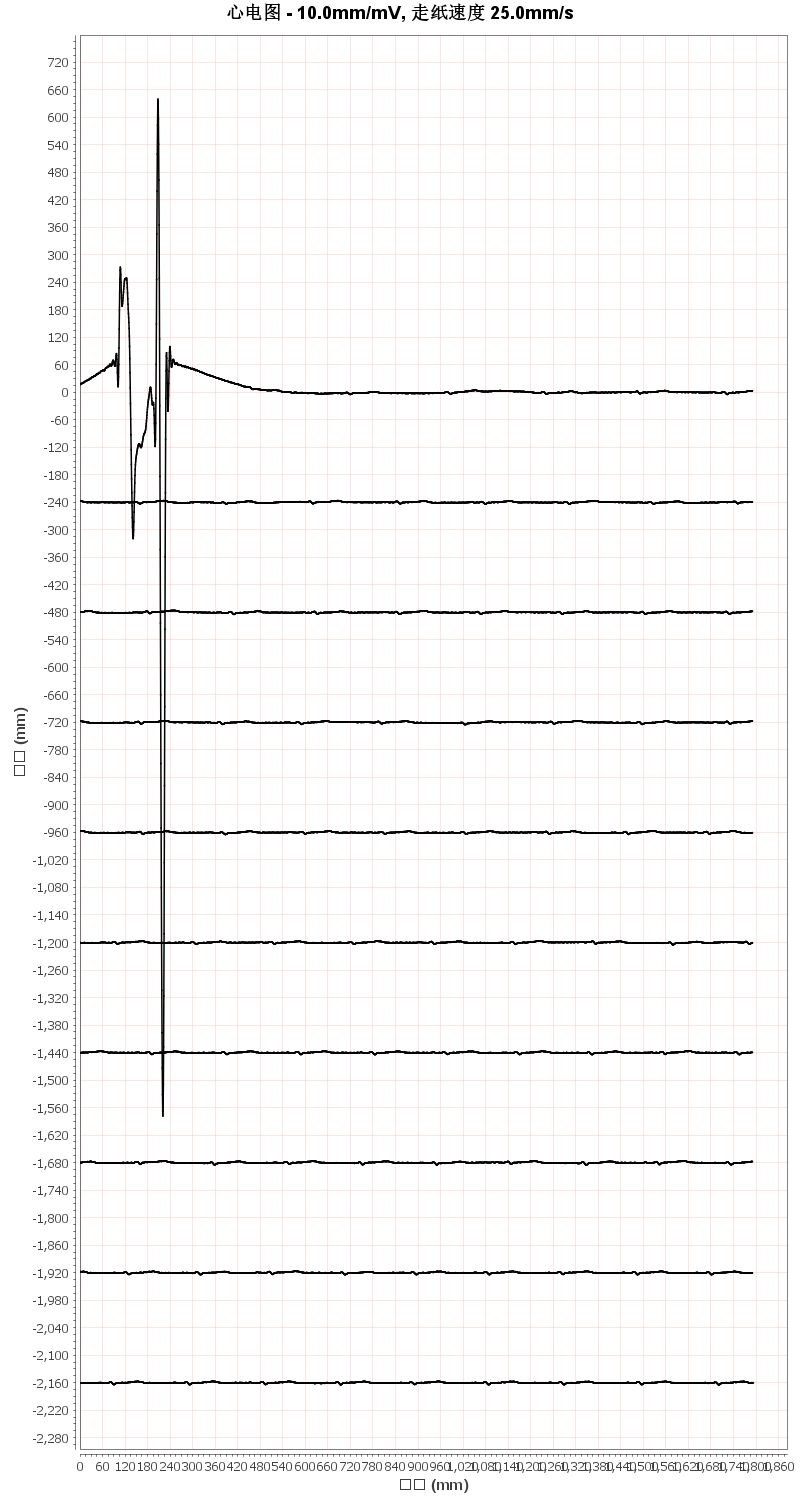
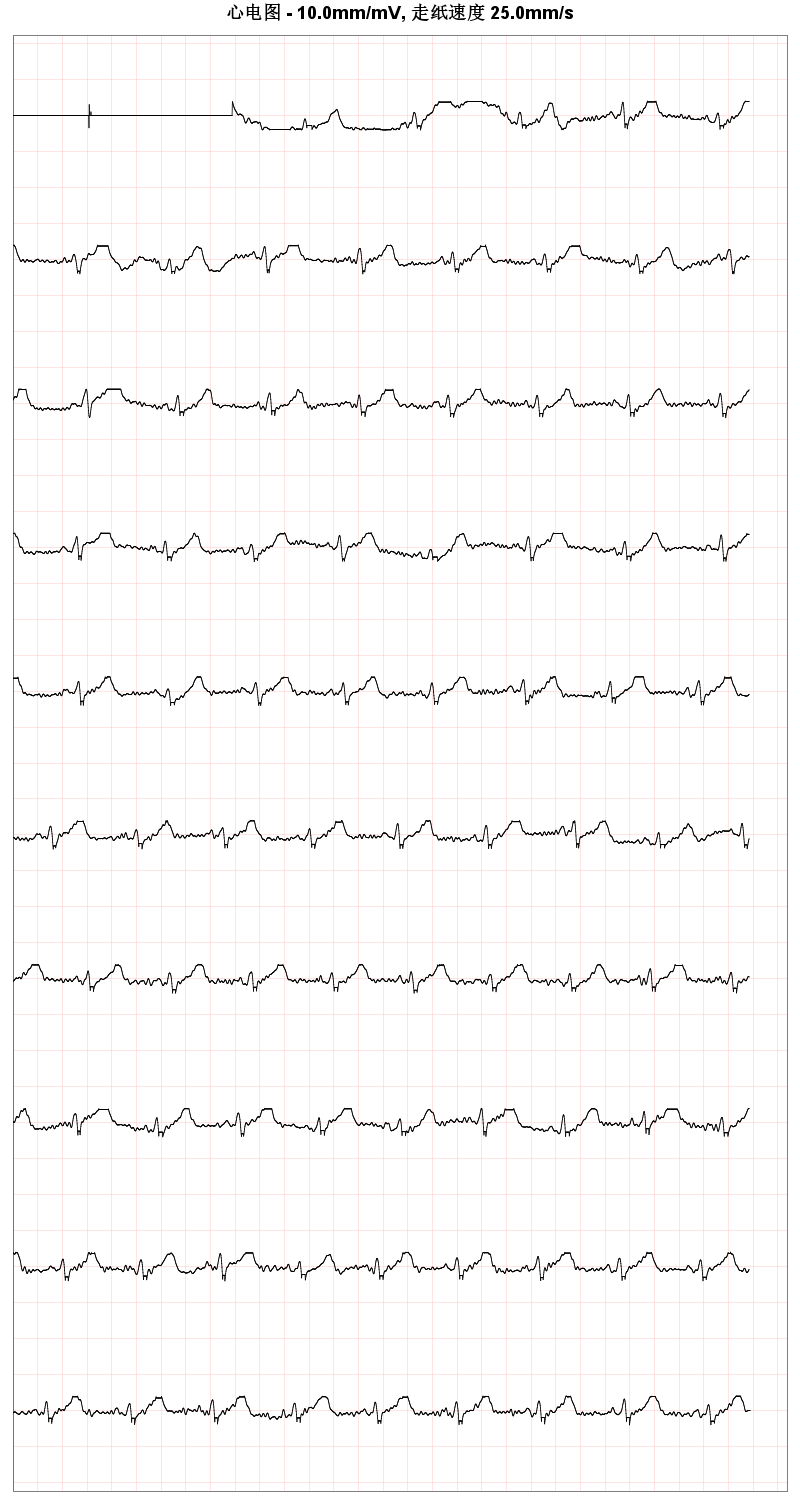
先上成功的图片
上代码
1.导入包
  implementation 'org.jfree:jfreechart:1.5.4'
  implementation 'org.jfree:jcommon:1.0.24'
2.实现代码
对数据进行滤波
转换单位
package com.shinrun.infrastructure.util;

import java.util.ArrayList;
import java.util.Arrays;
import java.util.Collections;
import java.util.List;

public class ECGDataConverter {

    /**
     * 将原始数据转换为mV单位的数据
     * @param rawData 原始数据数组
     * @param scaleFactor 比例因子(20000对应1mV)
     * @return 转换后的数据数组(单位mV)
     */
    public static double[] convertToMillivolts(double[] rawData, double scaleFactor) {
        double[] convertedData = new double[rawData.length];
        for (int i = 0; i < rawData.length; i++) {
            convertedData[i] = rawData[i] / scaleFactor;
        }
        return convertedData;
    }

    /**
     * 将原始数据转换为微伏(uV)单位的数据
     * @param rawData 原始数据数组
     * @param scaleFactor 比例因子(20000对应1mV)
     * @return 转换后的数据数组(单位uV)
     */
    public static double[] convertToMicrovolts(double[] rawData, double scaleFactor) {
        double[] convertedData = new double[rawData.length];
        for (int i = 0; i < rawData.length; i++) {
            convertedData[i] = (rawData[i] / scaleFactor) * 1000; // 转换为uV
        }
        return convertedData;
    }


    /**
     * 移动平均滤波器 - 平滑高频噪声
     * @param data 原始ECG数据(uV)
     * @param windowSize 窗口大小(建议3-7)
     * @return 滤波后的数据
     */
    public static double[] movingAverageFilter(double[] data, int windowSize) {
        if (windowSize < 1 || windowSize > data.length) {
            throw new IllegalArgumentException("Invalid window size");
        }

        double[] filtered = new double[data.length];
        int halfWindow = windowSize / 2;

        for (int i = 0; i < data.length; i++) {
            int start = Math.max(0, i - halfWindow);
            int end = Math.min(data.length - 1, i + halfWindow);

            double sum = 0;
            int count = 0;

            for (int j = start; j <= end; j++) {
                sum += data[j];
                count++;
            }

            filtered[i] = sum / count;
        }

        return filtered;
    }


    /**
     * 中值滤波器 - 有效去除脉冲噪声
     * @param data 原始ECG数据(uV)
     * @param windowSize 窗口大小(建议3-5)
     * @return 滤波后的数据
     */
    public static double[] medianFilter(double[] data, int windowSize) {
        if (windowSize < 1 || windowSize > data.length || windowSize % 2 == 0) {
            throw new IllegalArgumentException("Window size must be odd and positive");
        }

        double[] filtered = new double[data.length];
        int halfWindow = windowSize / 2;
        double[] window = new double[windowSize];

        for (int i = 0; i < data.length; i++) {
            int start = Math.max(0, i - halfWindow);
            int end = Math.min(data.length - 1, i + halfWindow);

            // 填充窗口
            int index = 0;
            for (int j = start; j <= end; j++) {
                window[index++] = data[j];
            }

            // 对窗口数据进行排序
            Arrays.sort(window, 0, index);

            // 取中值
            filtered[i] = window[index / 2];
        }

        return filtered;
    }


    /**
     * 基于阈值的异常值过滤
     * @param data 原始ECG数据(uV)
     * @param thresholdMultiplier 阈值乘数(建议2.5-3.5)
     * @return 过滤后的数据
     */
    public static double[] thresholdFilter(double[] data, double thresholdMultiplier) {
        // 计算数据的均值和标准差
        double mean = 0;
        for (double v : data) {
            mean += v;
        }
        mean /= data.length;

        double stdDev = 0;
        for (double v : data) {
            stdDev += Math.pow(v - mean, 2);
        }
        stdDev = Math.sqrt(stdDev / data.length);

        double threshold = thresholdMultiplier * stdDev;
        double[] filtered = new double[data.length];

        for (int i = 0; i < data.length; i++) {
            if (Math.abs(data[i] - mean) > threshold) {
                // 如果是异常值,用前后值的平均值替代
                double prev = i > 0 ? filtered[i-1] : mean;
                double next = i < data.length-1 ? data[i+1] : mean;
                filtered[i] = (prev + next) / 2;
            } else {
                filtered[i] = data[i];
            }
        }

        return filtered;
    }


    /**
     * 组合滤波器 - 先中值滤波再移动平均
     * @param data 原始ECG数据(uV)
     * @param medianWindow 中值滤波窗口大小(建议3)
     * @param averageWindow 移动平均窗口大小(建议5)
     * @return 滤波后的数据
     */
    public static double[] combinedFilter(double[] data, int medianWindow, int averageWindow) {
        double[] medianFiltered = medianFilter(data, medianWindow);
        return movingAverageFilter(medianFiltered, averageWindow);
    }


    /**
     * 原始数据强过滤(处理ADC值)
     * @param rawData 原始ADC数据
     * @param maxAllowed 允许的最大ADC绝对值
     * @return 过滤后的原始ADC数据
     */
    public static double[] filterRawData(double[] rawData, double maxAllowed) {
        if (rawData == null) {
          return new double[0];
        }

        double[] filtered = Arrays.copyOf(rawData, rawData.length);
        int windowSize = 7; // 使用前后各3个点(共7点窗口)

        for (int i = 0; i < filtered.length; i++) {
            if (Math.abs(filtered[i]) > maxAllowed) {
                // 获取周围正常值的滑动窗口中值
                filtered[i] = getSlidingWindowReplacement(filtered, i, windowSize, maxAllowed);
            }
        }
        return filtered;
    }

    private static double getSlidingWindowReplacement(double[] data, int centerIdx,
        int windowSize, double maxAllowed) {
        int halfWindow = windowSize / 2;
        List<Double> validValues = new ArrayList<>();

        // 收集窗口内有效值
        for (int i = -halfWindow; i <= halfWindow; i++) {
            int actualIdx = centerIdx + i;
            if (actualIdx >= 0 && actualIdx < data.length &&
                Math.abs(data[actualIdx]) <= maxAllowed) {
                validValues.add(data[actualIdx]);
            }
        }

        // 处理策略(按优先级):
        if (!validValues.isEmpty()) {
            // 1. 有有效值则取中位数
            Collections.sort(validValues);
            return validValues.get(validValues.size() / 2);
        } else {
            // 2. 无有效值则取前一个正常值(向前搜索)
            for (int i = centerIdx - 1; i >= 0; i--) {
                if (Math.abs(data[i]) <= maxAllowed) {
                  return data[i];
                }
            }
            // 3. 极端情况返回0
            return 0.0;
        }
    }

}
图片生成 方法
package com.shinrun.infrastructure.util;

import org.jfree.chart.ChartFactory;
import org.jfree.chart.ChartUtils;
import org.jfree.chart.JFreeChart;
import org.jfree.chart.axis.NumberAxis;
import org.jfree.chart.plot.XYPlot;
import org.jfree.chart.renderer.xy.XYLineAndShapeRenderer;
import org.jfree.chart.ui.RectangleInsets;
import org.jfree.data.xy.XYSeries;
import org.jfree.data.xy.XYSeriesCollection;

import java.awt.*;
import java.io.ByteArrayOutputStream;
import java.io.IOException;
import java.util.Base64;

/**
 * 医疗级心电图生成工具类(10段垂直排列)
 * 实现了标准心电图纸网格和比例尺
 */
public class ECGChartGenerator {

    // ============= 默认参数配置 =============
    private static final int DEFAULT_SAMPLE_RATE = 500; // 默认采样率500Hz
    private static final int SEGMENT_COUNT = 10; // 固定10段心电图
    private static final int DEFAULT_WIDTH = 800; // 图片默认宽度
    private static final int SEGMENT_HEIGHT = 150; // 每段心电图高度
    private static final int TOTAL_HEIGHT = SEGMENT_COUNT * SEGMENT_HEIGHT; // 总高度

    // 心电图纸网格参数(医疗标准)
    private static final int SMALL_GRID_MM = 1; // 小方格1mm
    private static final int LARGE_GRID_MM = 5; // 大方格5mm(5个小方格)
    private static final int GRID_SIZE_PX = 12; // 1mm对应的像素数(方法二)

    // 心电图显示参数
    private static final double DEFAULT_MM_PER_MV = 10.0; // 标准灵敏度:10mm/mV
    private static final double DEFAULT_PAPER_SPEED_MM_PER_SEC = 25.0; // 标准走纸速度:25mm/s

    private static final int DEFAULT_HEIGHT = 600; // 图片默认高度


    /**
     * 生成无标签的心电图纸网格
     */
    public static String generateECGGrid() throws IOException {
        // 创建空数据集(不需要实际数据)
        XYSeriesCollection dataset = new XYSeriesCollection();

        // 创建图表
        JFreeChart chart = ChartFactory.createXYLineChart(
            null, "", "", dataset);

        // 自定义网格样式
        customizeGridChart(chart);
        return convertChartToBase64(chart, DEFAULT_WIDTH, DEFAULT_HEIGHT);
    }

    /**
     * 自定义网格图表样式
     */
    private static void customizeGridChart(JFreeChart chart) {
        XYPlot plot = chart.getXYPlot();

        // 1. 背景设置
        plot.setBackgroundPaint(Color.WHITE);
        chart.setBackgroundPaint(Color.WHITE);

        // 2. 网格线设置(医疗标准)
        plot.setDomainGridlinePaint(new Color(255, 200, 200)); // 小网格线颜色
        plot.setRangeGridlinePaint(new Color(255, 200, 200));
        plot.setDomainGridlineStroke(new BasicStroke(0.5f));   // 小网格线宽度
        plot.setRangeGridlineStroke(new BasicStroke(0.5f));

        // 计算网格大小(像素)
        double smallGridPx = SMALL_GRID_MM * GRID_SIZE_PX;
        double largeGridPx = LARGE_GRID_MM * GRID_SIZE_PX;

        // 3. X轴(时间轴)设置 - 隐藏所有标签和刻度
        NumberAxis xAxis = (NumberAxis) plot.getDomainAxis();
        xAxis.setAxisLineVisible(false);
        xAxis.setTickMarksVisible(false);
        xAxis.setTickLabelsVisible(false);
        xAxis.setStandardTickUnits(NumberAxis.createIntegerTickUnits());
        xAxis.setTickUnit(new org.jfree.chart.axis.NumberTickUnit(largeGridPx));

        // 4. Y轴(幅度轴)设置 - 隐藏所有标签和刻度
        NumberAxis yAxis = (NumberAxis) plot.getRangeAxis();
        yAxis.setAxisLineVisible(false);
        yAxis.setTickMarksVisible(false);
        yAxis.setTickLabelsVisible(false);
        yAxis.setTickUnit(new org.jfree.chart.axis.NumberTickUnit(largeGridPx));

        // 5. 移除所有渲染器(因为我们只需要网格)
        plot.setRenderer(null);

        // 6. 调整图表边距
        plot.setAxisOffset(new RectangleInsets(5, 5, 5, 5));

        // 7. 确保没有图例
        chart.removeLegend();

        // 8. 设置合适的范围以显示网格
        xAxis.setRange(0, DEFAULT_WIDTH / GRID_SIZE_PX);
        yAxis.setRange(0, DEFAULT_HEIGHT / GRID_SIZE_PX);
    }


    /**
     * 使用默认参数生成10段ECG Base64图片
     */
    public static String generateSegmentedECGImage(double[] ecgData) throws IOException {
        return generateSegmentedECGImage(ecgData, DEFAULT_SAMPLE_RATE,
                                       DEFAULT_MM_PER_MV, DEFAULT_PAPER_SPEED_MM_PER_SEC);
    }

    /**
     * 自定义参数生成10段ECG Base64图片
     */
    public static String generateSegmentedECGImage(double[] ecgData, int sampleRate,
                                                  double mmPerMv, double paperSpeedMmPerSec) throws IOException {
        // 计算每段数据点数
        int pointsPerSegment = ecgData.length / SEGMENT_COUNT;

        XYSeriesCollection dataset = new XYSeriesCollection();

        // 创建10个数据段
        for (int seg = 0; seg < SEGMENT_COUNT; seg++) {
            int start = seg * pointsPerSegment;
            int end = (seg == SEGMENT_COUNT - 1) ? ecgData.length : start + pointsPerSegment;

            XYSeries series = new XYSeries("ECG Segment " + (seg + 1));

            // 垂直偏移量(使各段分开显示)
            double yOffset = -seg * 2.0; // 每段下移2mV

            for (int i = start; i < end; i++) {
                // 计算时间并转换为毫米(基于走纸速度)
                double timeSec = (i - start) / (double) sampleRate;
                double xPosMm = timeSec * paperSpeedMmPerSec;
                // 转换为像素
                double xPixel = xPosMm * GRID_SIZE_PX;

                // 转换ECG值到mV(输入是uV)
                double valueMv = ecgData[i] / 1000.0;
                // 应用垂直比例尺(mm/mV)
                double yPosMm = valueMv * mmPerMv;
                // 转换为像素并加上偏移量
                double yPixel = yPosMm * GRID_SIZE_PX + (yOffset * mmPerMv * GRID_SIZE_PX);

                series.add(xPixel, yPixel);
            }
            dataset.addSeries(series);
        }

        // 创建图表
        JFreeChart chart = ChartFactory.createXYLineChart(
                null, "时间 (mm)", "幅度 (mm)", dataset);

        // 自定义心电图样式
        customizeMedicalECGChart(chart, mmPerMv, paperSpeedMmPerSec);
        return convertChartToBase64(chart, DEFAULT_WIDTH, TOTAL_HEIGHT);
    }

    /**
     * 自定义心电图图表样式(医疗标准)
     */
    private static void customizeMedicalECGChart(JFreeChart chart, double mmPerMv, double paperSpeedMmPerSec) {
        XYPlot plot = chart.getXYPlot();

        // 1. 背景设置
        plot.setBackgroundPaint(Color.WHITE);
        chart.setBackgroundPaint(Color.WHITE);

        // 2. 网格线设置(医疗标准)
        plot.setDomainGridlinePaint(new Color(255, 200, 200)); // 小网格线颜色
        plot.setRangeGridlinePaint(new Color(255, 200, 200));
        plot.setDomainGridlineStroke(new BasicStroke(0.5f));   // 小网格线宽度
        plot.setRangeGridlineStroke(new BasicStroke(0.5f));

        // 计算网格大小(像素)
        double smallGridPx = SMALL_GRID_MM * GRID_SIZE_PX;
        double largeGridPx = LARGE_GRID_MM * GRID_SIZE_PX;

        // 3. X轴(时间轴)设置
        NumberAxis xAxis = (NumberAxis) plot.getDomainAxis();
        xAxis.setAxisLinePaint(Color.BLACK);
        xAxis.setTickMarkPaint(Color.BLACK);
        xAxis.setStandardTickUnits(NumberAxis.createIntegerTickUnits());
        xAxis.setTickUnit(new org.jfree.chart.axis.NumberTickUnit(largeGridPx));

        // 新版JFreeChart不再支持setMinorTickMarkPaint,改用以下方式设置次刻度
        xAxis.setMinorTickCount(4);
        xAxis.setMinorTickMarksVisible(true);

        // 4. Y轴(幅度轴)设置
        NumberAxis yAxis = (NumberAxis) plot.getRangeAxis();
        yAxis.setAxisLinePaint(Color.BLACK);
        yAxis.setTickMarkPaint(Color.BLACK);
        yAxis.setTickUnit(new org.jfree.chart.axis.NumberTickUnit(largeGridPx));
        yAxis.setMinorTickCount(4);
        yAxis.setMinorTickMarksVisible(true);

        // 5. 心电图曲线渲染设置
        XYLineAndShapeRenderer renderer = new XYLineAndShapeRenderer();
        renderer.setSeriesPaint(0, Color.BLACK);
        renderer.setSeriesStroke(0, new BasicStroke(1.5f));

        // 为所有段应用相同的渲染器
        for (int i = 0; i < SEGMENT_COUNT; i++) {
            plot.setRenderer(i, renderer);
            renderer.setSeriesPaint(i, Color.BLACK);
            renderer.setSeriesStroke(i, new BasicStroke(1.5f));
            renderer.setSeriesShapesVisible(i, false);
        }

        // 6. 调整图表边距
        plot.setAxisOffset(new RectangleInsets(5, 5, 5, 5));

        // 7. 移除图例
        chart.removeLegend();

        // 8. 添加标题显示参数
        chart.setTitle("心电图 - " + mmPerMv + "mm/mV, 走纸速度 " + paperSpeedMmPerSec + "mm/s");
    }


    /**
     * 使用默认参数生成10段ECG Base64图片(无刻度值)
     */
    public static String generateSegmentedECGImageNoLabels(double[] ecgData) throws IOException {
        return generateSegmentedECGImageNoLabels(ecgData, DEFAULT_SAMPLE_RATE,
            DEFAULT_MM_PER_MV, DEFAULT_PAPER_SPEED_MM_PER_SEC);
    }


    /**
     * 自定义参数生成10段ECG Base64图片(无刻度值)
     */
    public static String generateSegmentedECGImageNoLabels(double[] ecgData, int sampleRate,
        double mmPerMv, double paperSpeedMmPerSec) throws IOException {
        // 计算每段数据点数
        int pointsPerSegment = ecgData.length / SEGMENT_COUNT;

        XYSeriesCollection dataset = new XYSeriesCollection();

        // 创建10个数据段
        for (int seg = 0; seg < SEGMENT_COUNT; seg++) {
            int start = seg * pointsPerSegment;
            int end = (seg == SEGMENT_COUNT - 1) ? ecgData.length : start + pointsPerSegment;

            XYSeries series = new XYSeries("ECG Segment " + (seg + 1));

            // 垂直偏移量(使各段分开显示)
            double yOffset = -seg * 2.0; // 每段下移2mV

            for (int i = start; i < end; i++) {
                // 计算时间并转换为毫米(基于走纸速度)
                double timeSec = (i - start) / (double) sampleRate;
                double xPosMm = timeSec * paperSpeedMmPerSec;
                // 转换为像素
                double xPixel = xPosMm * GRID_SIZE_PX;

                // 转换ECG值到mV(输入是uV)
                double valueMv = ecgData[i] / 1000.0;
                // 应用垂直比例尺(mm/mV)
                double yPosMm = valueMv * mmPerMv;
                // 转换为像素并加上偏移量
                double yPixel = yPosMm * GRID_SIZE_PX + (yOffset * mmPerMv * GRID_SIZE_PX);

                series.add(xPixel, yPixel);
            }
            dataset.addSeries(series);
        }

        // 创建图表
        JFreeChart chart = ChartFactory.createXYLineChart(
            null, "", "", dataset); // 空标题和空轴标签

        // 自定义心电图样式(无刻度值)
        customizeMedicalECGChartNoLabels(chart, mmPerMv, paperSpeedMmPerSec);
        return convertChartToBase64(chart, DEFAULT_WIDTH, TOTAL_HEIGHT);
    }


    /**
     * 自定义心电图图表样式(医疗标准,无刻度值)
     */
    private static void customizeMedicalECGChartNoLabels(JFreeChart chart, double mmPerMv, double paperSpeedMmPerSec) {
        XYPlot plot = chart.getXYPlot();

        // 1. 背景设置
        plot.setBackgroundPaint(Color.WHITE);
        chart.setBackgroundPaint(Color.WHITE);

        // 2. 网格线设置(医疗标准)
        plot.setDomainGridlinePaint(new Color(255, 200, 200)); // 小网格线颜色
        plot.setRangeGridlinePaint(new Color(255, 200, 200));
        plot.setDomainGridlineStroke(new BasicStroke(0.5f));   // 小网格线宽度
        plot.setRangeGridlineStroke(new BasicStroke(0.5f));

        // 计算网格大小(像素)
        double smallGridPx = SMALL_GRID_MM * GRID_SIZE_PX;
        double largeGridPx = LARGE_GRID_MM * GRID_SIZE_PX;

        // 3. X轴(时间轴)设置 - 隐藏刻度值
        NumberAxis xAxis = (NumberAxis) plot.getDomainAxis();
        xAxis.setAxisLineVisible(false);          // 隐藏轴线
        xAxis.setTickMarksVisible(false);         // 隐藏刻度线
        xAxis.setTickLabelsVisible(false);        // 隐藏刻度标签
        xAxis.setStandardTickUnits(NumberAxis.createIntegerTickUnits());
        xAxis.setTickUnit(new org.jfree.chart.axis.NumberTickUnit(largeGridPx));

        // 4. Y轴(幅度轴)设置 - 隐藏刻度值
        NumberAxis yAxis = (NumberAxis) plot.getRangeAxis();
        yAxis.setAxisLineVisible(false);          // 隐藏轴线
        yAxis.setTickMarksVisible(false);         // 隐藏刻度线
        yAxis.setTickLabelsVisible(false);        // 隐藏刻度标签
        yAxis.setTickUnit(new org.jfree.chart.axis.NumberTickUnit(largeGridPx));

        // 5. 心电图曲线渲染设置
        XYLineAndShapeRenderer renderer = new XYLineAndShapeRenderer();
        renderer.setSeriesPaint(0, Color.BLACK);
        renderer.setSeriesStroke(0, new BasicStroke(0.8f));

        // 为所有段应用相同的渲染器
        for (int i = 0; i < SEGMENT_COUNT; i++) {
            plot.setRenderer(i, renderer);
            renderer.setSeriesPaint(i, Color.BLACK);
            renderer.setSeriesStroke(i, new BasicStroke(0.8f));
            renderer.setSeriesShapesVisible(i, false);
        }

        // 6. 调整图表边距
        plot.setAxisOffset(new RectangleInsets(5, 5, 5, 5));

        // 7. 移除图例
        chart.removeLegend();

        // 8. 移除标题
        chart.setTitle("心电图 - " + mmPerMv + "mm/mV, 走纸速度 " + paperSpeedMmPerSec + "mm/s");
    }


    /**
     * 将图表转换为Base64编码的PNG图片
     */
    private static String convertChartToBase64(JFreeChart chart, int width, int height) throws IOException {
        try (ByteArrayOutputStream outputStream = new ByteArrayOutputStream()) {
            ChartUtils.writeChartAsPNG(outputStream, chart, width, height);
            return "data:image/png;base64," +
                   Base64.getEncoder().encodeToString(outputStream.toByteArray());
        }
    }
}
讲解使用
我的心电图数据是来着于第三方平台的(是由机器将心电数据文件上传到第三方系统,第三方系统给我返回的double数组)
首先是进行 滤波,数据会有很大的外界因素影响,波动会很大,
再将数据转换成mv
再画图,进行调试
  public String generateEcg(double[] rawData ) {

    // 转换参数
    double scaleFactor = 20.0;
    String oss="";

    // 方法1: 使用默认参数处理
    double[] processedECG = ECGDataConverter.filterRawData(rawData,4000);

    //转换成mv
    double[] doubles = ECGDataConverter.convertToMillivolts(processedECG, scaleFactor);
    // 生成时间轴
    try {
      String string = ECGChartGenerator.generateSegmentedECGImageNoLabels(doubles);

      oss= uploadFile(string, "image/ecg");
    } catch (IOException e) {
      throw new RuntimeException(e);
    }
    return oss;
  }
关键点
double[] processedECG = ECGDataConverter.filterRawData(rawData,4000);
这里 滤波参数我给的4000 其实就是 将超过4000的值给过滤掉,第三方给的数据 人的平均心跳峰值不超过4000,超过4000的那就不对需要过滤掉,这个根据你实际的数据进行修改
    double scaleFactor = 20.0;
  //转换成mv
    double[] doubles = ECGDataConverter.convertToMillivolts(processedECG, scaleFactor);
这里传个参数scaleFactor ,其实就是对数据进行除一下,这里由于第三方给的数据不太规范,不除以一下的话画出来不太好看
一般数据除到是百位数就行了
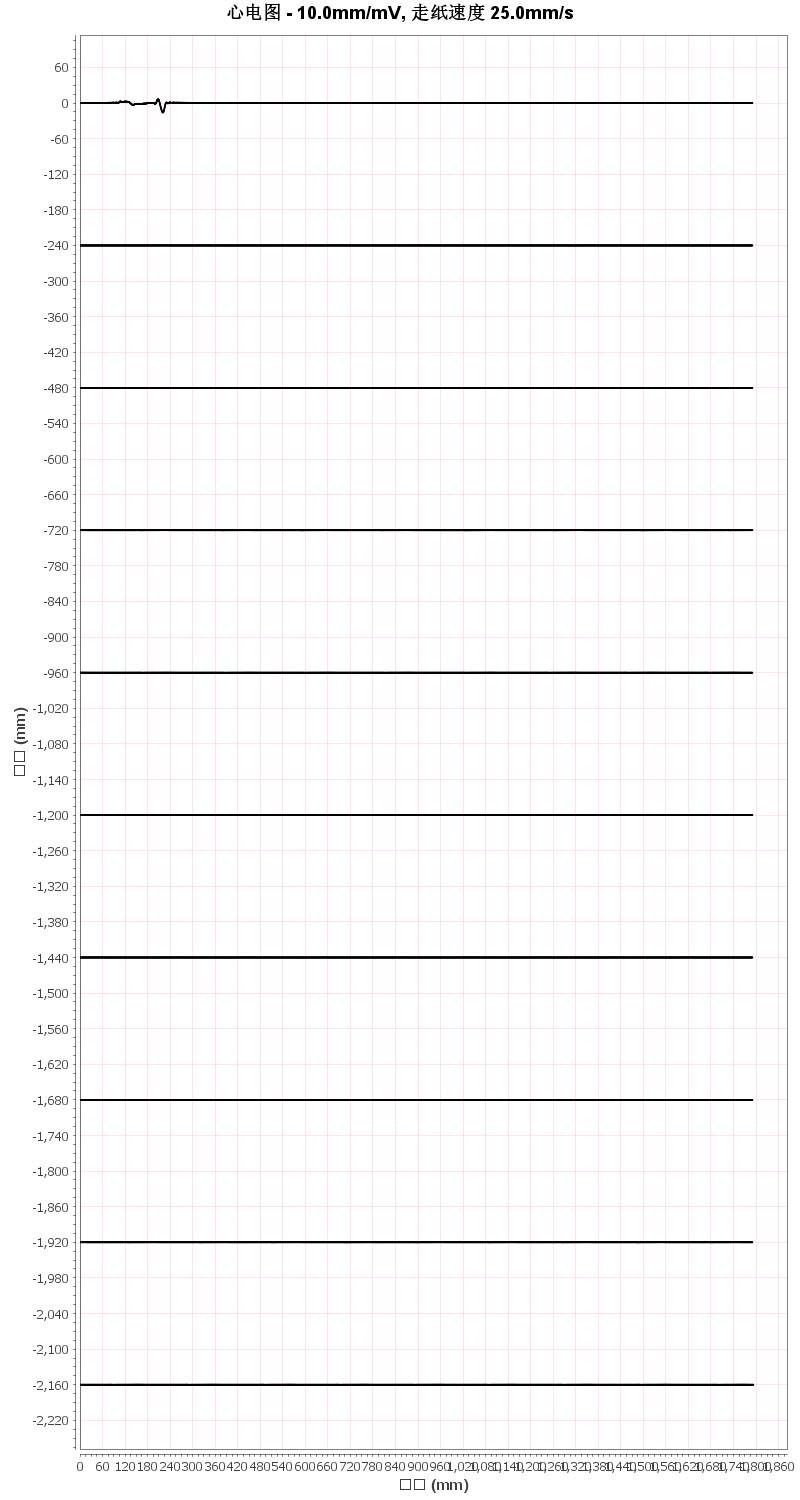
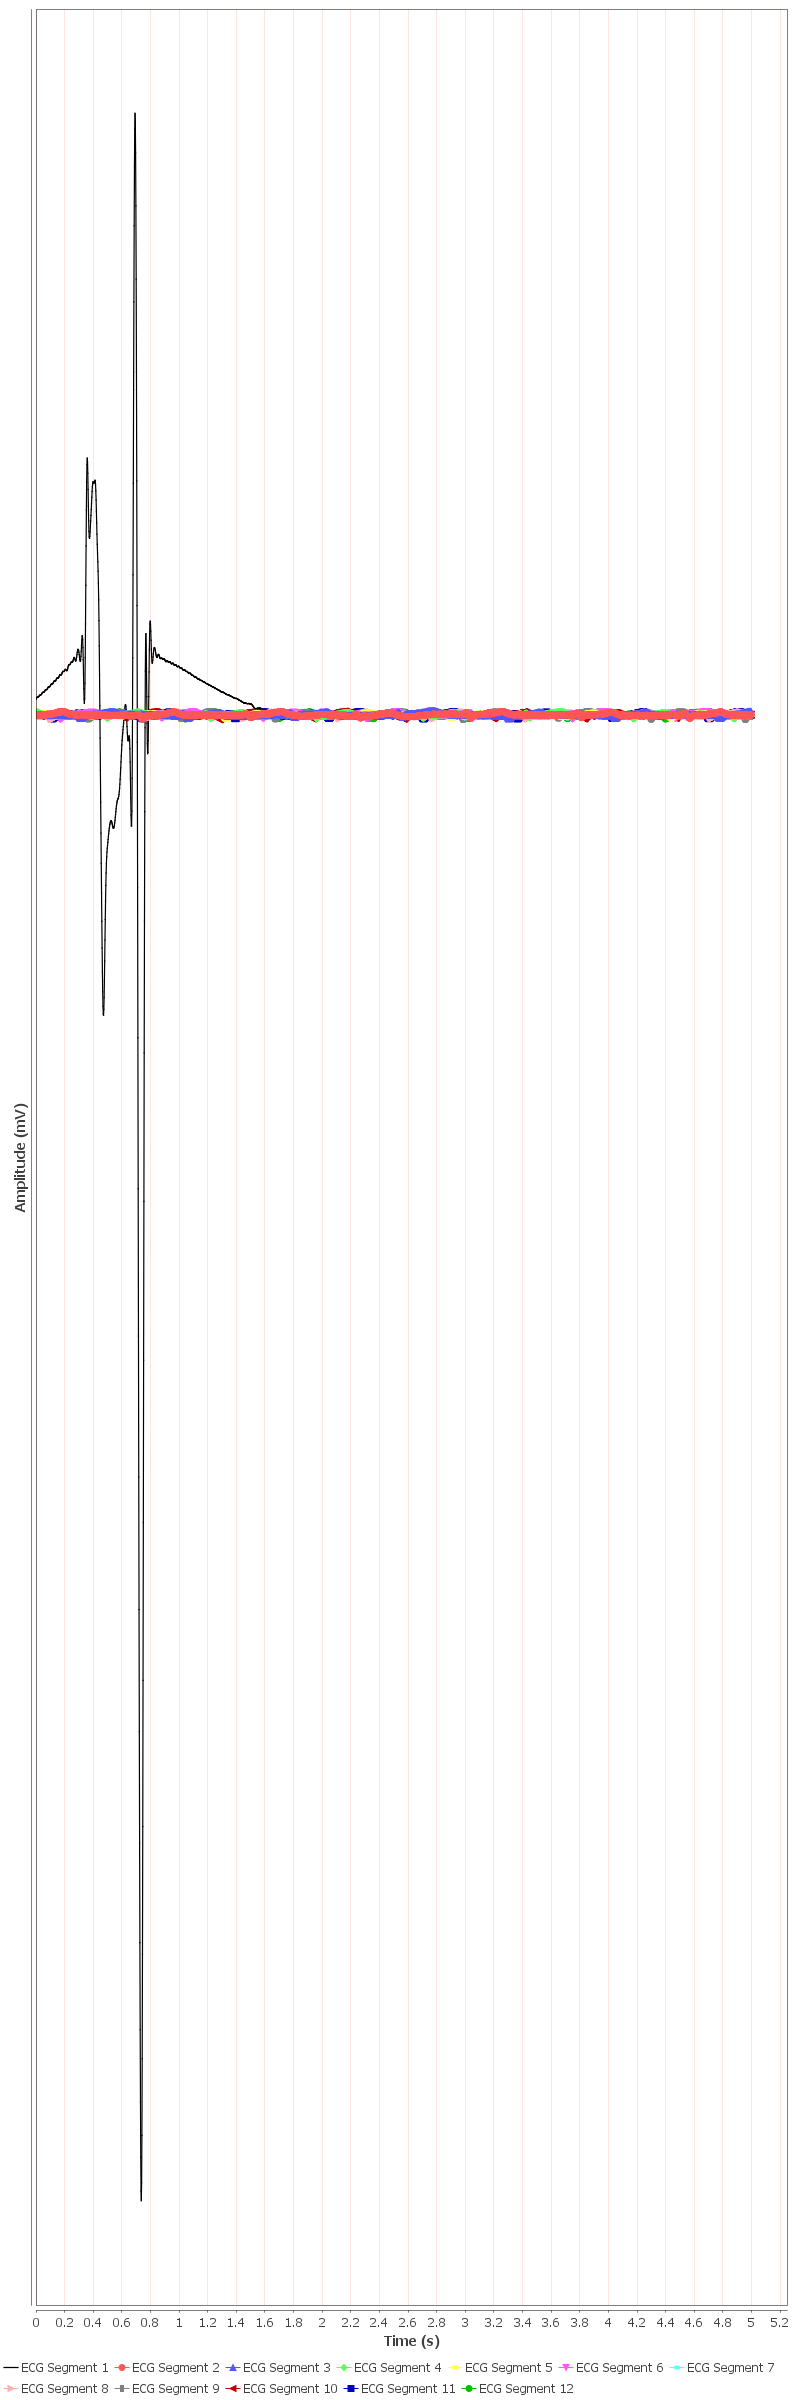
如果上面两点没有做好的话效果可能如下