前置:
pip install PyQt6-Charts
结果:
代码:
import sys
from PyQt6.QtCharts import (QBarCategoryAxis, QBarSet, QChart,
QChartView, QValueAxis,QHorizontalBarSeries)
from PyQt6.QtCore import Qt,QSize
from PyQt6.QtGui import QPainter,QColor
from PyQt6.QtWidgets import QApplication, QWidget,QVBoxLayout
class BarChartWidget(QWidget):
def __init__(self):
super().__init__()
self.setMinimumSize(QSize(400,600))
self.chart = QChart()
self._chart_view = QChartView(self.chart)
self._chart_view.setRenderHint(QPainter.RenderHint.Antialiasing)
layout = QVBoxLayout()
layout.addWidget(self._chart_view)
self.setLayout(layout)
pass
def set_data(self,data:dict):
self.data = data
self.set_0 = QBarSet('')
self.set_0.append(list(self.data['data_map'].values())) # 7
self.set_0.setBarSelected(self.data['target_int'], True)
self.set_0.setSelectedColor(QColor(255, 99, 71))
self.series = QHorizontalBarSeries()
self.series.append(self.set_0)
self.series.setLabelsVisible(True)
self.series.setLabelsPosition(QHorizontalBarSeries.LabelsPosition.LabelsInsideEnd)
self.series.setLabelsFormat(f"@value {self.data['union_val']}")
self.chart.addSeries(self.series)
self.chart.setTitle(self.data['title'])
self.chart.legend().hide()
self.chart.setAnimationOptions(QChart.AnimationOption.SeriesAnimations)
self.categories = list(self.data['data_map'].keys())
self.axis_x = QBarCategoryAxis()
self.axis_x.append(self.categories)
self.chart.addAxis(self.axis_x, Qt.AlignmentFlag.AlignLeft)
self.series.attachAxis(self.axis_x)
self.axis_y = QValueAxis()
self.axis_y.setRange(0, max(list(self.data['data_map'].values())))
self.chart.addAxis(self.axis_y, Qt.AlignmentFlag.AlignBottom)
self.series.attachAxis(self.axis_y)
pass
if __name__ == '__main__':
app = QApplication([])
pre_data = {
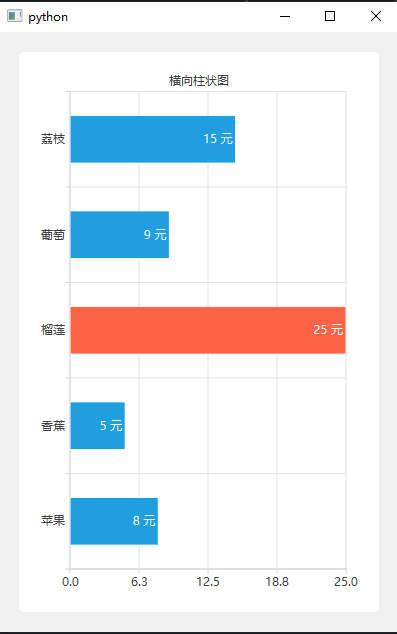
'title':'横向柱状图',
'target_int':2,
'union_val':'元',
'data_map':{
'苹果':8,
'香蕉':5,
'榴莲':25,
'葡萄':9,
'荔枝':15
}
}
mw = BarChartWidget()
mw.set_data(pre_data)
mw.show()
sys.exit(app.exec())
pass