#在工程中,经常用到计算土方回填、土方开挖的体积。就是在一个范围内,计算土被挖走,或者填多少,这个需要测量挖填前后这个范围内的高程点。为此,我开发一个app,可以直接在autocad上提取高程点,然后导入py程序中计算挖填前的体积,和挖填后的体积,用这2个体积的差,就得到挖、填的量,这里适合全挖方、全填方的计算,如果在里面做土方平衡,那么需要分解成多个范围全填方和全挖方来计算。#
首先是,提取多段线的坐标。
(defun c:getplpt (/ s_line line_name line_data points ele)
  (setq s_line (entsel "请选择一条多段线:" ));选择一个多段线
  (setq line_name (car s_line));获得多段线的名字
  (setq line_data (entget line_name));获得多段线的属性值
  (if (= "LWPOLYLINE" (cdr (assoc 0 line_data)));如果选择的是多段线,那么将执行以下程序
    (progn
      (setq points nil);设定一个变量用来存储结果
      (foreach ele line_data
        (if (= (car ele) 10)
          (setq points (append points (LIST (cdr ele))))
        )
      )
    )
    (alert "请选择多段线!");如果不是多段线则进行提醒
  )
  ;由于每次用(assoc 10 line_data)只能选出一个顶点来,故采用循环判断的方法
  (write_to_file points);将得到的坐标表输出至外部文件
  (alert "完成!")
  (prin1)
)
;设置一个函数将坐标列表转换为字符串
(defun list_to_string (p_list / first second p_string)
  (setq first (car p_list));获取第一个坐标值
  (setq second (cadr p_list));获取第二个坐标值
  (setq p_string (strcat (rtos first) "," (rtos second)))
)
;设置一个函数用来输出坐标值至外部的txt文档
(defun write_to_file (points / file_path ff en)
  (setq file_path (getfiled "输出文件" "结果文件" "txt" 1))
  (setq ff (open file_path "w"))
  (foreach en points (write-line (list_to_string en) ff))
  (close ff)
)
copy上面代码到AutoCAD命令行,后输入“getplpt”就能运行,按提示保存选择的范围线的各个点的坐标。如果是三维多段线,则需要把它转化为二维多段线。
然后是提取地形图的高程点,这个应该通常在GCD图层,至少目前我常常看到的是这样的。如果不是请改下面代码。
;获取GCD图层内容的所有高程点坐标及高程
(defun c:getGCDPoints ()
  (setq file_path (getfiled "输出保存高程点文件" "结果文件" "txt" 1))
  (setq ss (ssget "X" '((8 . "GCD"))))  ; 选择所有在"Elevation"层上的对象
  (setq numEnt (sslength ss))                 ; 获取选择集的长度
  (setq i 0)                                  ; 初始化计数器
  (setq ff (open file_path "w"))
  (while (< i numEnt)                         ; 遍历所有选中的实体
    (setq ent (ssname ss i))                 ; 获取当前实体
    (setq ent (entget ent))
    (setq xyh (cdr (assoc 10 ent)))              ; 获取Xyh
    (setq x (rtos (car xyh) 2 4))
    (setq y (rtos (cadr xyh) 2 4))             ; 获取x坐标
    (setq h (rtos (caddr xyh) 2 4))              ; 获取Z坐标(高程)
    (princ (strcat x "," y "," h))
    (write-line (strcat x "," y "," h) ff)
    (setq i (+ i 1))                         ; 增加计数器
  )
  (close ff)
  (princ)                                    ; 结束输出
)
也是copy到命令行,运行getGCDPoints,它会自动把gcd图层里面的所有高程点保存到txt文件。当然最好这2个生成的txt文件要打开来看里面的数据对不对。
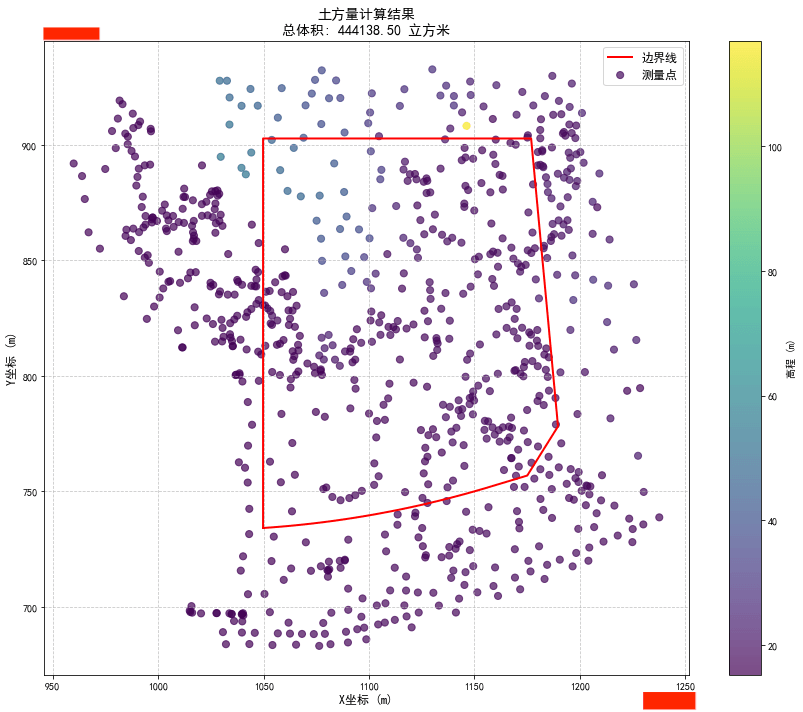
通过上面我们得到了基础数据,即高程点和范围线。我的想法是这样的,对范围线,需要把它的各个点加上高程信息,这个高程信息可以用临近有高程数据的点内插得到。然后把这些点按多段线距离2m进行加密,这样就得到范围线的点和范围内外的点,我们再剔除范围外的点,用这些点生成三角形,再通过三角形的面积和高差(我取的是数值为0的点)去计算体积。为了让大家方便使用我的程序,我采用拖拉文件的方式,给用户连续拖拉上面程序生成多段线(范围)文件和高程点文件,在拖拉第二个文件时,自动运行py程序计算,得到的结果放在下面文本框,方便复制。程序由deepseek生成,它很贴心,还给我画了plt图。
# -*- coding: utf-8 -*-
'''
用python写一个程序计算已知闭合多段线x,y坐标,和已知该范围内很多土方高程测量点(有x,y坐标,和高程h),
和该范围外一些点的坐标和高程(有x,y坐标,和高程h),求这个范围内土方的体积,取底面高程为0。
计算应将多段线的点纳入计算体积,如多段线相邻的点距离大于2m,则在该线上构造按2m左右为距离等分的点,
去计算体积,多段的点(包括构造的点)的高程取最接近该点而有高程信息的2个点内插得到的高程,
'''
import tkinter as tk
import windnd
from tkinter import LabelFrame
import numpy as np
from scipy.interpolate import griddata
from scipy.spatial import Delaunay, cKDTree
from shapely.geometry import Point, Polygon
import matplotlib.pyplot as plt
from matplotlib.path import Path
plt.rcParams['font.sans-serif'] = ['SimHei']  # 使用黑体显示中文
plt.rcParams['axes.unicode_minus'] = False  # 解决负号显示问题
ddxpath = ''
gcdpath = ''

def interpolate_elevation(points, elevations, target_points, k=2):
    """
    使用最近k个点进行高程插值
    :param points: 已知点的坐标数组,形状为 (n, 2)
    :param elevations: 已知点的高程数组,形状为 (n,)
    :param target_points: 需要插值的点坐标数组,形状为 (m, 2)
    :param k: 使用最近的k个点进行插值
    :return: 插值后的高程数组,形状为 (m,)
    """
    if len(points) < k:
        raise ValueError(f"需要至少 {k} 个点进行插值,当前只有 {len(points)} 个点")

    tree = cKDTree(points)
    distances, indices = tree.query(target_points, k=k)

    # 避免除以零的情况
    distances[distances == 0] = 1e-10

    # 计算权重 (反距离加权)
    weights = 1.0 / distances
    weights = weights / np.sum(weights, axis=1, keepdims=True)

    # 插值高程
    interpolated = np.sum(elevations[indices] * weights, axis=1)

    return interpolated

def densify_polyline(polyline, max_segment_length=2.0):
    """
    对多段线进行加密,确保相邻点之间的距离不超过max_segment_length
    :param polyline: 多段线点数组,形状为 (n, 2)
    :param max_segment_length: 最大线段长度
    :return: 加密后的多段线点数组
    """
    densified = []

    for i in range(len(polyline) - 1):
        start = polyline[i]
        end = polyline[i + 1]
        densified.append(start)

        distance = np.linalg.norm(end - start)
        if distance > max_segment_length:
            num_segments = int(np.ceil(distance / max_segment_length))
            for j in range(1, num_segments):
                alpha = j / num_segments
                point = start + alpha * (end - start)
                densified.append(point)

    densified.append(polyline[-1])
    # print(densified)
    return np.array(densified)

def points_in_polygon(points, polygon):
    """
    判断点是否在多边形内
    :param points: 点坐标数组,形状为 (n, 2)
    :param polygon: 多边形点坐标数组,形状为 (m, 2)
    :return: 布尔数组,表示每个点是否在多边形内
    """
    path = Path(polygon)
    return path.contains_points(points)

def calculate_volume(polygon_points, survey_data, max_segment_length=2.0, k=2):
    """
    计算闭合多段线范围内的土方体积
    :param polygon_points: 闭合多段线点数组,形状为 (n, 2)
    :param survey_data: 测量点数据数组,形状为 (m, 3) [x, y, h]
    :param max_segment_length: 多段线最大分段长度
    :param k: 插值时使用的最邻近点数量
    :return: 土方体积(立方米)
    """
    # 分离测量点坐标和高程
    survey_points = survey_data[:, :2]
    survey_elevations = survey_data[:, 2]

    # 加密多段线
    densified_polygon = densify_polyline(polygon_points, max_segment_length)

    # 判断哪些测量点在多边形内
    inside_mask = points_in_polygon(survey_points, densified_polygon)
    inside_points = survey_points[inside_mask]
    inside_elevations = survey_elevations[inside_mask]

    # 合并多段线点和内部测量点
    all_volume_points = np.vstack([densified_polygon, inside_points])

    # 为所有点插值高程 (使用所有测量点)
    point_elevations = interpolate_elevation(
        survey_points, survey_elevations, all_volume_points, k=k
    )

    # 创建三角网格
    try:
        tri = Delaunay(all_volume_points)
    except:
        # 如果无法三角化,可能是所有点共线,使用简单方法计算
        print("警告: 点共线,使用简化方法计算")
        polygon = Polygon(densified_polygon)
        area = polygon.area
        avg_elevation = np.mean(point_elevations)
        return area * avg_elevation

    # 计算每个三角形的面积和平均高程
    total_volume = 0.0
    for simplex in tri.simplices:
        # 获取三角形的三个点
        triangle_points = all_volume_points[simplex]

        # 计算三角形面积
        v1 = triangle_points[1] - triangle_points[0]
        v2 = triangle_points[2] - triangle_points[0]
        area = 0.5 * np.abs(v1[0]*v2[1] - v1[1]*v2[0])

        # 计算三角形平均高程
        avg_elevation = np.mean(point_elevations[simplex])

        # 累加体积
        total_volume += area * avg_elevation

    return total_volume

def plot_results(polygon_points, survey_data, volume):
    """
    可视化结果
    """
    survey_points = survey_data[:, :2]
    survey_elevations = survey_data[:, 2]

    plt.figure(figsize=(12, 10))

    # 绘制多边形
    plt.plot(np.append(polygon_points[:, 0], polygon_points[0, 0]),
             np.append(polygon_points[:, 1], polygon_points[0, 1]),
             'r-', linewidth=2, label='边界线')

    # 绘制测量点
    sc = plt.scatter(survey_points[:, 0], survey_points[:, 1],
                    c=survey_elevations, cmap='viridis',
                    s=50, alpha=0.7, label='测量点')

    plt.colorbar(sc, label='高程 (m)')
    plt.title(f'土方量计算结果\n总体积: {volume:.2f} 立方米', fontsize=14)
    plt.xlabel('X坐标 (m)', fontsize=12)
    plt.ylabel('Y坐标 (m)', fontsize=12)
    plt.legend(fontsize=12)
    plt.grid(True, linestyle='--', alpha=0.7)
    plt.tight_layout()
    plt.show()

def handle_ddx(files):
    global ddxpath
    if len(files) > 0:
        path = files[0].decode('gbk').replace('\\', '/')
        label1.config(text = f'{path}')
        ddxpath = path

def handle_gcd(files):
    global ddxpath
    global gcdpath
    if len(files) > 0:
        path = files[0].decode('gbk').replace('\\', '/')
        label2.config(text = f'{path}')
        gcdpath = path
        if ddxpath != '' and gcdpath != '':
            # text_widget.insert(tk.END, f"{ddxpath}\n")
            # text_widget.insert(tk.END, f"{gcdpath}\n")
            # 打开多段线文件
            with open(ddxpath, 'r') as file:
                # 读取所有行
                lines = file.readlines()
                # 转换每一行为列表
                lines_list = [line.strip().split(',') for line in lines]
            polyline = np.array(lines_list).astype(float)

            with open(gcdpath, 'r') as file:
                # 读取所有行
                lines = file.readlines()
                # 转换每一行为列表
                lines_list = [line.strip().split(',') for line in lines]
            survey_data = np.array(lines_list).astype(float)

            volume = calculate_volume(polyline, survey_data)

            print(f"计算得到的回填后土方体积为: {volume:.2f} 立方米")
            text_widget.insert(tk.END, f"计算得到的土方体积为: {volume:.2f} 立方米\n")
            plot_results(polyline, survey_data, volume)


# 示例数据
if __name__ == "__main__":

    root = tk.Tk()
    root.title('计算多段线范围内到0高程的土方面积')
    root.geometry("600x400")

    # 多段线拖放区域
    ddx_frame = LabelFrame(root, text="拖放多段线文件到此", width=250)
    ddx_frame.pack( expand=True, padx=10)
    label1 = tk.Label(ddx_frame,
                      wraplength=580,
                      text="")
    label1.pack(anchor="w", pady=5)
    windnd.hook_dropfiles(ddx_frame, func=handle_ddx)

    # gcd拖放区域
    gcd_frame = LabelFrame(root, text="拖放高程点文件到此", width=250)
    gcd_frame.pack(expand=True, padx=10)
    label2 = tk.Label(gcd_frame,
                      wraplength=580,
                      text="")
    label2.pack(anchor="w", pady=5)
    windnd.hook_dropfiles(gcd_frame, func=handle_gcd)

    # 运算结果区域

    res_frame = LabelFrame(root, text="运算结果:", width=250)
    res_frame.pack(expand=True, padx=10)
    text_widget = tk.Text(res_frame,
                         width=250,
                         height=20,
                         wrap=tk.WORD)
    text_widget.pack(pady=5)
    root.mainloop()
运行界面:
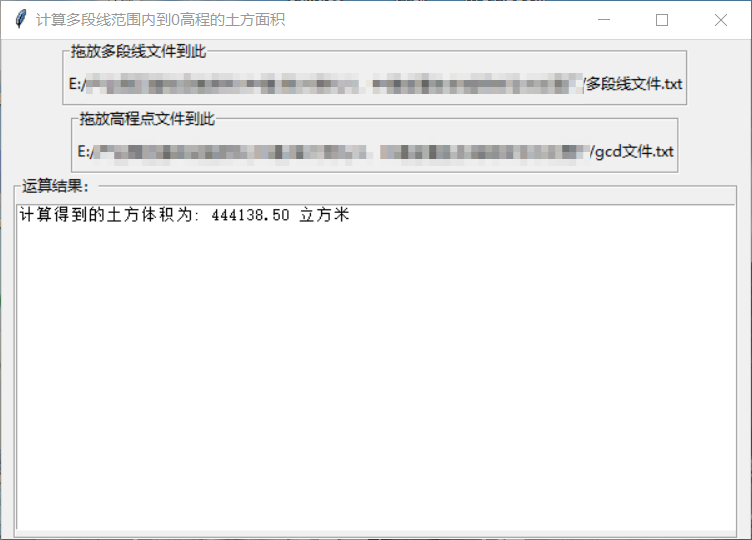
标题写错,应该是“体积”。