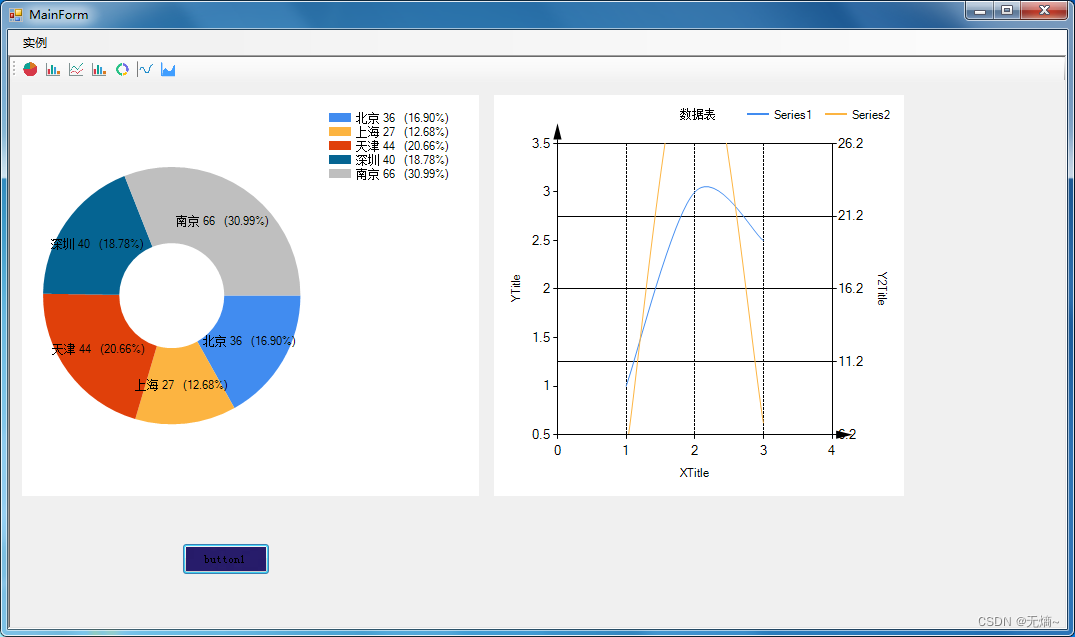
Chart控件是微软自带的一种图形可视化组件,能展示种类丰富的图表形式。如曲线图,折线图,饼状图,环形图,柱状图,曲线面积图。
实例代码链接:https://download.csdn.net/download/lvxingzhe3/89432831
Chart基本属性
- ChartAreas:图表区属性,设置图标数据的背景,比如隐藏还是显示横纵交叉线,颜色的设置
- Series:图表序列属性,设置数据的外观,数据类型(折线图、树状图、饼图等)
- Legends:图表图例集合
- Titles:图表标题集合,设置图表的标题
- Annotations:用于存储图表批注
图表样式属性
- 元素渐变样式: Chart1.BackGradientStyle=System.Windows.Forms.DataVisualization.Charting.GradientStyle.TopBottom;
- 背景辅助颜色:Chart1.BackSecondaryColor = System.Drawing.Color.Yellow;
- 图像边框颜色:Chart1.BorderlineColor = System.Drawing.Color.Yellow;
- 边框线样式:Chart1.BorderlineDashStyle=System.Windows.Forms.DataVisualization.Charting.ChartDashStyle.Solid;
- 图像边框宽度:Chart1.BorderlineWidth = 3;
- 边框外观样式:Chart1.BorderSkin.SkinStyle=System.Windows.Forms.DataVisualization.Charting.BorderSkinStyle.Emboss;
- 图表背景颜色:Chart1.BackColor = System.Drawing.Color.Yellow;
数据样式属性
- X轴的数据源: Chart1.Series[“Series1”].XValueMember = “name”;
- Y轴的数据源: Chart1.Series[“Series1”].YValueMembers = “mobile”;
- 设置颜色: Chart1.Series[“Series1”].Color = System.Drawing.Color.Red;
- 图表类型:Chart1.Series[“Series2”].ChartType=System.Web.UI.DataVisualization.Charting.SeriesChartType.Line;
- 是否在Chart中显示坐标点值:Chart1.Series[“Series1”].IsValueShownAsLabel = true;
- 数据边框颜色:Chart1.Series[“Series1”].BorderColor = System.Drawing.Color.Red;
- 图表背景颜色:Chart1.BackColor = System.Drawing.Color.Red;
- 数据颜色:Chart1.Series[“Series1”].Color = System.Drawing.Color.Black;
- 数据名称:Chart1.Series[“Series1”].Name = “数据1”;
- 阴影偏移量:Chart1.Series[“数据1”].ShadowOffset = 1;
- 阴影颜色:Chart1.Series[“数据1”].ShadowColor = System.Drawing.Color.PaleGreen;
图例样式
图例的实例:Legend l = new Legend();
- l.Alignment = System.Drawing.StringAlignment.Near;//设置图表的对齐方式(中间对齐,靠近原点对齐,远离原点对齐)
- l.BackColor = System.Drawing.Color.Black;//设置图例的背景颜色
- l.DockedToChartArea = “ChartArea1”;//设置图例要停靠在哪个区域上
- l.Docking = System.Windows.Forms.DataVisualization.Charting.Docking.Bottom;//设置停靠在图表区域的位置(底部、顶部、左侧、右侧)
- l.Font =new System.Drawing.Font(“Trebuchet MS”, 8.25F, System.Drawing.FontStyle.Bold);//设置图例的字体属性
- l.IsTextAutoFit = true;//设置图例文本是否可以自动调节大小
- l.LegendStyle = System.Windows.Forms.DataVisualization.Charting.LegendStyle.Column;//设置显示图例项方式(多列一行、一列多行、多列多行)
- l.Name = “l1”;//设置图例的名称
- Chart1.Legends.Add(l.Name);
图标区样式
- Chart1.ChartAreas[“ChartArea1”].Name = “图表区域”;
- Chart1.ChartAreas[“图表区域”].Position.Auto = true;//设置是否自动设置合适的图表元素
- Chart1.ChartAreas[“图表区域”].ShadowColor = System.Drawing.Color.YellowGreen;//设置图表的阴影颜色
- Chart1.ChartAreas[“图表区域”].Position.X=5.089137F;//设置图表元素左上角对应的X坐标
- Chart1.ChartAreas[“图表区域”].Position.Y = 5.895753F;//设置图表元素左上角对应的Y坐标
- Chart1.ChartAreas[“图表区域”].Position.Height = 86.76062F;//设置图表元素的高度
- Chart1.ChartAreas[“图表区域”].Position.Width = 88F;//设置图表元素的宽度
参考:
C# Winform编程(10)Chart图表控件_c# chart-CSDN博客
实例代码链接:https://download.csdn.net/download/lvxingzhe3/89432831


![[数据集][目标检测]变电站火灾检测电力场景烟雾明火检测数据集VOC+YOLO格式140张2类别真实场景非PS合成](https://img-blog.csdnimg.cn/direct/46e2b486b67d4ed798fa931054a823b2.png)