代码较为简单。
import numpy as np # linear algebraimport pandas as pd # data processing, CSV file I/O (e.g. pd.read_csv)import os
import matplotlib.pyplot as pltimport seaborn as sns%matplotlib inlineimport warningswarnings.filterwarnings('ignore')
df=pd.read_csv("Battery_RUL.csv")df.head()
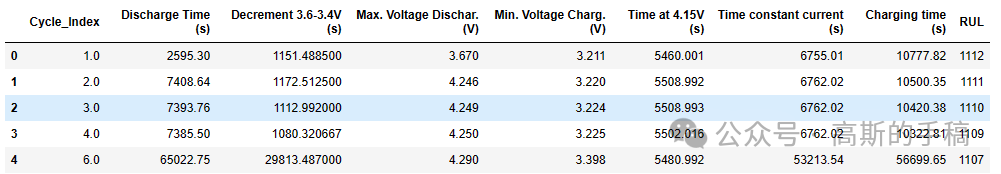
df.info()<class 'pandas.core.frame.DataFrame'> RangeIndex: 15064 entries, 0 to 15063 Data columns (total 9 columns): # Column Non-Null Count Dtype --- ------ -------------- ----- 0 Cycle_Index 15064 non-null float64 1 Discharge Time (s) 15064 non-null float64 2 Decrement 3.6-3.4V (s) 15064 non-null float64 3 Max. Voltage Dischar. (V) 15064 non-null float64 4 Min. Voltage Charg. (V) 15064 non-null float64 5 Time at 4.15V (s) 15064 non-null float64 6 Time constant current (s) 15064 non-null float64 7 Charging time (s) 15064 non-null float64 8 RUL 15064 non-null int64 dtypes: float64(8), int64(1) memory usage: 1.0 MB
df.describe()
numlist=df.columnsfig = plt.figure(figsize=(20,20))for i in range(len(numlist)):plt.subplot(3,3,i+1)plt.title(numlist[i],fontsize=12)plt.hist(df[numlist[i]])plt.tight_layout()

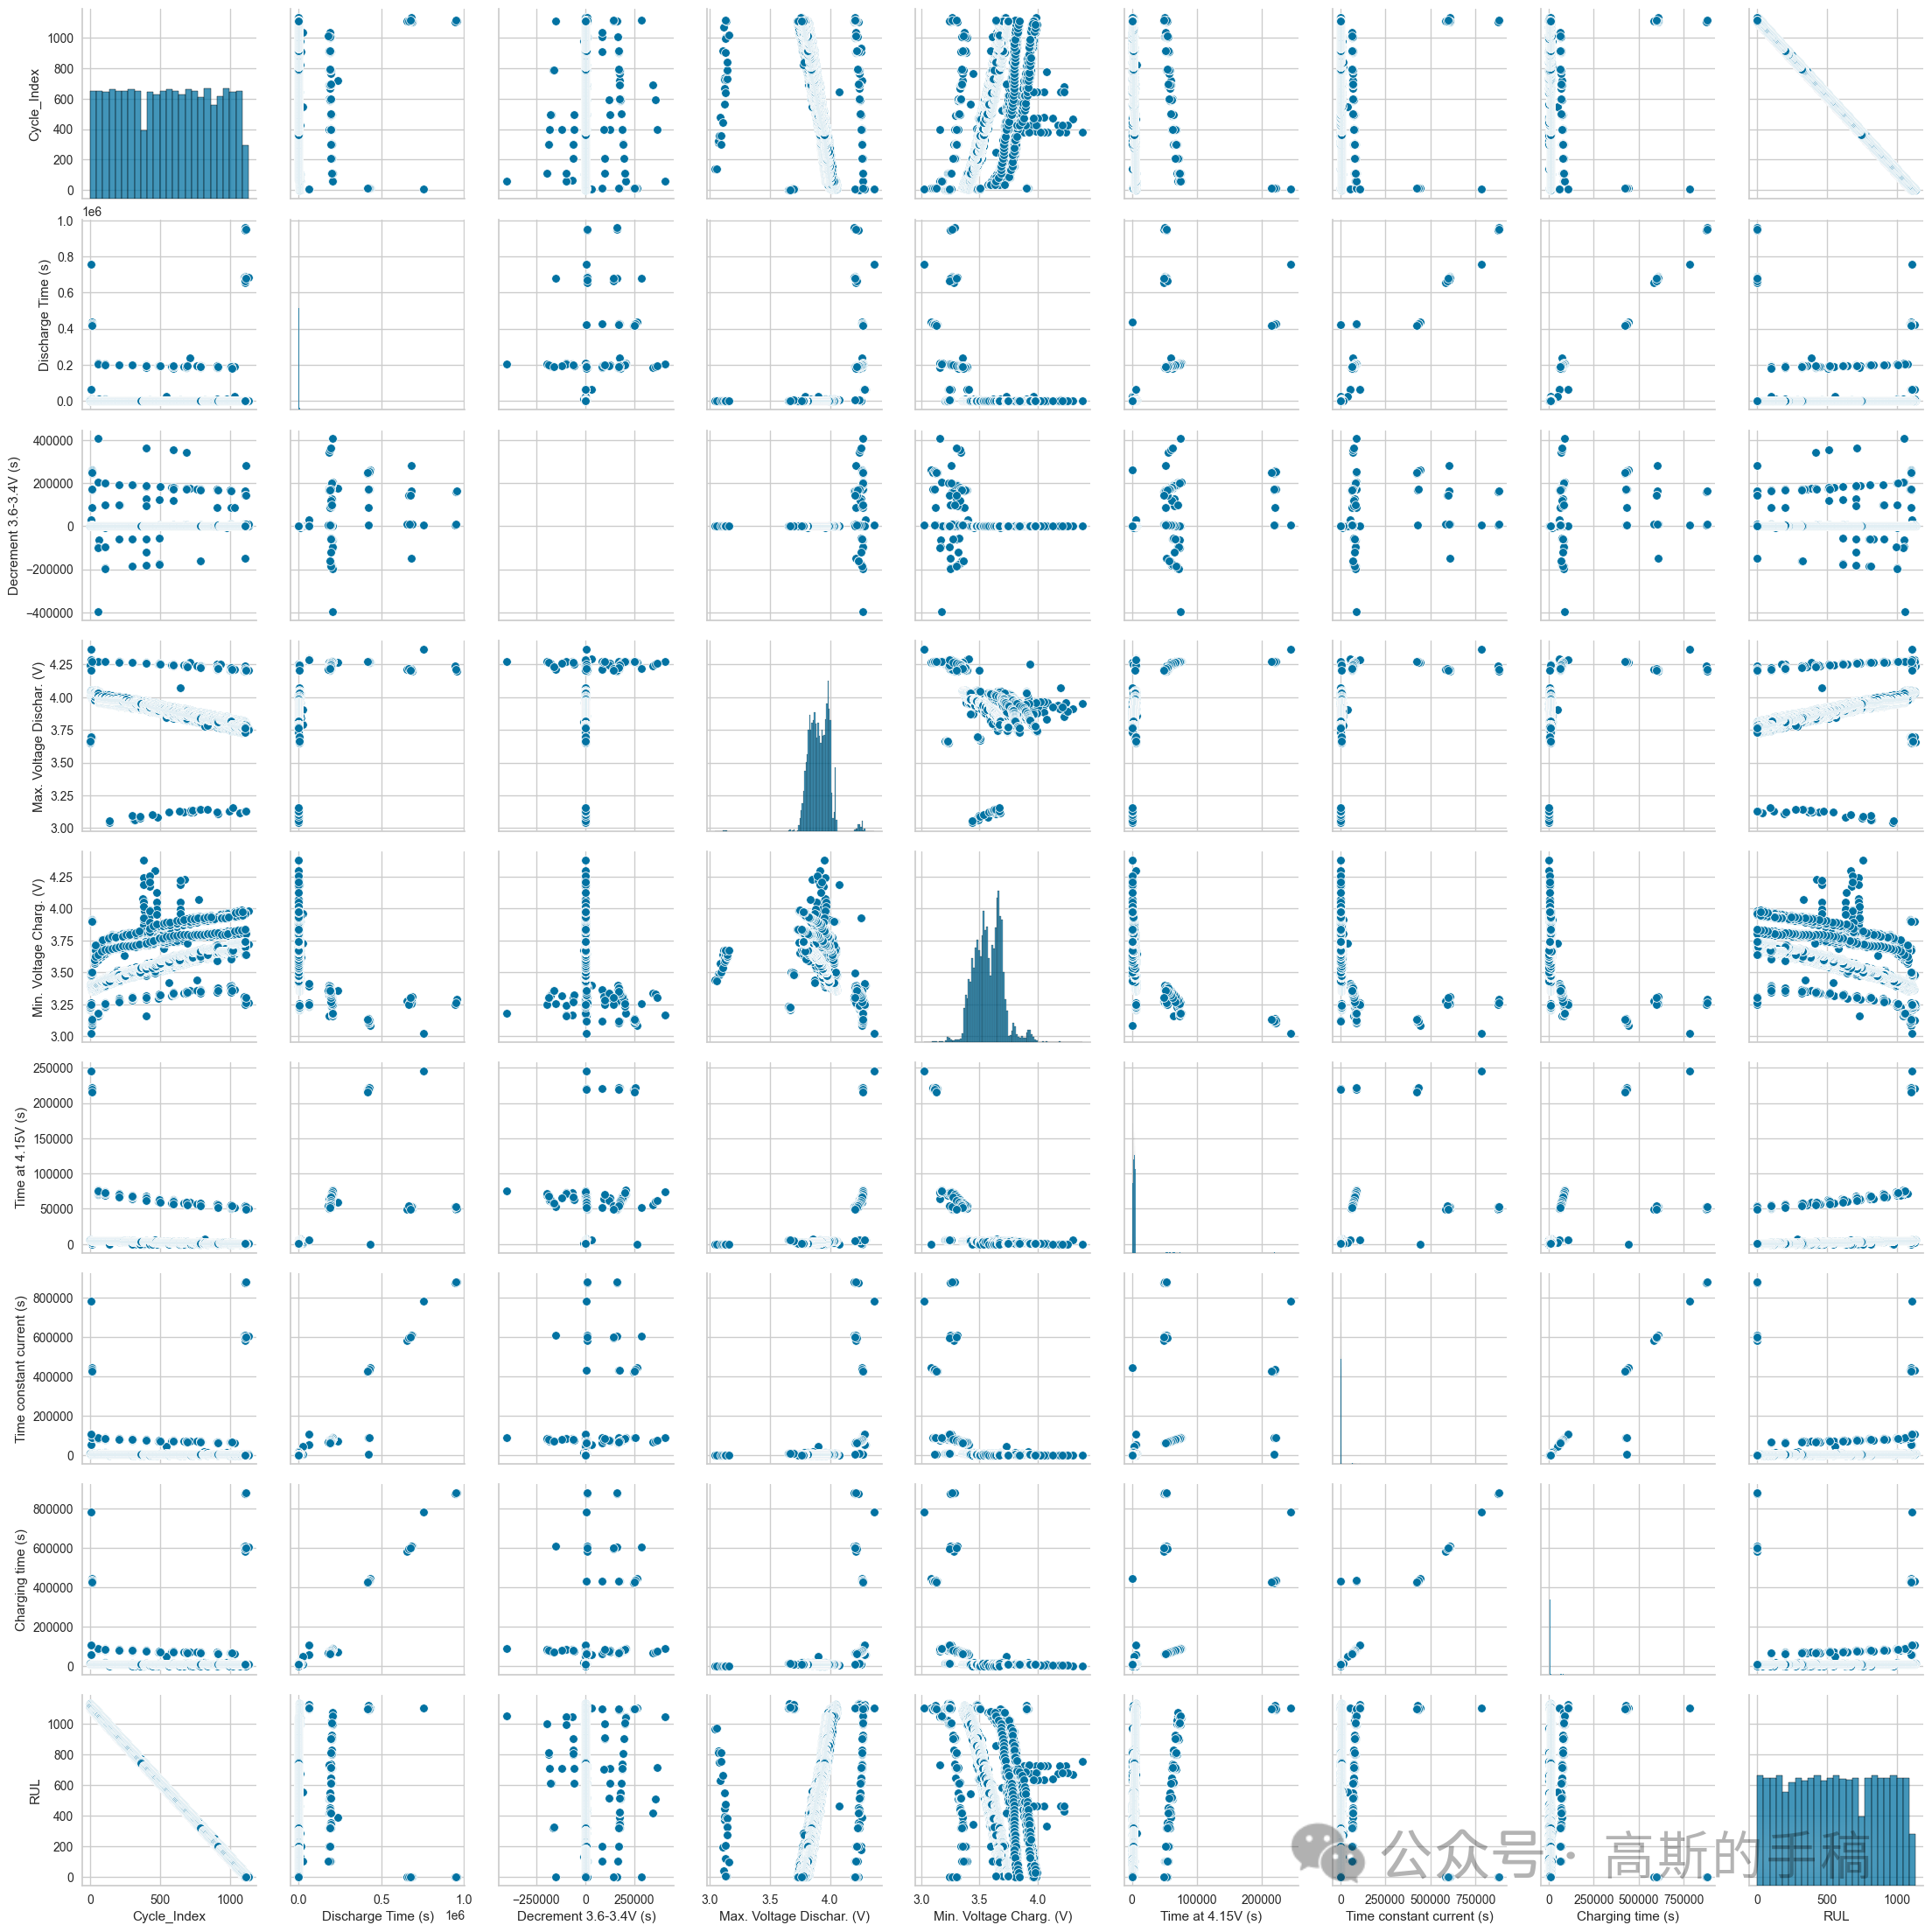
sns.pairplot(df)
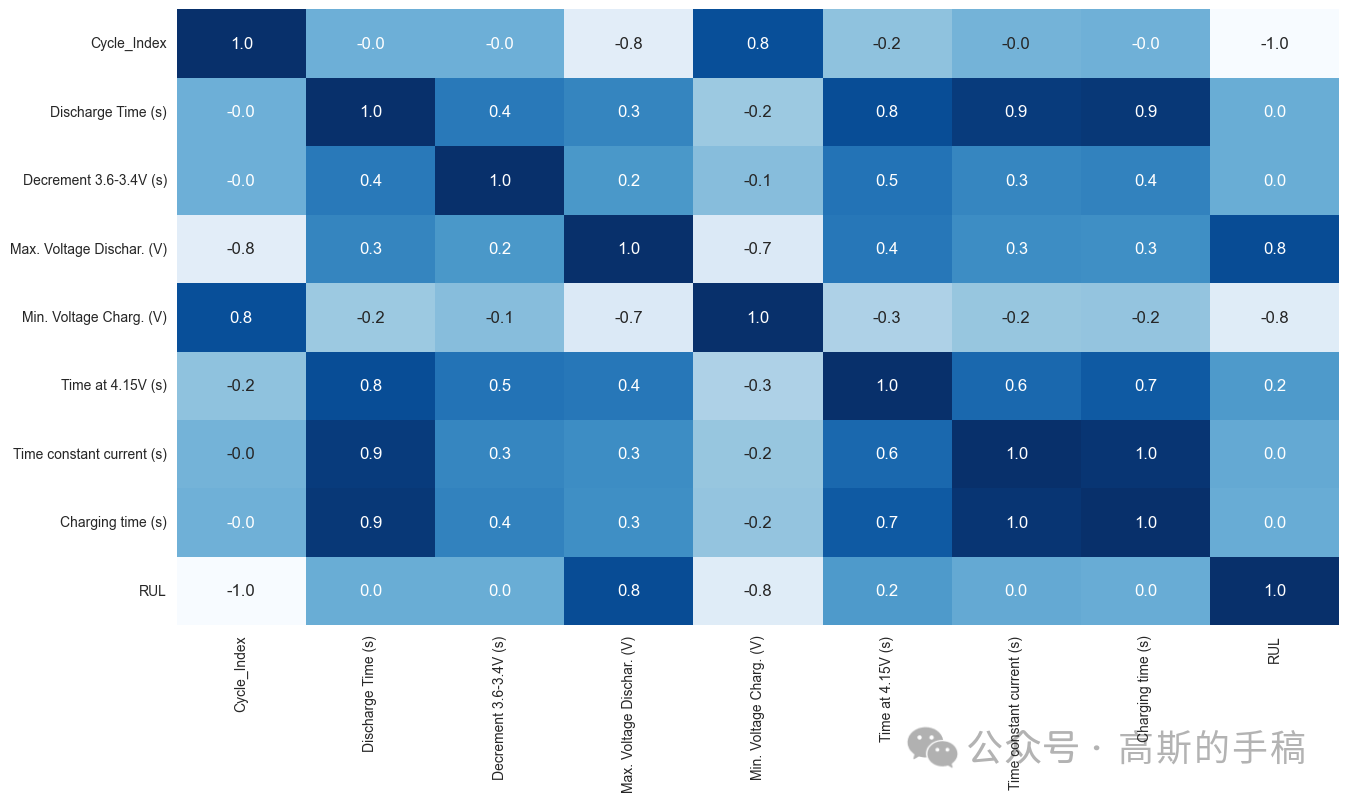
plt.figure(figsize = (15,8))sns.heatmap(df.corr(),annot=True, cbar=False, cmap='Blues', fmt='.1f')
df1=df.drop(['Cycle_Index','Discharge Time (s)', 'Decrement 3.6-3.4V (s)', 'Time constant current (s)','Charging time (s)'],axis=1)from pycaret.regression import *exp_reg = setup(df1, target = 'RUL',remove_outliers=True,session_id=1)
| Description | Value | |
|---|---|---|
| 0 | Session id | 1 |
| 1 | Target | RUL |
| 2 | Target type | Regression |
| 3 | Original data shape | (15064, 4) |
| 4 | Transformed data shape | (14536, 4) |
| 5 | Transformed train set shape | (10016, 4) |
| 6 | Transformed test set shape | (4520, 4) |
| 7 | Numeric features | 3 |
| 8 | Preprocess | True |
| 9 | Imputation type | simple |
| 10 | Numeric imputation | mean |
| 11 | Categorical imputation | mode |
| 12 | Remove outliers | True |
| 13 | Outliers threshold | 0.050000 |
| 14 | Fold Generator | KFold |
| 15 | Fold Number | 10 |
| 16 | CPU Jobs | -1 |
| 17 | Use GPU | False |
| 18 | Log Experiment | False |
| 19 | Experiment Name | reg-default-name |
| 20 | USI | dc44 |
compare_models()| Model | MAE | MSE | RMSE | R2 | RMSLE | MAPE | TT (Sec) | |
|---|---|---|---|---|---|---|---|---|
| et | Extra Trees Regressor | 21.7428 | 5805.6217 | 75.5050 | 0.9441 | 0.3375 | 0.2090 | 0.1840 |
| rf | Random Forest Regressor | 23.3808 | 6218.2462 | 78.2757 | 0.9402 | 0.3703 | 0.2286 | 0.2520 |
| xgboost | Extreme Gradient Boosting | 28.1191 | 6649.0490 | 80.7887 | 0.9360 | 0.3634 | 0.2583 | 0.1810 |
| lightgbm | Light Gradient Boosting Machine | 33.3121 | 6980.3989 | 82.9109 | 0.9328 | 0.3918 | 0.3013 | 0.1180 |
| dt | Decision Tree Regressor | 24.7941 | 7224.9013 | 84.4653 | 0.9305 | 0.4137 | 0.2263 | 0.0450 |
| gbr | Gradient Boosting Regressor | 41.4292 | 7696.6475 | 87.1895 | 0.9259 | 0.4326 | 0.3767 | 0.1220 |
| ada | AdaBoost Regressor | 53.8692 | 8601.3932 | 92.3123 | 0.9172 | 0.5116 | 0.5761 | 0.0830 |
| knn | K Neighbors Regressor | 47.6369 | 8847.0397 | 93.7257 | 0.9149 | 0.5202 | 0.3359 | 0.0500 |
| dummy | Dummy Regressor | 278.8523 | 104050.8450 | 322.5486 | -0.0008 | 1.0563 | 3.3094 | 0.0420 |
| lr | Linear Regression | 215.7580 | 3866029.7278 | 1866.2254 | -36.1340 | 0.6161 | 0.7615 | 0.2940 |
| lar | Least Angle Regression | 215.7595 | 3866065.5042 | 1866.2348 | -36.1343 | 0.6161 | 0.7614 | 0.0440 |
| ridge | Ridge Regression | 220.8640 | 4141461.0688 | 1930.9796 | -38.7797 | 0.6138 | 0.7712 | 0.0450 |
| par | Passive Aggressive Regressor | 268.5288 | 4193895.0303 | 1907.7742 | -39.3176 | 0.6897 | 0.9640 | 0.0470 |
| br | Bayesian Ridge | 232.6850 | 4716618.3836 | 2054.9328 | -44.3122 | 0.6308 | 0.8136 | 0.0430 |
| lasso | Lasso Regression | 233.8883 | 4790127.0360 | 2073.9986 | -45.0074 | 0.6325 | 0.8140 | 0.2320 |
| llar | Lasso Least Angle Regression | 233.8883 | 4790127.6230 | 2073.9987 | -45.0074 | 0.6325 | 0.8140 | 0.0460 |
| omp | Orthogonal Matching Pursuit | 233.8889 | 4790152.8777 | 2074.0042 | -45.0076 | 0.6324 | 0.8140 | 0.0340 |
| en | Elastic Net | 233.8890 | 4790175.9367 | 2074.0099 | -45.0078 | 0.6325 | 0.8140 | 0.0420 |
| huber | Huber Regressor | 235.3448 | 4915415.1237 | 2086.1153 | -46.1760 | 0.6331 | 0.8195 | 0.0460 |
ExtraTreesRegressor(n_jobs=-1, random_state=1)
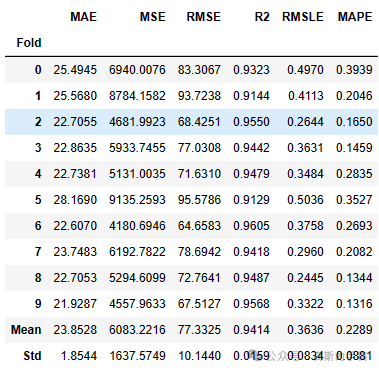
reg_model = create_model('et')
plot_model(reg_model,plot='error')
plot_model(reg_model,plot='residuals')
plot_model(reg_model,plot='feature')
xgb = create_model('xgboost',verbose=False)rf = create_model('rf', verbose = False)blend_specific = blend_models(estimator_list = [rf,xgb,reg_model])
工学博士,担任《Mechanical System and Signal Processing》《中国电机工程学报》《控制与决策》等期刊审稿专家,擅长领域:现代信号处理,机器学习,深度学习,数字孪生,时间序列分析,设备缺陷检测、设备异常检测、设备智能故障诊断与健康管理PHM等。