python实现泸定地震点观测平台制作
数据来自[走天涯徐小洋地理数据科学],原始数据来自微博@中国地震台网 的正式测定数据。
以下是地震点的数据:
| Magnitude | Date | Time | Longitude | Latitude | Depth |
|---|---|---|---|---|---|
| 6.8 | 2022-9-5 | 12:52 | 102.08 | 29.59 | 16 |
| 3.1 | 2022-9-6 | 5:28 | 102.07 | 29.64 | 11 |
| 3 | 2022-9-6 | 5:15 | 102.15 | 29.42 | 9 |
| 3.1 | 2022-9-6 | 1:24 | 102.17 | 29.39 | 16 |
| 3 | 2022-9-5 | 21:00 | 102.16 | 29.39 | 15 |
| 3.1 | 2022-9-5 | 13:03 | 102.04 | 29.61 | 9 |
| 4.2 | 2022-9-5 | 12:56 | 102.17 | 29.4 | 15 |
| 2.9 | 2022-9-5 | 13:10 | 102.14 | 29.46 | 10 |
| 2.8 | 2022-9-5 | 13:15 | 102.11 | 29.51 | 8 |
| 3.2 | 2022-9-5 | 13:28 | 102.06 | 29.58 | 12 |
| 2.9 | 2022-9-5 | 13:28 | 102.17 | 29.49 | 10 |
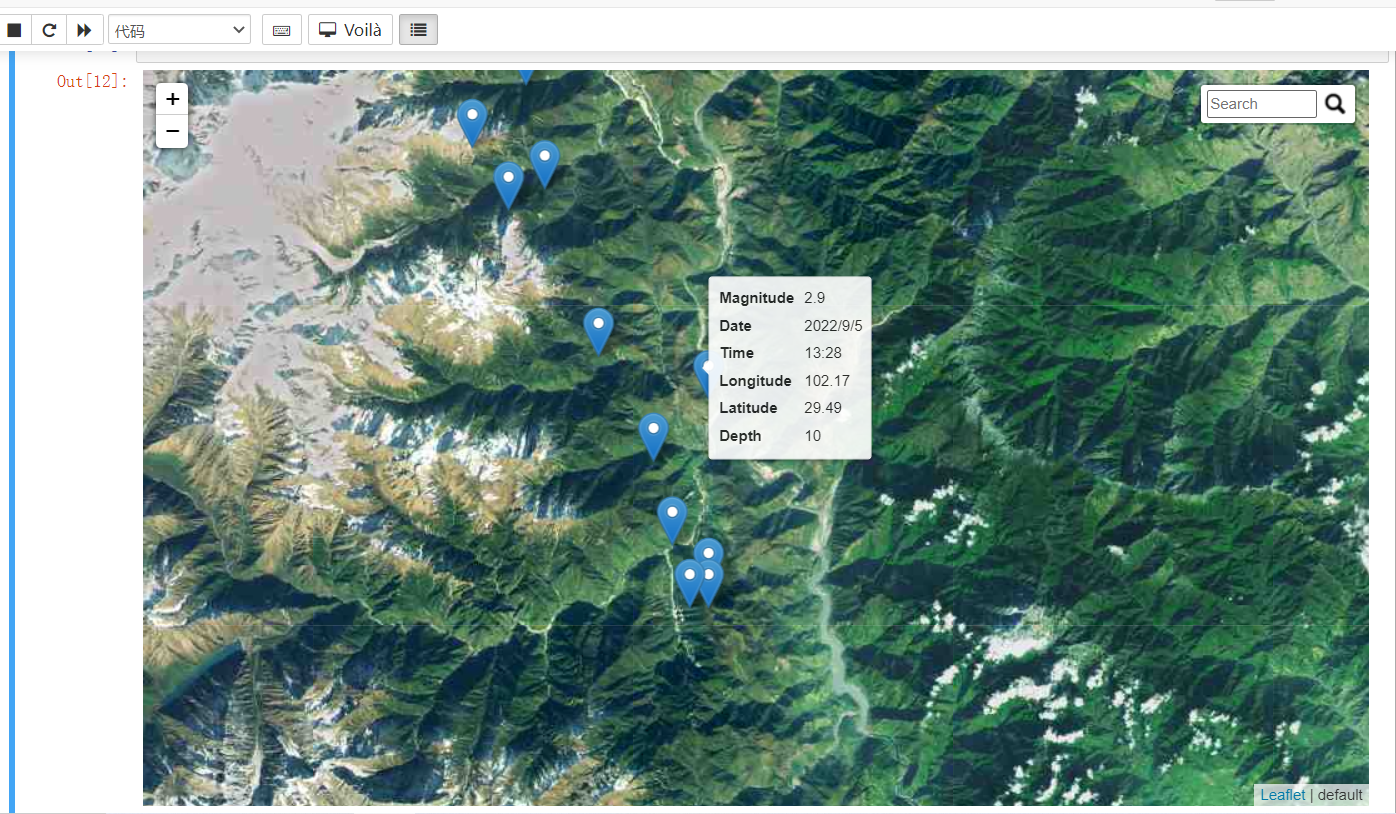
先来看看最终的效果:
直接上代码,这次是依赖于python的folium的地图包,folium是基于leaflet的经典js地图库,在python中重写使之能适用于python。
- 代码的主要原理是将面板文档转为geojson,之后导入
import json
import pandas as pd
import folium
from folium.plugins import MarkerCluster
from folium.plugins import Search
from folium import plugins
#选择待用的列
df4 = pd.read_csv('earthquake.csv')
useful_cols = ['Magnitude', 'Date', 'Time',  'Longitude', 'Latitude', 'Depth']
#将dataframe数据转换为 geojson数据
def df_to_geojson(df_json, properties, lat='Latitude', lng='Longitude'):
    geojson = {'type': 'FeatureCollection', 'features': []}

    # 遍历dataframe的每一行,并转换为json格式
    for _, row in df_json.iterrows():
        # create a feature template to fill in
        feature = {'type': 'Feature',
                   'properties': {},
                   'geometry': {'type': 'Point', 'coordinates': []}}

        # 填写坐标
        feature['geometry']['coordinates'] = [row[lng], row[lat]]

        # for each column, get the value and add it as a new feature property
        for prop in properties:
            feature['properties'][prop] = row[prop]

        # add this feature (aka, converted dataframe row) to the list of features inside our dict
        geojson['features'].append(feature)

    return geojson

geojson_dict = df_to_geojson(df4, properties=useful_cols)

# 添加站点
m = folium.Map(location=[29.57, 102.13],  zoom_start=8,
               tiles='http://webst02.is.autonavi.com/appmaptile?style=6&x={x}&y={y}&z={z}', attr='default')
geojson_obj = folium.GeoJson(geojson_dict, name='FLUX', show=False,
                             tooltip=folium.GeoJsonTooltip(
                                 fields=['Magnitude', 'Date', 'Time',  'Longitude', 'Latitude', 'Depth'],
                                 localize=True)
                             ).add_to(m)

# 搜索框
factorysearch = folium.plugins.Search(layer=geojson_obj,
                       geom_type='Point',
                       placeholder="Search",
                       collapsed=False,
                       search_label='Date',
                       search_zoom=14,
                       position='topright'
).add_to(m)

# location function
folium.LatLngPopup().add_to(m)
- 上述代码添加了高德的影像底图,可更换其它源,如百度地图
- .LatLngPopup()方法用于在地图上点按能显示经纬度,可以不添加
- 搜索框功能锦上添花,数据较少时可以不用
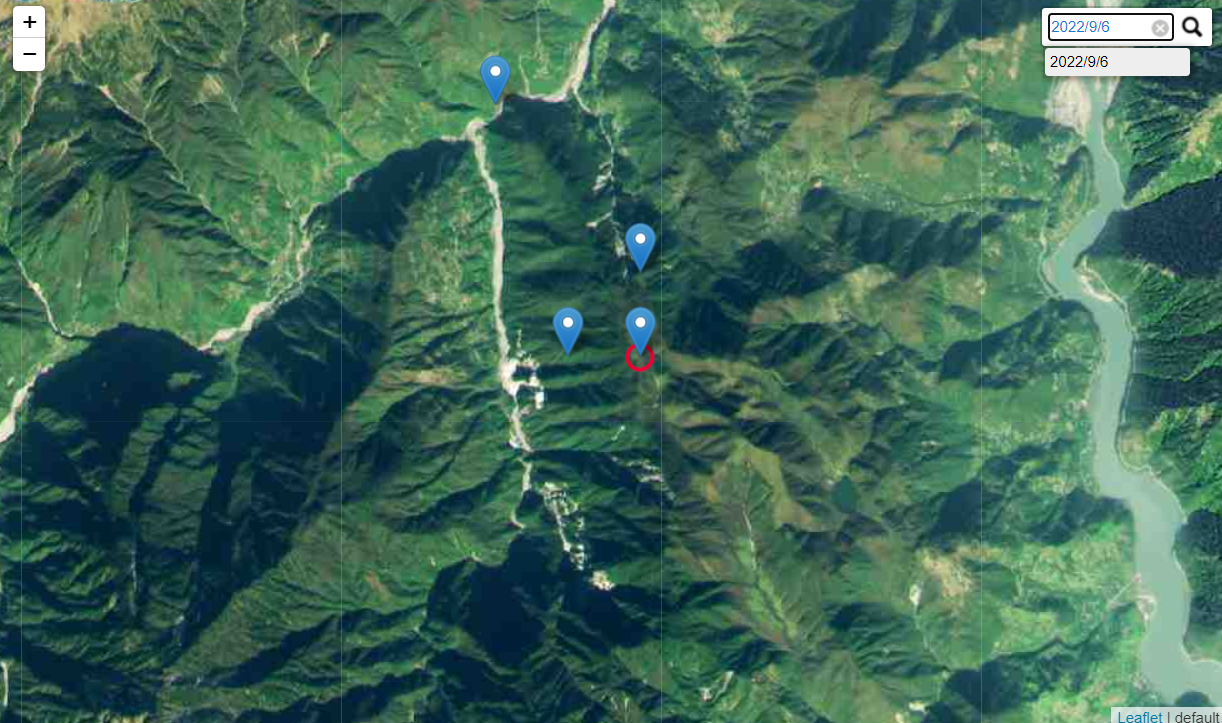
最终效果,并能够实现对站点的简单查询:
图
- .LatLngPopup()方法用于在地图上点按能显示经纬度,可以不添加
- 搜索框功能锦上添花,数据较少时可以不用
最终效果,并能够实现对站点的简单查询:
![[附源码]java毕业设计览宏公司会议管理系统](https://img-blog.csdnimg.cn/c20d63dbc61440acaddbf1a478550b7a.png)

![[附源码]java毕业设计企业人力资源管理系统](https://img-blog.csdnimg.cn/5ef38829087847fb918508af39d32322.png)


![[附源码]SSM计算机毕业设计作业自动评阅系统JAVA](https://img-blog.csdnimg.cn/88c1daf617d04992be4583f51c5784e7.png)