import matplotlib.pyplot as plt
# 数据
categories = ['A', 'B', 'C', 'D']
values = [23, 45, 56, 78]
# 创建柱状图
plt.bar(categories, values)
# 添加标题和标签
plt.title('柱状图示例')
plt.xlabel('类别')
plt.ylabel('数值')
# 显示图形
plt.show()
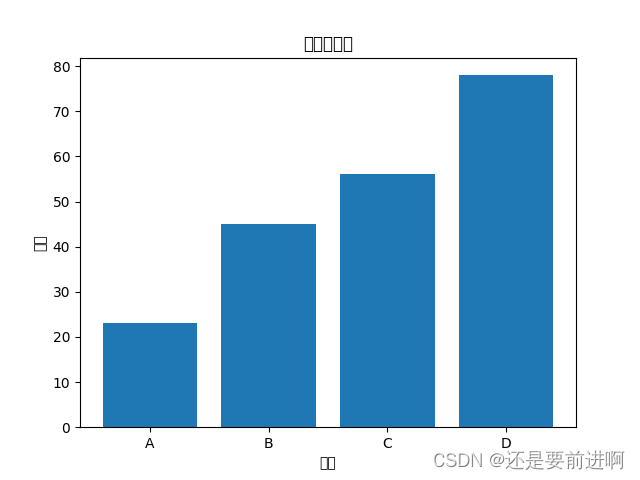
D:\software\新建文件夹\python\Lib\tkinter\__init__.py:861: UserWarning: Glyph 25968 (\N{CJK UNIFIED IDEOGRAPH-6570}) missing from current font.
func(*args)
出现报错,字体不可用,我们可以看到,设置的题目和x轴y轴的名称没有出现。这时候,我们就要解决问题。
import matplotlib.pyplot as plt
from matplotlib.font_manager import FontProperties

# 设置新宋体字体的路径
font_path = 'D:/reportlab/simsun/simsun.ttf'

# 加载新宋体字体
prop = FontProperties(fname=font_path)

# 数据
categories = ['A', 'B', 'C', 'D']
values = [23, 45, 56, 78]

# 创建柱状图
plt.bar(categories, values)

# 添加标题和标签,并使用新宋体字体
plt.title('柱状图示例', fontproperties=prop)
plt.xlabel('类别', fontproperties=prop)
plt.ylabel('数值', fontproperties=prop)

# 设置刻度字体
plt.xticks(fontproperties=prop)
plt.yticks(fontproperties=prop)

# 显示图形
plt.show()

我们设置了宋体,作为图片文字的字体。如何下载宋体,详见python:reportlab 生成pdf:基本用法。-CSDN博客
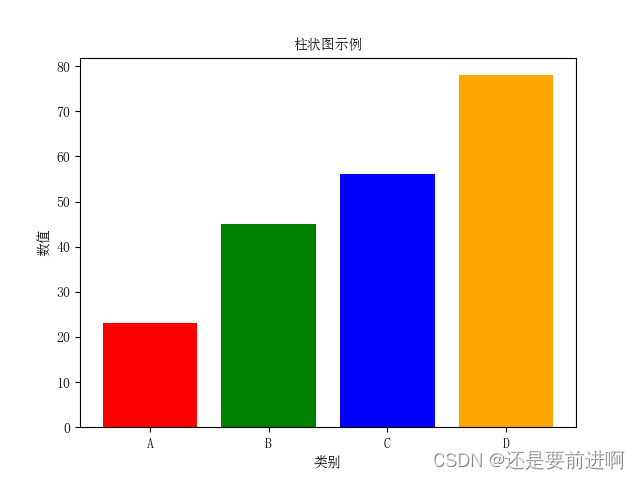
可我想要图片设置成不同的颜色,该如何是好
import matplotlib.pyplot as plt
from matplotlib.font_manager import FontProperties

# 设置新宋体字体的路径
font_path = 'D:/reportlab/simsun/simsun.ttf'

# 加载新宋体字体
prop = FontProperties(fname=font_path)

# 数据
categories = ['A', 'B', 'C', 'D']
values = [23, 45, 56, 78]

# 创建柱状图,并设置颜色
plt.bar(categories, values, color=['red', 'green', 'blue', 'orange'])

# 添加标题和标签,并使用新宋体字体
plt.title('柱状图示例', fontproperties=prop)
plt.xlabel('类别', fontproperties=prop)
plt.ylabel('数值', fontproperties=prop)

# 设置刻度字体
plt.xticks(fontproperties=prop)
plt.yticks(fontproperties=prop)

# 显示图形
plt.show()
import pandas as pd
import matplotlib.pyplot as plt
from matplotlib.font_manager import FontProperties

# 设置新宋体字体的路径
font_path = 'D:/reportlab/simsun/simsun.ttf'

# 加载新宋体字体
prop = FontProperties(fname=font_path)
# 读取 xlsx 文件
df = pd.read_excel('your_excel_file.xlsx')

# 假设 xlsx 文件包含两列,一列是类别,一列是数值
categories = df['Category'].tolist()
values = df['Value'].tolist()

# 创建柱状图,并设置颜色

plt.bar(categories, values, color=['red', 'green', 'blue', 'orange'])#颜色可以增加。
# 添加标题和标签,并使用新宋体字体

plt.title('柱状图示例', fontproperties=prop)
plt.xlabel('类别', fontproperties=prop)
plt.ylabel('数值', fontproperties=prop)

# 设置刻度字体
plt.xticks(fontproperties=prop)
plt.yticks(fontproperties=prop)

# 显示图形
plt.show()
![[淘宝销量]—采集分析—实例参考▶](https://img-blog.csdnimg.cn/direct/978115f9407f4f8a9c4a1601e2967c9d.gif)


![[华为OD] B卷 树状结构查询 200](https://img-blog.csdnimg.cn/direct/2b90720440444b5d82451cf5898ea1d3.png)

![[C/C++] -- DFS搜索迷宫路径](https://img-blog.csdnimg.cn/direct/07288dddba6346efb3fc57bf2ce7dddf.png)