echarts如何画立体柱状图
- 一、创建盒子
- 1、创建盒子
- 2、初始化盒子(先绘制一个基本的二维柱状图的样式)
- 1、创建一个初始化图表的方法
- 2、在mounted中调用这个方法
- 3、在方法中写options和绘制图形
- 二、画图前知识
- 1、坐标
- 2、柱状图图解分析
- 三、构建方法
- 1、创建一个用来绘制形状的方法,drawShape
- 2、完善drawShape方法
- 1、完善 leftShape 形状逻辑:
- 2、完善 rightShape 形状逻辑
- 3、完善 topShape 形状逻辑
- 3、修改initChart方法
- 1、修改series
- 四、效果图
一、创建盒子
1、创建盒子
这是图形盒子和样式。
<template>
  <div class="MonitoringSensor">
    <div id="main"></div>
  </div>
</template>
<style scoped>
.MonitoringSensor {
  width: 500px;
  height: 500px;

  margin: 0 auto;
  background: rgb(24, 80, 169)
}

#main {

  height: 100%;
  width: 100%;
}
</style>
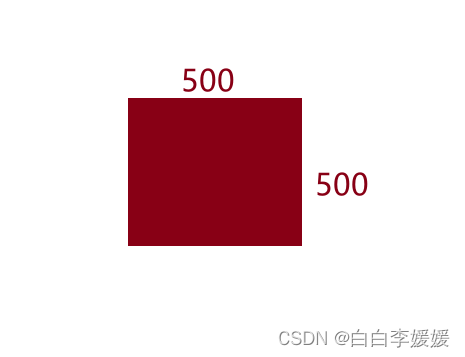
这一步做完页面中间会有一个蓝色的盒子,如下

2、初始化盒子(先绘制一个基本的二维柱状图的样式)
1、创建一个初始化图表的方法
  methods:{
     initChart () {}
   }
2、在mounted中调用这个方法
  mounted () {
    this.initChart()
  },
3、在方法中写options和绘制图形
注意:记得导入echarts,否则无法构建图表。
import * as echarts from 'echarts'
data () {
    return {
      chart: null
    }
  },
initChart () {
      this.chart = echarts.init(document.getElementById('main'));
      let options = null;
      options = {
        xAxis: {
          type: "category",
          data: ["苹果", "梨子", "香蕉"],
          axisLabel: {
            color: "#fff",
          },
        },

        yAxis: {
          type: "value",
          max: 200,
          axisLabel: {
            color: "#fff",
          },
          splitLine: {
            lineStyle: {
              color: "#222",
            },
          },
        },
        tooltip: {
          trigger: "axis",
        },
        series: [
          {
            type: "bar",
            data: [100, 50, 20],
            barWidth: 30,
          },
        ],
      };
      options && this.chart.setOption(options);
    },
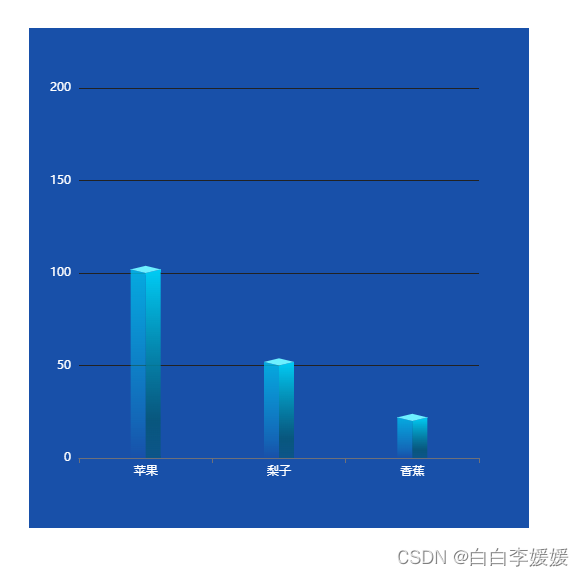
到这个时候,能看到页面有一个基本的柱状图的样子了,如下图:

二、画图前知识
1、坐标
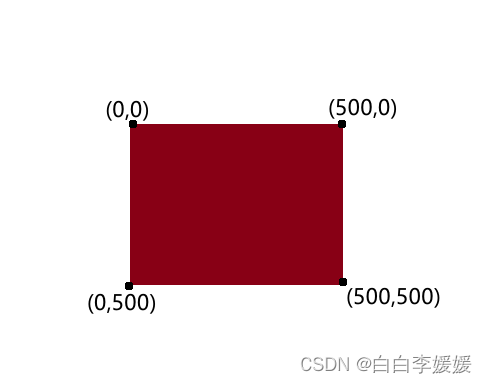
echarts中的坐标是跟着图例盒子大小来的,比如我这个main盒子是设置了500*500大小
那么坐标是怎么看的,那么左上角的话就是(0,0),右上角就是(500,0),左下角就是(0,500),右下角就是(500,500),相当于右边是X轴正轴,往下看是Y轴正轴
2、柱状图图解分析
图1:

图2:

根据图1和坐标知识可知:

左侧面的坐标信息为:
P1:【基础X轴坐标点-侧面宽度,顶部Y轴坐标点-斜角高度】
P2:【基础X轴坐标点-侧面宽度,底部Y轴坐标点】
P3:【基础X轴坐标点,底部Y轴坐标点】
P4:【基础X轴坐标点,顶部Y轴坐标点】
根据图2和坐标知识可得:
右侧面的坐标信息为
P1:【基础X轴坐标点,顶部Y轴坐标点】
P2:【基础X轴坐标点,底部Y轴坐标点】
P3:【基础X轴坐标点 +侧面宽度 ,底部Y轴坐标点】
P4:【基础X轴坐标点 +侧面宽度,顶部Y轴坐标点 - 斜角高度】

根据图2和坐标知识可得:
顶面的坐标信息为
P1:【基础X轴坐标点,顶部Y轴坐标点】
P2:【基础X轴坐标点+侧面宽度,顶部Y轴坐标点- 斜角高度】
P3:【基础X轴坐标点 ,顶部Y轴坐标点- 斜角高度*2】
P4:【基础X轴坐标点 -侧面宽度,顶部Y轴坐标点 - 斜角高度】

三、构建方法
1、创建一个用来绘制形状的方法,drawShape
这个方法里面先创建三个形状的空壳子,并注册,如下图,并且注册完成以后在这个方法里面调用构建图表的方法initChart,在初始化页面的时候就不用调用initChart方法了
 mounted () {
    this.drawShape()
  },
 drawShape () {
      const leftShape = echarts.graphic.extendShape({
        buildPath (ctx, shape) { },
      });

      const rightShape = echarts.graphic.extendShape({
        buildPath (ctx, shape) { },
      });

      const topShape = echarts.graphic.extendShape({
        buildPath (ctx, shape) { },
      });

      echarts.graphic.registerShape("leftShape", leftShape);
      echarts.graphic.registerShape("rightShape", rightShape);
      echarts.graphic.registerShape("topShape", topShape);
      this.initChart()
    },
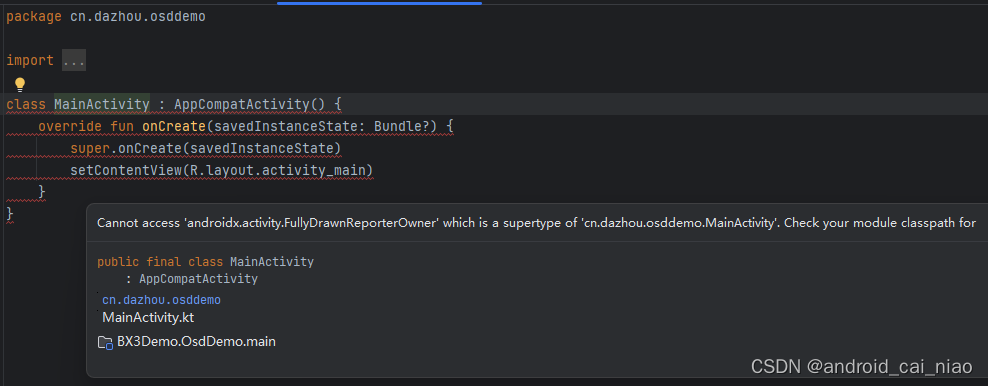
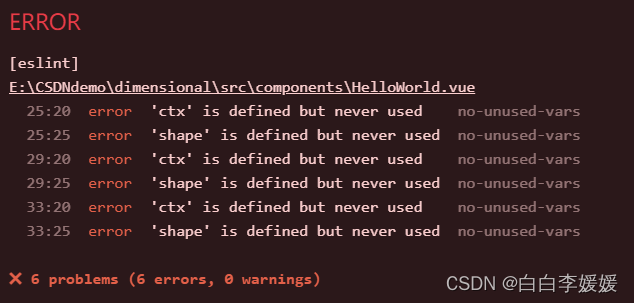
到这一步会报错,因为方法中的ctx和shape没引用,是正常现象,到后面这两个参数使用了以后就不报错了。报错如下图所示,暂时可以不用管
2、完善drawShape方法
1、完善 leftShape 形状逻辑:
 const leftShape = echarts.graphic.extendShape({
        buildPath (ctx, shape) {
          const { topBasicsYAxis, bottomYAxis, basicsXAxis } = shape;
          // 侧面宽度
          const WIDTH = 15;
          // 斜角高度
          const OBLIQUE_ANGLE_HEIGHT = 3.6;

          const p1 = [basicsXAxis - WIDTH, topBasicsYAxis - OBLIQUE_ANGLE_HEIGHT];
          const p2 = [basicsXAxis - WIDTH, bottomYAxis];
          const p3 = [basicsXAxis, bottomYAxis];
          const p4 = [basicsXAxis, topBasicsYAxis];

          ctx.moveTo(p1[0], p1[1]);
          ctx.lineTo(p2[0], p2[1]);
          ctx.lineTo(p3[0], p3[1]);
          ctx.lineTo(p4[0], p4[1]);
        },

      });
2、完善 rightShape 形状逻辑
const rightShape = echarts.graphic.extendShape({
        buildPath (ctx, shape) {
          const { topBasicsYAxis, bottomYAxis, basicsXAxis } = shape;
          // 侧面宽度
          const WIDTH = 15;
          // 斜角高度
          const OBLIQUE_ANGLE_HEIGHT = 3.6;

          const p1 = [basicsXAxis, topBasicsYAxis];
          const p2 = [basicsXAxis, bottomYAxis];
          const p3 = [basicsXAxis + WIDTH, bottomYAxis];
          const p4 = [basicsXAxis + WIDTH, topBasicsYAxis - OBLIQUE_ANGLE_HEIGHT];

          ctx.moveTo(p1[0], p1[1]);
          ctx.lineTo(p2[0], p2[1]);
          ctx.lineTo(p3[0], p3[1]);
          ctx.lineTo(p4[0], p4[1]);
        },
      });
3、完善 topShape 形状逻辑
  const topShape = echarts.graphic.extendShape({
        buildPath (ctx, shape) {
          const { topBasicsYAxis, basicsXAxis } = shape;
          // 侧面宽度
          const WIDTH = 15;
          // 斜角高度
          const OBLIQUE_ANGLE_HEIGHT = 3.6;

          const p1 = [basicsXAxis, topBasicsYAxis];
          const p2 = [basicsXAxis + WIDTH, topBasicsYAxis - OBLIQUE_ANGLE_HEIGHT];
          const p3 = [basicsXAxis, topBasicsYAxis - OBLIQUE_ANGLE_HEIGHT * 2];
          const p4 = [basicsXAxis - WIDTH, topBasicsYAxis - OBLIQUE_ANGLE_HEIGHT];

          ctx.moveTo(p1[0], p1[1]);
          ctx.lineTo(p2[0], p2[1]);
          ctx.lineTo(p3[0], p3[1]);
          ctx.lineTo(p4[0], p4[1]);
        },
      });
3、修改initChart方法
1、修改series
1、这个时候的series的type就不能是‘bar’了,因为是自定义形状,所以需要将type设置为custom,并且需要设置一个renderItem函数,用来设置数据
 series: [
          {
            type: "custom",
            data: [100, 50, 20],
            barWidth: 30,
            renderItem () { }
          },
        ],
2、设置renderItem函数
根据官网提示,需要返回一个type为group的对象,并且将三个面都加到children里面,如下图,
type:是drawShape方法中定义的每个面的名字,
shape里面就是drawShape方法中定义的每个面的名字,每个面都需要加进去,
style中是柱子的颜色,我是用了渐变色,可以更换为自己喜欢的颜色
 series: [
          {
            type: "custom",
            data: [100, 50, 20],
            barWidth: 30,
            renderItem (params, api) {
              // 基础坐标
              const basicsCoord = api.coord([api.value(0), api.value(1)]);
              // 顶部基础 y 轴
              const topBasicsYAxis = basicsCoord[1];
              // 基础 x 轴
              const basicsXAxis = basicsCoord[0];
              // 底部 y 轴
              const bottomYAxis = api.coord([api.value(0), 0])[1];
              return {
                type: "group",
                children: [
                  {
                    type: "leftShape",
                    shape: {
                      topBasicsYAxis,
                      basicsXAxis,
                      bottomYAxis,
                    },
                    style: {
                      fill: new echarts.graphic.LinearGradient(0, 0, 0, 1, [
                        {
                          offset: 0,
                          color: 'rgb(0, 192, 238,0.8)',
                        },

                        {
                          offset: 0.8,
                          color: 'rgb(0, 194, 239,0.2)',
                        },
                        {
                          offset: 1,
                          color: 'rgb(0, 194, 239,0)',
                        },
                      ]),
                      emphasis: {
                        fill: 'yellow', // 鼠标高亮时的填充颜色
                      },
                    },
                  },
                  {
                    type: "rightShape",
                    shape: {
                      topBasicsYAxis,
                      basicsXAxis,
                      bottomYAxis,
                    },
                    style: {
                      fill: new echarts.graphic.LinearGradient(0, 0, 0, 1, [
                        {
                          offset: 0,
                          color: '#00CCF5 ',
                        },

                        {
                          offset: 0.8,
                          color: 'rgb(4, 88, 115,0.8)',
                        },
                        {
                          offset: 1,
                          color: 'rgb(4, 88, 115,0.6)',
                        },
                      ]),
                    },
                  },
                  {
                    type: "topShape",
                    shape: {
                      topBasicsYAxis,
                      basicsXAxis,
                      bottomYAxis,
                    },
                    style: {
                      fill: new echarts.graphic.LinearGradient(0, 0, 0, 1, [
                        {
                          offset: 0.3,
                          color: '#6DF0FF',
                        },
                        {
                          offset: 1,
                          color: '#6DF0FF',
                        },
                      ]),
                    },
                  },
                ],
              };
            }
          },
        ],
到这一步,就应该能看到立体柱状图了,如标题四效果图所示
四、效果图
效果如下所示