react中实现拓扑图关系图
- 需求
- echarts代码
- react代码
需求
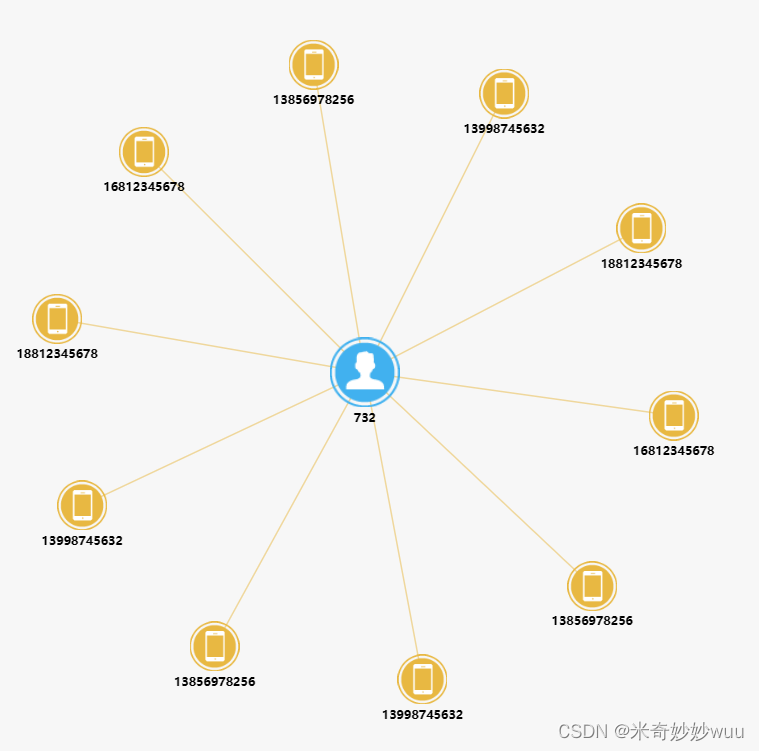
项目中的原型图需要使用react实现一个拓扑图(关系图)
通过查找,找到了可以使用的类似的原型:以下图片地址。
通过项目需要以及修改,形成了下边的样式
echarts代码
// 调试页面回打印出点击的节点名称
var size = 50; //节点大小


var listdata = [];
var links = [];
var legendes = ["手机IMSI", "人脸ID", "车牌号码", "人脸ID"];
var texts = [];


var phoneNum = {
    "手机号:13856978256": "13856978256",
    "手机号:13998745632": "13998745632",
    "手机号:18812345678": "18812345678",
    "手机号:16812345678": "16812345678",
    "手机号:13856971111": "13856978256",
    "手机号:13998742222": "13998745632",
    "手机号:18812344444": "18812345678",
    "手机号:16812343333": "16812345678",
    "手机号:13878978256": "13856978256",
    "手机号:137895632": "13998745632",
};

var phoneIMSI =["", "", "","", "", "","", "", "", "" ]

var mainRelationShip = {
    人脸ID: "732"
}

function setDataPerson(json, n) {
    var i = 0;
    for (var p in json) {
        listdata.push({
            x: 50,
            y: 100,
            "name": p,
            "showName": json[p],
            "symbol":'image://'+"/asset/get/s/data-1561621393298-zQTG-TuDS.png",
            "symbolSize": 70,
            "category": n,
            "draggable": "false",
            formatter: function(params) {
                return params.data.showName
            },
            label:{
                position: 'bottom'
            }
        });
        i++;
    }
}
function setDataPhone(json, n) {
    var i = 0;
    for (var p in json) {
        listdata.push({
            x: i * 50,
            y: size + i * 10,
            "name": p,
            "showName": json[p],
            "symbol":'image://'+"/asset/get/s/data-1561621386236-0IGCc48l6.png",
            "symbolSize": size,
            "category": n,
            "draggable": "false",
            formatter: function(params) {
                return params.data.showName
            },
            label:{
                position: 'bottom'
            }
        });
        i++;
    }
}
function setDataCar(json, n) {
    var i = 0;
    for (var p in json) {
        listdata.push({
            x: i * 50,
            y: size + i * 10,
            "name": p,
            "showName": json[p],
            "symbol":'image://'+"/asset/get/s/data-1561621379686-rZHoryrBV.png",
            "symbolSize": size,
            "category": n,
            "draggable": "false",
            formatter: function(params) {
                return params.data.showName
            },
            label:{
                position: 'bottom'
            }
        });
        i++;
    }
}

function setLinkData(json, relarr, title) {
    if (relarr !== "") {
        var i = 0;
        for (var p in json) {
            links.push({
                "source": p,
                "target": title,
                "value": relarr[i],
                lineStyle: {
                    normal: {
                        // text: relarr[i],
                        color: 'source'
                    }
                }
            });
            i++;
        }
    } else {
        for (var p2 in json) {
            links.push({
                "source": p2,
                "target": title,
                "value": "",
                lineStyle: {
                    normal: {
                        color: 'source'
                    }
                }
            });
        }
    }
}

for (var i = 0; i < legendes.length; i++) {
    texts.push({
        "name": legendes[i]
    })
}

setDataPhone(phoneNum, 0);

setDataPerson(mainRelationShip, 3);

setLinkData(phoneNum, phoneIMSI, legendes[3]);

option = {
    backgroundColor: '#f7f7f7',
    tooltip: {
        formatter: '{b}'
    },
    series: [{
        type: 'graph',
        layout: 'force',
        force: {
            repulsion: 80,
            gravity: 0,
            edgeLength: 150,
            layoutAnimation: false,
        },
        data: listdata,
        links: links,
        categories: texts,
        roam: false,
        nodeScaleRatio: 0,
        focusNodeAdjacency: false,
        lineStyle: {
            normal: {
                opacity: 0.5,
                width: 1.5,
                curveness: 0
            }
        },
        label: {
            normal: {
                show: true,
                position: 'inside',
                textStyle: {
                    color: '#000000',
                    fontWeight: 'normal',
                    fontSize: "12" //字体大小
                },
                formatter: function(params) {
                    return params.data.showName
                },
                fontSize: 18,
                fontStyle: '600',
            }
        },
        edgeLabel: {
            normal: {
                show: true,
                textStyle: {
                    fontSize: 12
                },
                formatter: "{c}"
            }
        }
    }],
    color: ['#e8b842', '#41b1ef', '#667aed', '#347fbb', '#772cdc',
            '#ff69b4', '#ba55d3', '#cd5c5c', '#ffa500', '#40e0d0']
};

const clickFun = param => {
    console.log(param.name)
}
myChart.on("click", clickFun);
react代码
在react中使用时遇到了一个异步的问题,通过componentDidUpdate监听了数据的更新变化
import React, { PureComponent } from 'react';
import './index.less';
import * as echarts from 'echarts';
class RelationEcharts extends PureComponent {
	constructor(props) {
		super(props);
		this.chartRef = React.createRef();
		this.state = {
			//在这里存放对应数据
			//数据类型是一个对象,需要做相应的转化展示到页面对应的位置
		}
	}
	componentDidMount() {
		this.init();  //发送异步请求,并在请求成功后更新状态
	};
	componentDidUpdate(prevProps, prevState) {
		if (prevState.floorName !== this.state.floorName) {
			this.initChart(); //检查更新操作
		}
	}
	init() {
		//在这里发送异步请求
	}
	initChart() {
		//在这里引入echarts的配置
	}
	render() {
		return (
			<div ref={this.chartRef} style={{ width: '100%', height: '80%', paddingLeft: '20%' }}></div>
		);
	}
}

export default RelationEcharts ;
![[算法与数据结构][c++][python]:C++与Python中的赋值、浅拷贝与深拷贝](https://img-blog.csdnimg.cn/img_convert/b738c28f6b2531e40f980cef0742b6ee.png)


![[足式机器人]Part2 Dr. CAN学习笔记 - Ch02动态系统建模与分析](https://img-blog.csdnimg.cn/direct/630219cc3a314904ba754366a8add31b.png#pic_center)