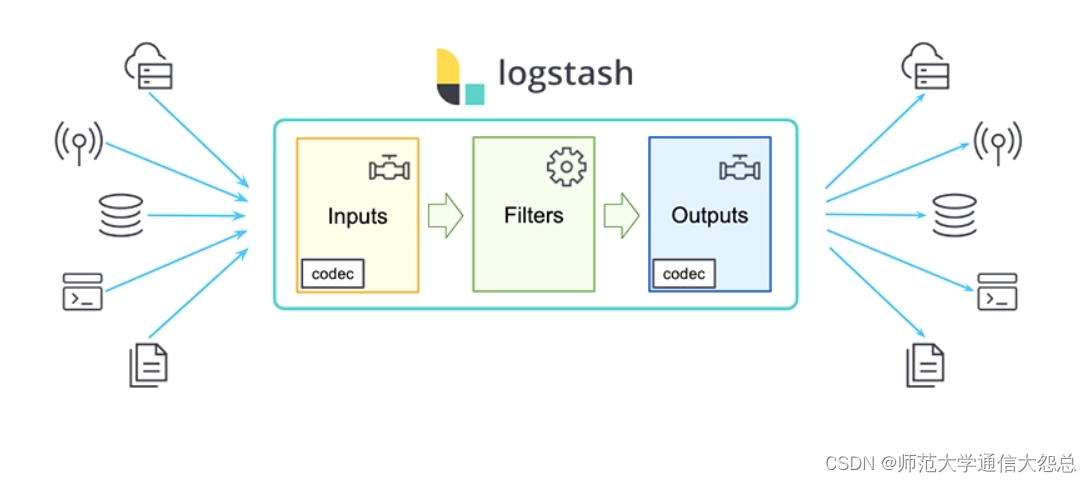
logstash插件
输入插件(input)
Input:输入插件。
Input plugins | Logstash Reference [8.11] | Elastic
-
所有输入插件都支持的配置选项
| Setting | Input type | Required | Default | Description |
|---|---|---|---|---|
| add_field | hash | No | {} | 添加一个字段到一个事件 |
| codec | codec | No | plain | 用于输入数据的编解码器 |
| enable_metric | boolean | No | true | |
| id | string | No | 添加一个ID插件配置,如果没有指定ID,则Logstash将生成一个ID。强烈建议配置此ID,当两个或多个相同类型的插件时,这个非常有用的。例如,有两个文件输入,添加命名标识有助于监视 | |
| tags | array | No | 添加任意数量的标签,有助于后期处理 | |
| type | string | No | 为输入处理的所有事件添加一个字段,自已随便定义,比如linux系统日志,定义为syslog |
stdin
-
标准输入
# cat /etc/logstash/config.d/stdtest.conf
input {
stdin {
}
}
filter {
}
output {
stdout {
}
}
file
-
从文件中读取内容
File input plugin | Logstash Reference [8.11] | Elastic
| Setting | Input type | Required | Default | Description |
|---|---|---|---|---|
| close_older | number | No | 3600 | 单位秒,打开文件多长时间关闭 |
| delimiter | string | No | \n | 每行分隔符 |
| discover_interval | number | No | 15 | 单位秒,多长时间检查一次path选项是否有新文件 |
| exclude | array | No | 排除监听的文件,跟path一样,支持通配符 | |
| max_open_files | number | No | 打开文件最大数量 | |
| path | array | YES | 输入文件的路径,可以使用通配符 例如/var/log/*/.log,则会递归搜索 | |
| sincedb_path | string | No | sincedb数据库文件的路径,用于记录被监控的日志文件当前位置 | |
| sincedb_write_interval | number | No | 15 | 单位秒,被监控日志文件当前位置写入数据库的频率 |
| start_position | string, one of ["beginning", "end"] | No | end | 指定从什么位置开始读取文件:开头或结尾。默认从结尾开始,如果要想导入旧数据,将其设置为begin。如果sincedb记录了此文件位置,那么此选项不起作用 |
| stat_interval | number | No | 1 | 单位秒,统计文件的频率,判断是否被修改。增加此值会减少系统调用次数。 |
# cat /etc/logstash/conf.d/filetest.conf
input {
    file {
        path => "/var/log/messages"
    }
}
filter {
}
output {
    stdout {
    }
}
TCP
-
通过TCP套接字读取事件,即接收数据。与标准输入和文件输入一样,每个事件都被定位一行文本。
# cat /etc/logstash/conf.d/tcptest.conf
input {
tcp {
port => 12345
}
}
filter {
}
output {
stdout{
}
}
在其他主机上安装nc工具,对logstash发送信息,即可被读取出来。
[root@vm4 ~]# yum -y install nc
[root@vm4 ~]# nc 10.1.1.13 12345
haha
在vm3上验证查看
{
"@version" => "1",
"@timestamp" => 2019-07-02T15:28:00.301Z,
"port" => 33778,
"type" => "nc",
"message" => "haha",
"host" => "vm4.cluster.com"
}
Beats
-
从Elastic Beats框架接收事件
logstash配置文件
# cat /etc/logstash/conf.d/filebeattest.conf
input {
beats {
port => 5044
host => "0.0.0.0"
}
}
filter {
}
output {
stdout {
}
}
filebeat配置文件 filebeat.prospectors: - type: log paths: - /var/log/messages tags: ["system-log","123"] fields: level: debug output.logstash: hosts: ['127.0.0.1:5044']
过滤插件(filter)
参考: Filter plugins | Logstash Reference [8.11] | Elastic
Filter:过滤,将日志格式化。
有丰富的过滤插件:
-
Grok正则捕获
-
date时间处理
-
JSON编解码
-
数据修改Mutate
-
geoip等。
所有的过滤器插件都支持以下配置选项:
| Setting | Input type | Required | Default | Description |
|---|---|---|---|---|
| add_field | hash | No | {} | 如果过滤成功,添加任何field到这个事件。例如:add_field => [ "foo_%{somefield}", "Hello world, from %{host}" ],如果这个事件有一个字段somefiled,它的值是hello,那么我们会增加一个字段foo_hello,字段值则用%{host}代替。 |
| add_tag | array | No | [] | 过滤成功会增加一个任意的标签到事件例如:add_tag => [ "foo_%{somefield}" ] |
| enable_metric | boolean | No | true | |
| id | string | No | ||
| periodic_flush | boolean | No | false | 定期调用过滤器刷新方法 |
| remove_field | array | No | [] | 过滤成功从该事件中移除任意filed。例:remove_field => [ "foo_%{somefield}" ] |
| remove_tag | array | No | [] | 过滤成功从该事件中移除任意标签,例如:remove_tag => [ "foo_%{somefield}" ] |
json(关注)
-
JSON解析过滤器,接收一个JSON的字段,将其展开为Logstash事件中的实际数据结构。
示例: 将原信息转成一个大字段,key-value做成大字段中的小字段
# cat /etc/logstash/conf.d/jsontest.conf
input {
stdin {
}
}
filter {
json {
source => "message"
target => "content"
}
}
output {
stdout {
}
}
对标准输入的内容进行json格式输出
把输出内容定向到target指定的content
[root@vm3 bin]# ./logstash --path.settings /etc/logstash -r -f /etc/logstash/conf.d/jsontest.conf
输入测试数据
{"ip":"10.1.1.1","hostname":"vm3.cluster.com"}
输出测试数据
{
"content" => {
"hostname" => "vm3.cluster.com",
"ip" => "10.1.1.1"
},
"@timestamp" => 2019-07-02T11:57:36.398Z,
"@version" => "1",
"host" => "vm3.cluster.com",
"message" => "{\"ip\":\"10.1.1.1\",\"hostname\":\"vm3.cluster.com\"}"
}
示例: 直接将原信息转成各个字段
# cat /etc/logstash/conf.d/jsontest.conf
input {
stdin {
}
}
filter {
json {
source => "message"
}
}
output {
stdout {
}
}
[root@vm3 bin]# ./logstash --path.settings /etc/logstash -r -f /etc/logstash/conf.d/jsontest.conf
输入测试数据
{"ip":"10.1.1.1","hostname":"vm3.cluster.com"}
输出测试数据
{
"port" => 39442,
"@version" => "1",
"@timestamp" => 2019-09-19T09:07:03.800Z,
"hostname" => "vm3.cluster.com",
"host" => "vm4.cluster.com",
"ip" => "10.1.1.1",
"message" => "{\"ip\":\"10.1.1.1\",\"hostname\":\"vm3.cluster.com\"}"
}
kv
-
自动解析为key=value。
-
也可以任意字符串分割数据。
-
field_split 一串字符,指定分隔符分析键值对
URL查询字符串拆分参数示例
# cat /etc/logstash/conf.d/kvtest.conf
input {
stdin {
}
}
filter {
kv {
field_split => "&?"
}
}
output {
stdout {
}
}
文件中的列以&或?进行分隔
执行
[root@vm3 bin]# ./logstash --path.settings /etc/logstash -r -f /etc/logstash/conf.d/kvtest.conf
输入数据
address=www.abc.com?pid=123&user=abc
输出数据
{
"user" => "abc",
"@timestamp" => 2019-07-02T12:05:23.143Z,
"host" => "vm3.cluster.com",
"@version" => "1",
"message" => "address=www.abc.com?pid=123&abc=user",
"address" => "www.abc.com",
"pid" => "123"
}
使用正则也可以匹配
[root@vm3 bin]# cat /etc/logstash/conf.d/kvtest.conf
input {
stdin {
}
}
filter {
kv {
field_split_pattern => ":+"
}
}
output {
stdout {
}
}
grok(关注)
-
grok是将非结构化数据解析为结构化
-
这个工具非常适于系统日志,mysql日志,其他Web服务器日志以及通常人类无法编写任何日志的格式。
-
默认情况下,Logstash附带约120个模式。也可以添加自己的模式(patterns_dir)
-
模式后面对应正则表达式
-
查看模式地址:https://github.com/logstash-plugins/logstash-patterns-core/tree/master/patterns
-
包含字段如下
| Setting | Input type | Required | Default | Description |
|---|---|---|---|---|
| break_on_match | boolean | No | true | |
| keep_empty_captures | No | false | 如果true将空保留为事件字段 | |
| match | hash | No | {} | 一个hash匹配字段=>值 |
| named_captures_only | boolean | No | true | 如果true,只存储 |
| overwrite | array | No | [] | 覆盖已存在的字段的值 |
| pattern_definitions | No | {} | ||
| patterns_dir | array | No | [] | 自定义模式 |
| patterns_files_glob | string | No | * | Glob模式,用于匹配patterns_dir指定目录中的模式文件 |
| tag_on_failure | array | No | _grokparsefailure | tags没有匹配成功时,将值附加到字段 |
| tag_on_timeout | string | No | _groktimeout | 如果Grok正则表达式超时,则应用标记 |
| timeout_millis | number | 30000 | 正则表达式超时时间 |
grok模式语法
格式:%{SYNTAX:SEMANTIC}
-
SYNTAX 模式名称
-
SEMANTIC 匹配文本的标识符
例如:%{NUMBER:duration} %{IP:client}
# vim /etc/logstash/conf.d/groktest.conf
input {
stdin {
}
}
filter {
grok {
match => {
"message" => "%{IP:client} %{WORD:method} %{URIPATHPARAM:request} %{NUMBER:bytes} %{NUMBER:duration}"
}
}
}
output {
stdout {
}
}
虚构http请求日志抽出有用的字段
55.3.244.1 GET /index.html 15824 0.043
输出结果
{
"client" => "55.3.244.1",
"duration" => "0.043",
"message" => "55.3.244.1 GET /index.html 15824 0.043",
"method" => "GET",
"bytes" => "15824",
"@version" => "1",
"@timestamp" => 2019-07-03T12:24:47.596Z,
"host" => "vm3.cluster.com",
"request" => "/index.html"
}
自定义模式
如果默认模式中没有匹配的,可以自己写正则表达式。
# vim /opt/patterns
ID [0-9]{3,5}
配置文件中应包含如下内容
filter {
grok {
patterns_dir =>"/opt/patterns"
match => {
"message" => "%{IP:client} %{WORD:method} %{URIPATHPARAM:request} %{NUMBER:bytes} %{NUMBER:duration} %{ID:id}"
}
}
}
完整文件内容
[root@vm3 ~]# cat /etc/logstash/conf.d/groktest.conf
input {
stdin {
}
}
filter {
grok {
patterns_dir =>"/opt/patterns"
match => {
"message" => "%{IP:client} %{WORD:method} %{URIPATHPARAM:request} %{NUMBER:bytes} %{NUMBER:duration} %{ID:id}"
}
}
}
output {
stdout {
}
}
#执行
[root@vm3 bin]# ./logstash --path.settings /etc/logstash -r -f /etc/logstash/conf.d/groktest.conf
输入测试数据
55.3.244.1 GET /index.html 15824 0.043 6666
输出测试数据
{
"client" => "55.3.244.1",
"host" => "vm3.cluster.com",
"request" => "/index.html",
"@timestamp" => 2019-07-02T12:34:11.906Z,
"bytes" => "15824",
"method" => "GET",
"message" => "55.3.244.1 GET /index.html 15824 0.043 15BF7F3ABB",
"@version" => "1",
"id" => "666",
"duration" => "0.043"
}
geoip(关注)
-
开源IP地址库
-
GeoLite2 Free Geolocation Data | MaxMind Developer Portal
下载IP地址库 [root@vm3 ~]# wget https://geolite.maxmind.com/download/geoip/database/GeoLite2-City.tar.gz [root@vm3 ~]# tar xf GeoLite2-City.tar.gz [root@vm3 ~]# cp GeoLite2-City_20190625/GeoLite2-City.mmdb /opt
# cat /etc/logstash/conf.d/geoiptest.conf
input {
stdin {
}
}
filter {
grok {
match => {
"message" => "%{IP:client} %{WORD:method} %{URIPATHPARAM:request} %{NUMBER:bytes} %{NUMBER:duration}"
}
}
geoip {
source => "client"
database => "/opt/GeoLite2-City.mmdb"
}
}
output {
stdout {
}
}
执行
[root@vm3 bin]# ./logstash --path.settings /etc/logstash -r -f /etc/logstash/conf.d/geoiptest.conf
输入测试数据
202.106.0.20 GET /index.html 123 0.331
输出结果
{
"method" => "GET",
"client" => "202.106.0.20",
"bytes" => "123",
"request" => "/index.html",
"geoip" => {
"country_code2" => "CN",
"country_name" => "China",
"region_code" => "BJ",
"longitude" => 116.3883,
"latitude" => 39.9289,
"timezone" => "Asia/Shanghai",
"location" => {
"lon" => 116.3883,
"lat" => 39.9289
},
"country_code3" => "CN",
"ip" => "202.106.0.20",
"continent_code" => "AS",
"region_name" => "Beijing"
},
"duration" => "0.331",
"host" => "vm3.cluster.com",
"message" => "202.106.0.20 GET /index.html 123 0.331",
"@timestamp" => 2019-07-02T12:15:29.384Z,
"@version" => "1"
}
[root@vm3 bin]# cat /etc/logstash/conf.d/geoiptest2.conf
input {
stdin {
}
}
filter {
grok {
match => {
"message" => "%{IP:client} %{WORD:method} %{URIPATHPARAM:request} %{NUMBER:bytes} %{NUMBER:duration}"
}
}
geoip {
source => "client"
database => "/opt/GeoLite2-City.mmdb"
target => "geoip"
fields => ["city_name", "country_code2", "country_name","region_name"]
}
}
output {
stdout {
codec => rubydebug
}
}
执行
[root@vm3 bin]# ./logstash --path.settings /etc/logstash -r -f /etc/logstash/conf.d/geoiptest2.conf
输入测试数据
110.226.4.6 GET /home.html 518 0.247
输出结果
{
"host" => "vm3.cluster.com",
"duration" => "0.247",
"request" => "/home.html",
"@version" => "1",
"client" => "110.226.4.6",
"message" => "110.226.4.6 GET /home.html 518 0.247",
"method" => "GET",
"bytes" => "518",
"@timestamp" => 2019-07-02T12:22:22.458Z,
"geoip" => {
"country_name" => "India",
"country_code2" => "IN"
}
}
输出插件(output)
Output:输出,输出目标可以是Stdout、ES、Redis、File、TCP等。
ES
| Setting | Input type | Required | Default | Description |
|---|---|---|---|---|
| hosts | URL | No | ||
| index | string | No | logstash-%{+YYYY.MM.dd} | 将事件写入索引。默认按日期划分。 |
| user | string | No | ES集群用户 | |
| password | password | No | ES集群密码 |
input {
file {
path => ["/var/log/messages"]
type => "system"
tags => ["syslog","test"]
start_position => "beginning"
}
file {
path => ["/var/log/audit/audit.log"]
type => "system"
tags => ["auth","test"]
start_position => "beginning"
}
}
filter {
}
output {
if [type] == "system" {
if [tags][0] == "syslog" {
elasticsearch {
hosts => ["http://es1:9200","http://es2:9200","http://es3:9200"]
index => "logstash-system-syslog-%{+YYYY.MM.dd}"
}
stdout { codec=> rubydebug }
}
else if [tags][0] == "auth" {
elasticsearch {
hosts => ["http://es1:9200","http://es2:9200","http://es3:9200"]
index => "logstash-system-auth-%{+YYYY.MM.dd}"
}
stdout { codec=> rubydebug }
}
}
}