参考《监控系统部署prometheus基本功能》先完成prometheus部署。
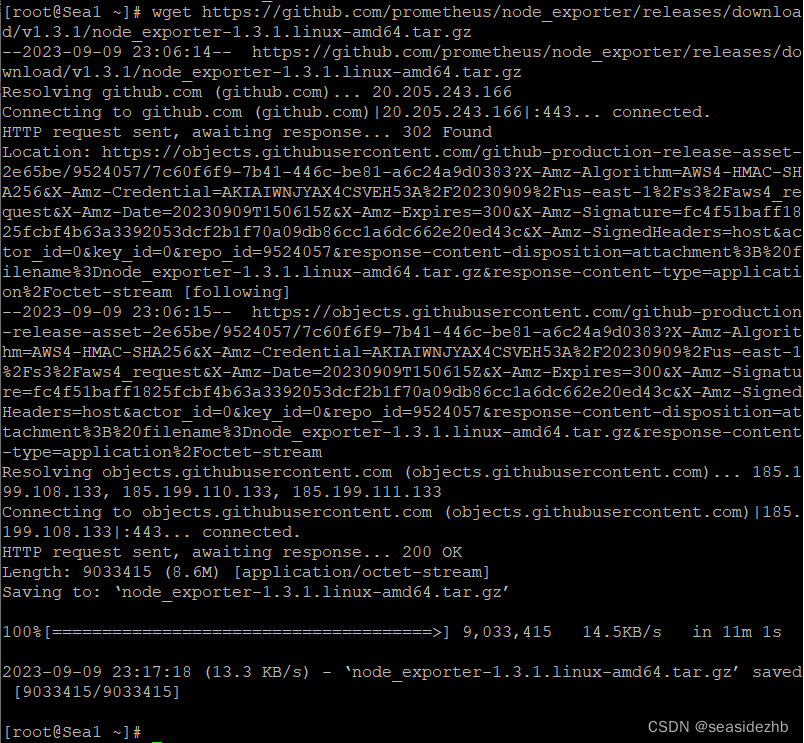
wget https://github.com/prometheus/node_exporter/releases/download/v1.3.1/node_exporter-1.3.1.linux-amd64.tar.gz下载压缩包。
tar -zxf node_exporter-1.3.1.linux-amd64.tar.gz进行解压。

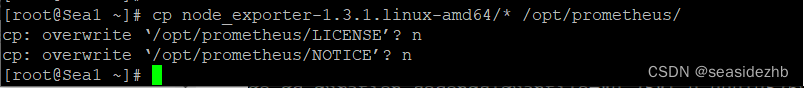
cp node_exporter-1.3.1.linux-amd64/* /opt/prometheus/进行复制。
nohup /opt/prometheus/node_exporter &> output.log &后台启动。

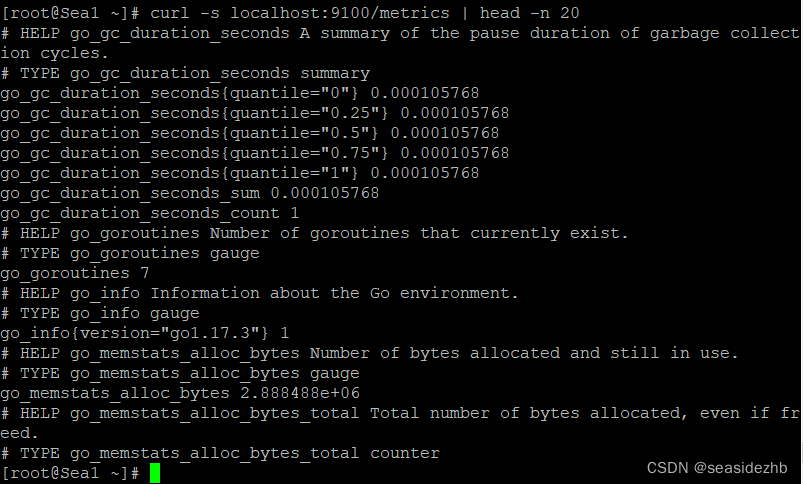
curl -s localhost:9100/metrics | head -n 20看一下9100端口前二十行输出内容。
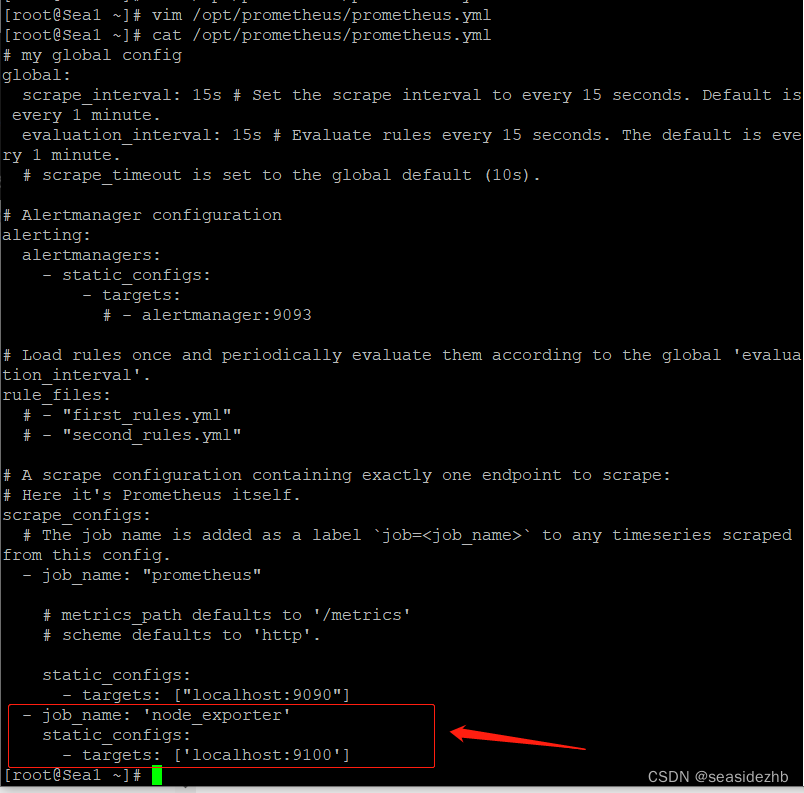
在/opt/prometheus/prometheus.yml最后添加上下边的内容:
  - job_name: 'node_exporter'
    static_configs:
      - targets: ['localhost:9100']
配置告警规则
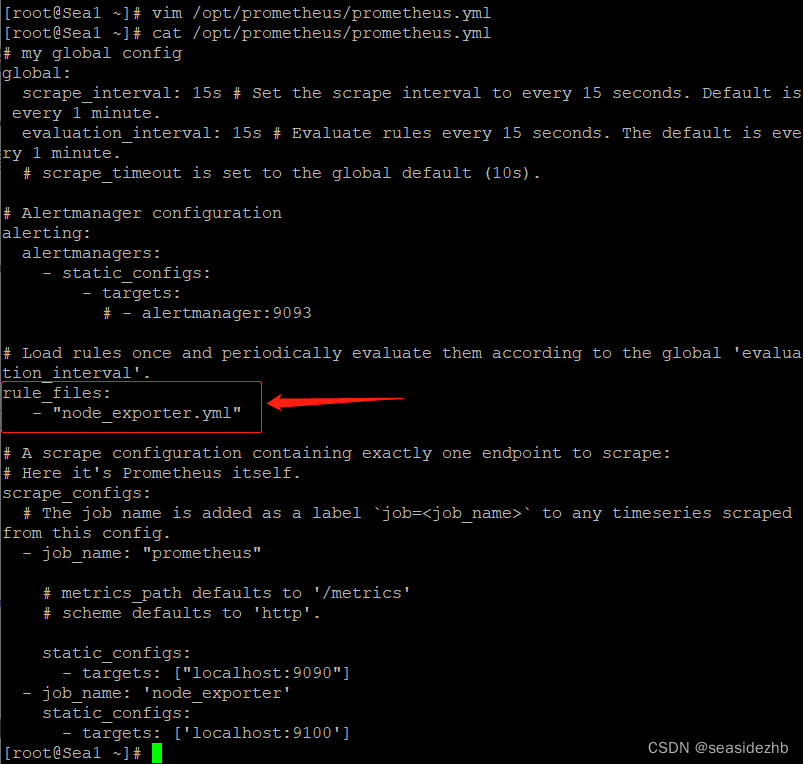
在/opt/prometheus/prometheus.yml把下边的内容:
 rule_files:
  # - "first_rules.yml"
  # - "second_rules.yml"
替换为
rule_files:
   - "node_exporter.yml"
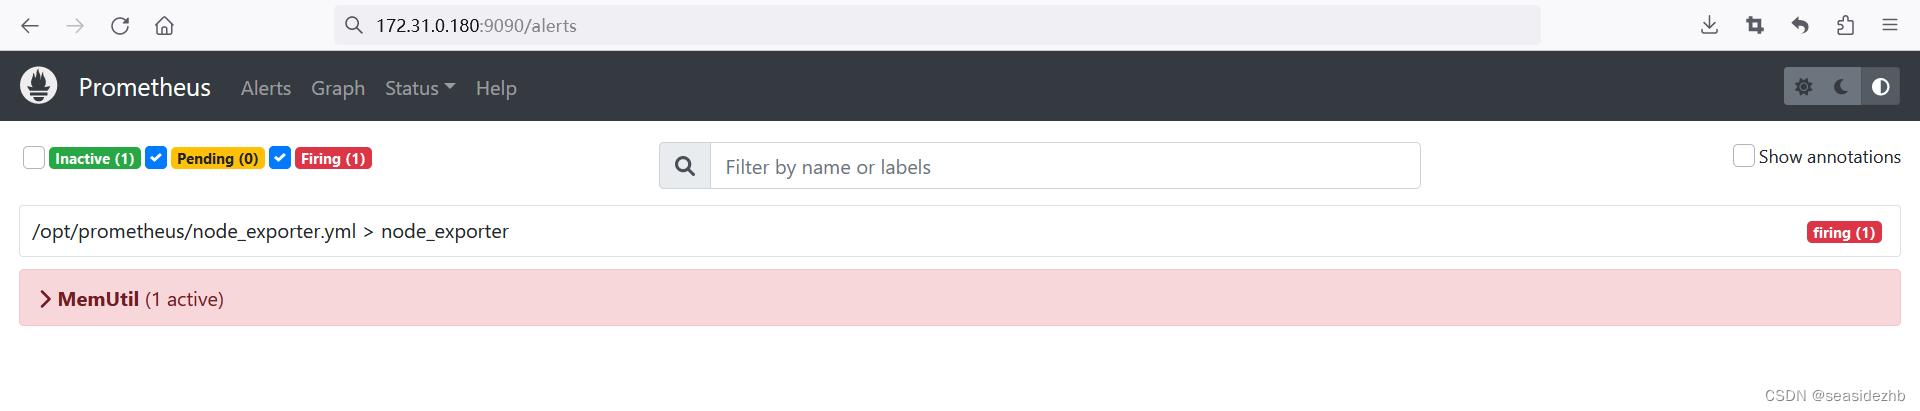
页面查看,在页面上点击Alerts。
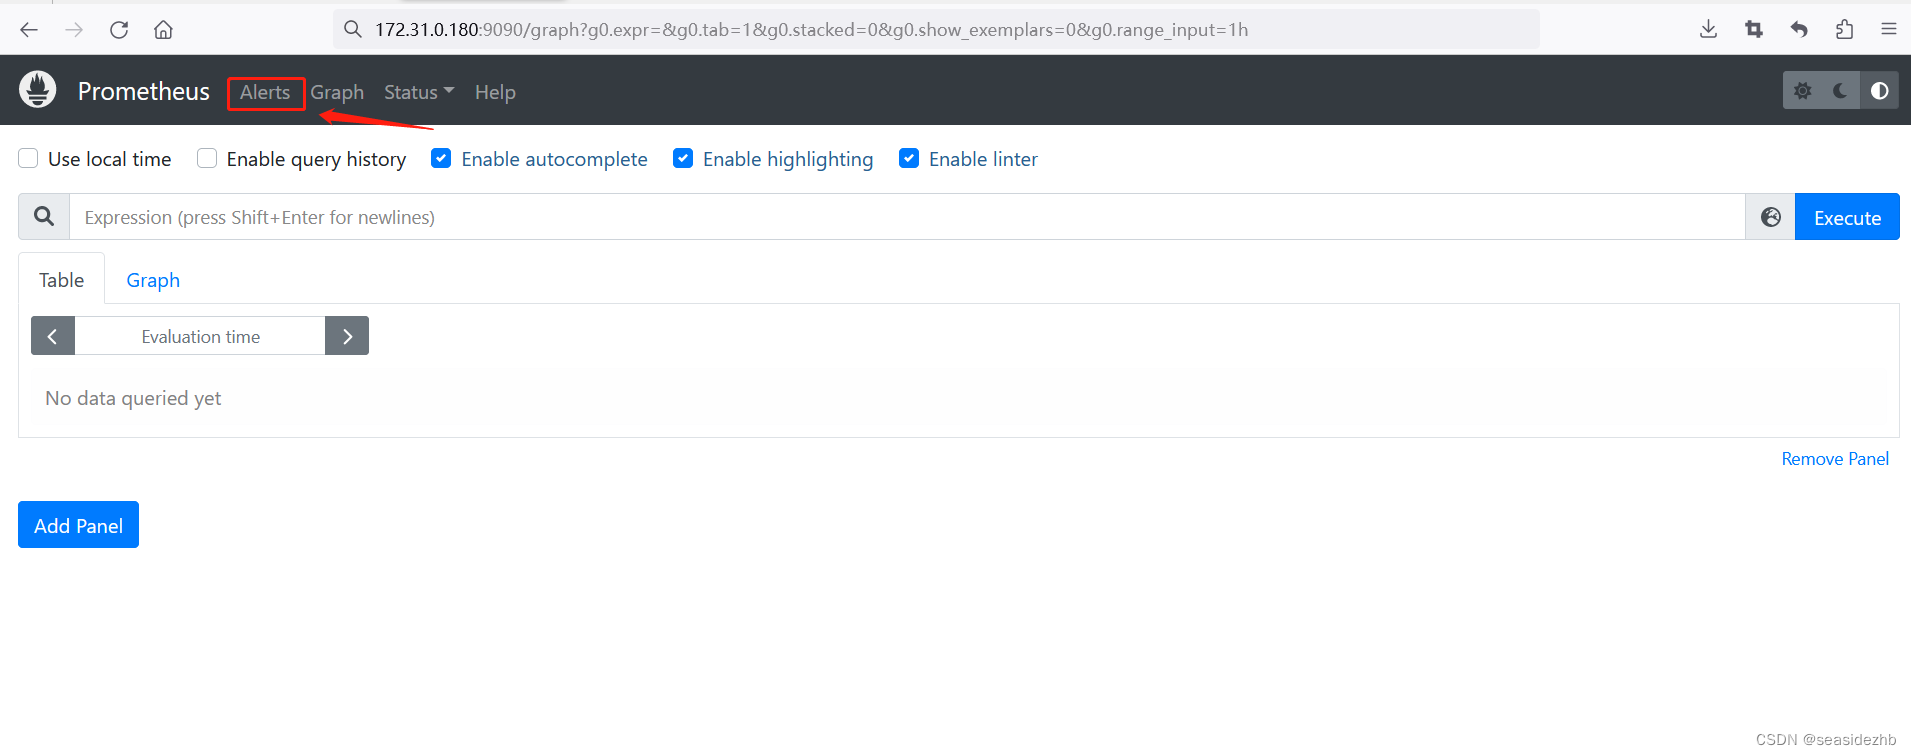
显示内容如下图:
此文章为9月Day 9学习笔记,内容来源于极客时间《运维监控系统实战笔记》。