参考《监控系统部署prometheus基本功能》先完成prometheus部署。
参考《运维学习之采集器 node_exporter 1.3.1安装并使用》安装node_exporter。
下载
nohup wget https://github.com/prometheus/alertmanager/releases/download/v0.24.0/alertmanager-0.24.0.linux-amd64.tar.gz &后台下载alertmanager-0.24.0.linux-amd64.tar.gz。
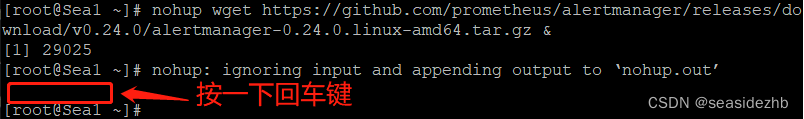
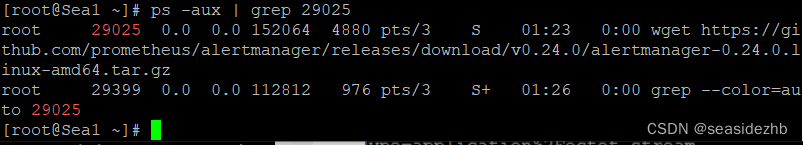
ps -aux | grep 29025进行查看进程29025的运行情况,要是有两条数据显示就说明还在运行中。
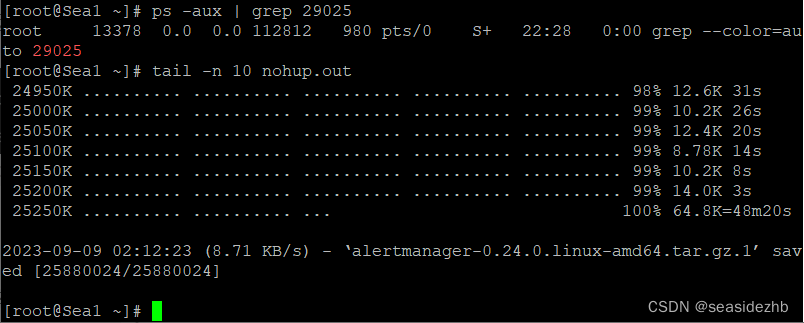
ps -aux | grep 29025进行查看进程29025的运行情况,要是有一条数据显示就说明已经结束运行。

tail -n 10 nohup.out看一下要是有‘alertmanager-0.24.0.linux-amd64.tar.gz.1’ saved [25880024/25880024]的字样就是真正下载完成。
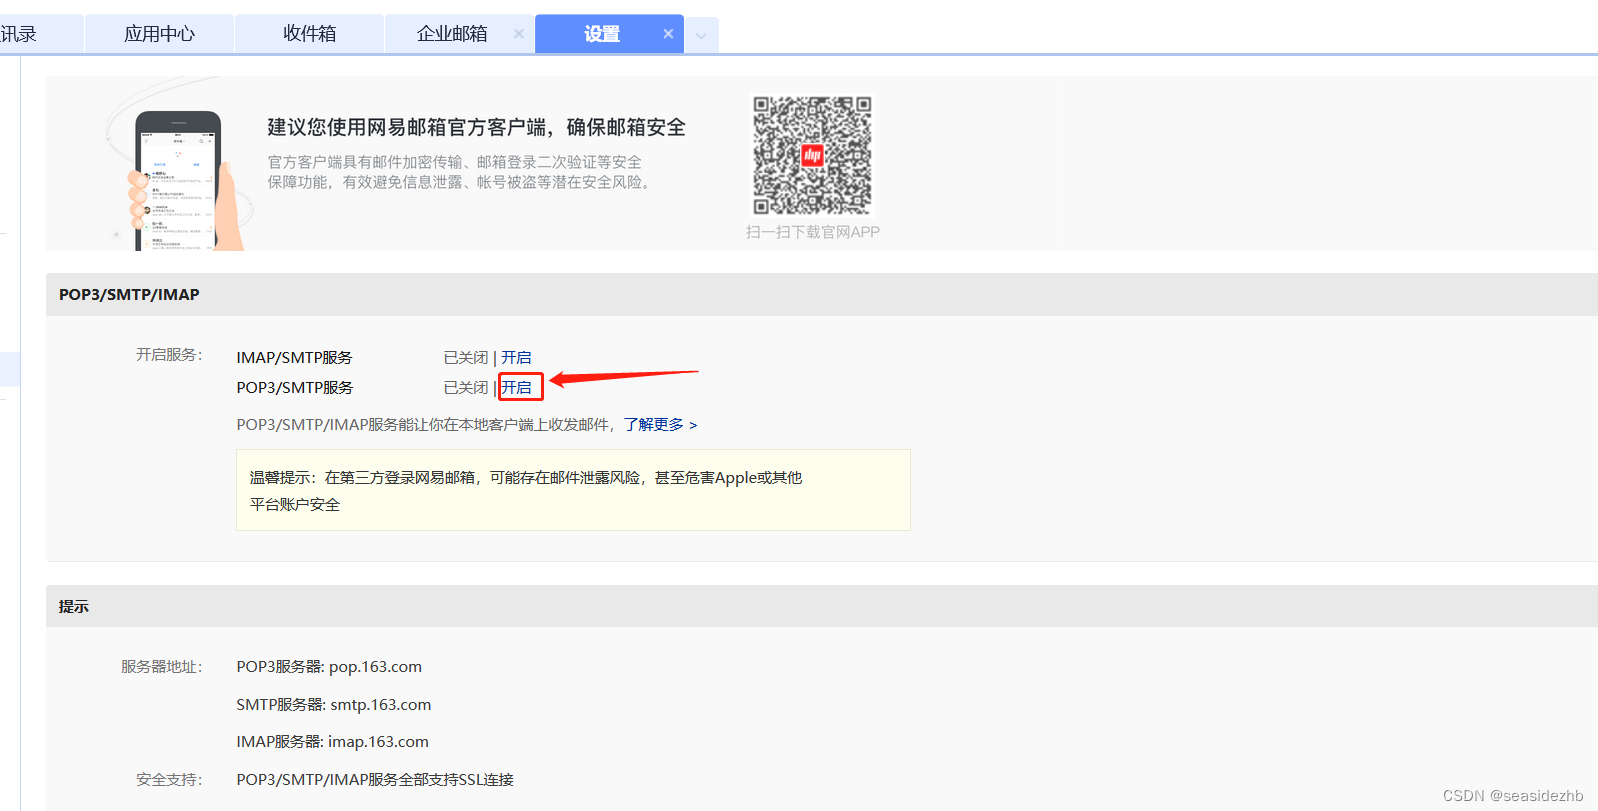
163邮箱POP3/SMTP服务开启
https://mail.163.com是163邮箱的官网。
登录自己的系统之后,点击页面上的设置按钮。

选择“POP3/SMTP/IMAP”。

在POP3/SMTP服务点击开启。
点击继续开启。

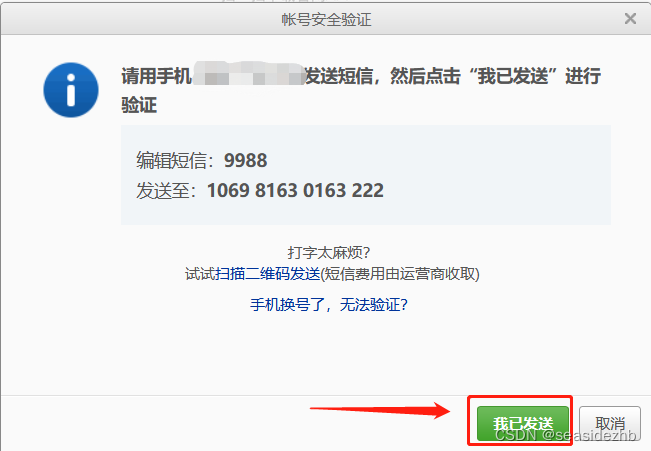
按照页面上提示发送短信。
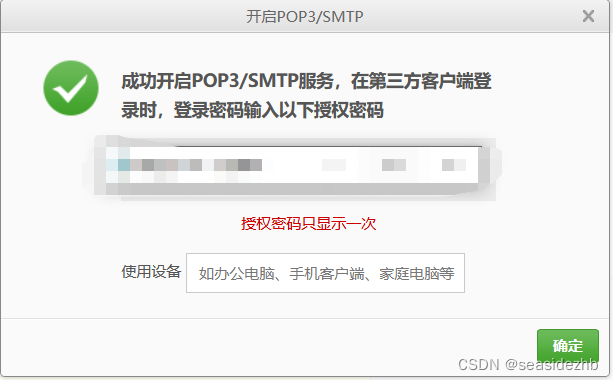
记录一下授权密码,比如2DKYCFORQBNXNCF1
解压并启动服务
tar -zxf alertmanager-0.24.0.linux-amd64.tar.gz进行解压

mkdir -p /usr/local/alertmanager创建目录。

cp alertmanager-0.24.0.linux-amd64/* /usr/local/alertmanager把alertmanager-0.24.0.linux-amd64目录下所有内容复制到/usr/local/alertmanager下边。

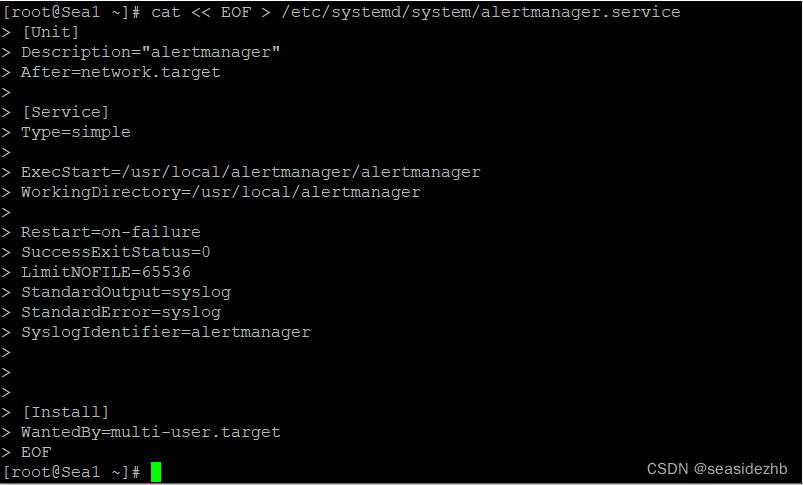
cat << EOF > /etc/systemd/system/alertmanager.service,把下边的内容输入进去:
[Unit]
Description="alertmanager"
After=network.target

[Service]
Type=simple

ExecStart=/usr/local/alertmanager/alertmanager
WorkingDirectory=/usr/local/alertmanager

Restart=on-failure
SuccessExitStatus=0
LimitNOFILE=65536
StandardOutput=syslog
StandardError=syslog
SyslogIdentifier=alertmanager


[Install]
WantedBy=multi-user.target
``
配置邮箱
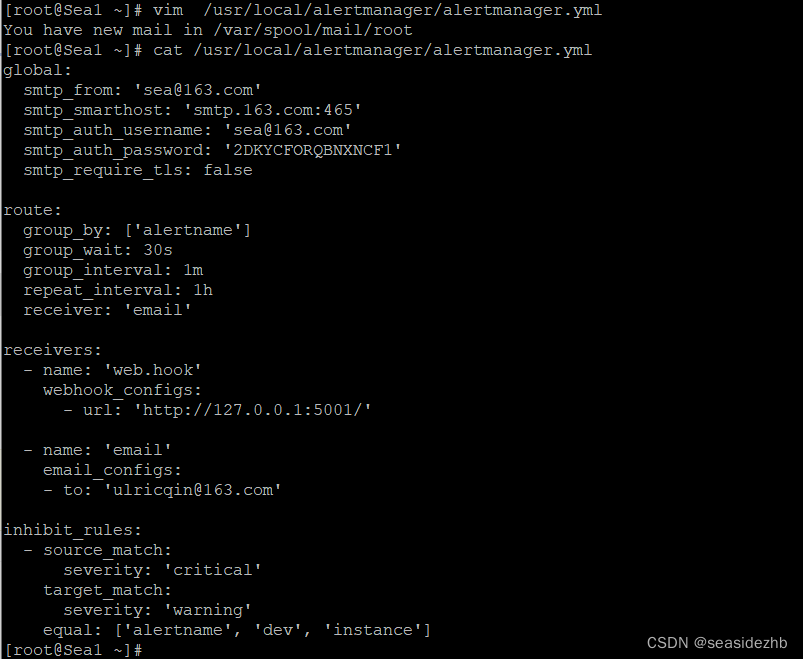
vim /usr/local/alertmanager/alertmanager.yml把下边内容写进去:
global:
  smtp_from: 'sea@163.com'
  smtp_smarthost: 'smtp.163.com:465'
  smtp_auth_username: 'sea@163.com'
  smtp_auth_password: '2DKYCFORQBNXNCF1'
  smtp_require_tls: false

route:
  group_by: ['alertname']
  group_wait: 30s
  group_interval: 1m
  repeat_interval: 1h
  receiver: 'email'

receivers:
  - name: 'web.hook'
    webhook_configs:
      - url: 'http://127.0.0.1:5001/'

  - name: 'email'
    email_configs:
    - to: 'ulricqin@163.com'

inhibit_rules:
  - source_match:
      severity: 'critical'
    target_match:
      severity: 'warning'
    equal: ['alertname', 'dev', 'instance']
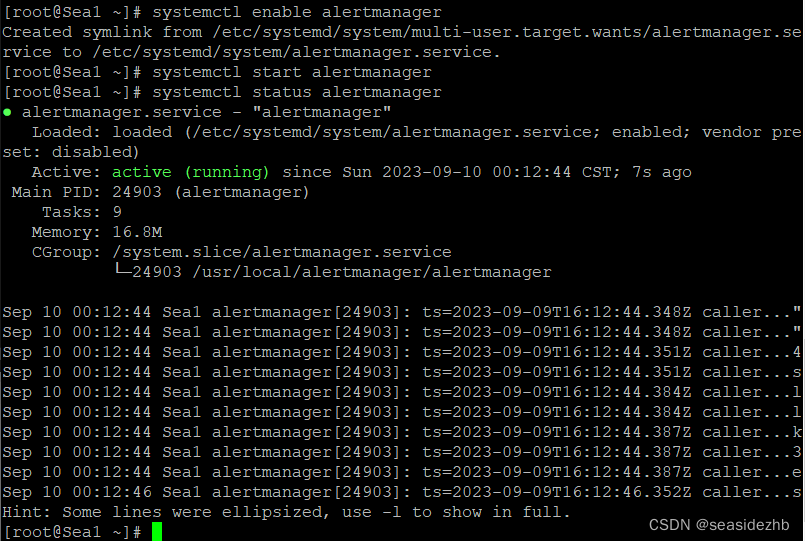
systemctl enable alertmanager允许自启动,systemctl start alertmanager启动服务,systemctl status alertmanager看一下状态。
在prometheus中配置alertmanager
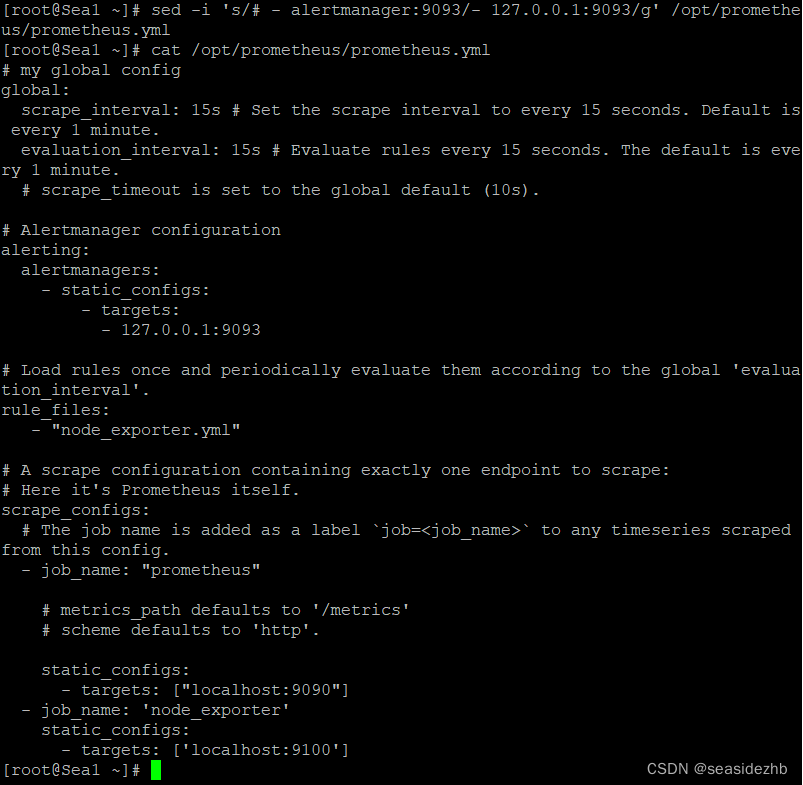
sed -i 's/# - alertmanager:9093/- '127.0.0.1:9093'/g' /opt/prometheus/prometheus.yml修改内容。
cat /opt/prometheus/prometheus.yml可以看到文件内容如下:
# my global config
global:
  scrape_interval: 15s # Set the scrape interval to every 15 seconds. Default is every 1 minute.
  evaluation_interval: 15s # Evaluate rules every 15 seconds. The default is every 1 minute.
  # scrape_timeout is set to the global default (10s).

# Alertmanager configuration
alerting:
  alertmanagers:
    - static_configs:
        - targets:
          - '127.0.0.1:9093'

# Load rules once and periodically evaluate them according to the global 'evaluation_interval'.
rule_files:
   - "node_exporter.yml"

# A scrape configuration containing exactly one endpoint to scrape:
# Here it's Prometheus itself.
scrape_configs:
  # The job name is added as a label `job=<job_name>` to any timeseries scraped from this config.
  - job_name: "prometheus"

    # metrics_path defaults to '/metrics'
    # scheme defaults to 'http'.

    static_configs:
      - targets: ["localhost:9090"]
  - job_name: 'node_exporter'
    static_configs:
      - targets: ['localhost:9100']
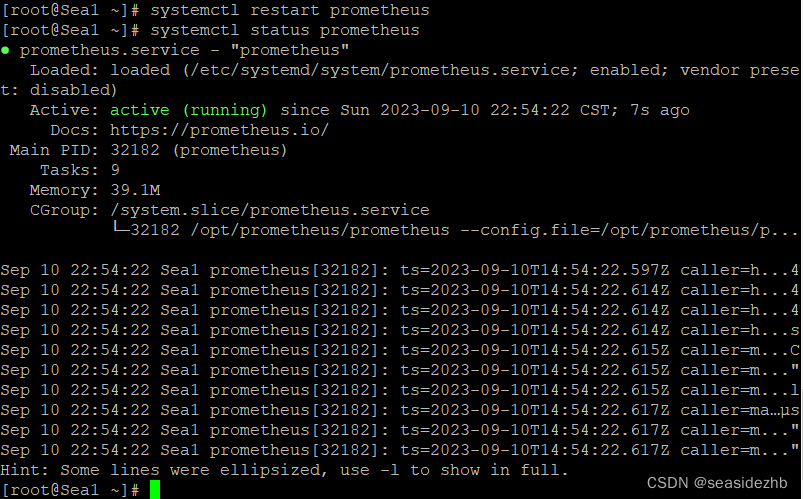
systemctl restart prometheus重启服务,systemctl status prometheus可以看到服务状态是active (running)。


![[hello,world]这个如何将[ ] 去掉](https://img-blog.csdnimg.cn/fe1f55d13c3b497f8cab63cfed4c85e8.png#pic_center)