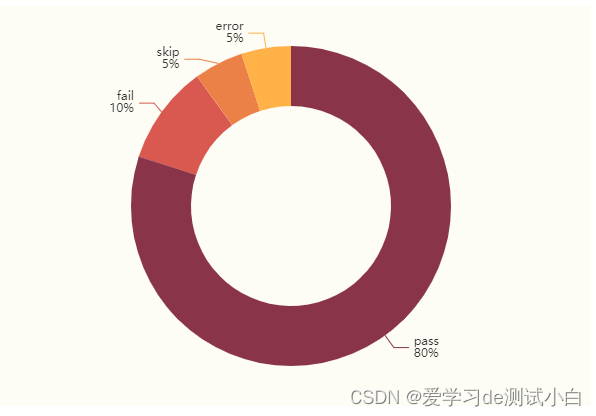
它是一组颜色,图形、系列会自动从其中选择颜色, 不断的循环从头取到尾, 再从头取到尾, 如此往复 主要分三种:主题调色盘、全局调色盘、局部调色盘 echarts. registerTheme ( 'myCustomTheme' , {
"color" : [
"#893448" ,
"#d95850" ,
"#eb8146" ,
"#ffb248" ,
"#f2d643" ,
"#ebdba4"
] ,
"backgroundColor" : "rgba(242,234,191,0.15)" ,
} )
<! DOCTYPE html > < htmllang = " en" > < head> < metacharset = " UTF-8" > < metaname = " viewport" content = " width=device-width, initial-scale=1.0" > < metahttp-equiv = " X-UA-Compatible" content = " ie=edge" > < title> </ title> < scriptsrc = " https://cdn.jsdelivr.net/npm/echarts@5.4.1/dist/echarts.min.js" > </ script> < scriptsrc = " lib/CustomTheme.js" > </ script> </ head> < body> < divid = ' app' style = " width : 600px; height : 400px" > </ div> < script>
echarts. registerTheme ( 'myCustomTheme' , {
"color" : [
"#893448" ,
"#d95850" ,
"#eb8146" ,
"#ffb248" ,
"#f2d643" ,
"#ebdba4"
] ,
"backgroundColor" : "rgba(242,234,191,0.15)" ,
} )
var mCharts = echarts. init ( document. getElementById ( "app" ) , 'myCustomTheme' )
var pieData = [
{
name : 'pass' ,
value : 80
} ,
{
name : 'fail' ,
value : 10
} ,
{
name : 'skip' ,
value : 5
} ,
{
name : 'error' ,
value : 5
}
]
var option = {
series : [
{
type : 'pie' ,
data : pieData,
label : {
show : true ,
formatter : function ( arg ) {
console. log ( arg)
return arg. data. name + '\n' + arg. percent + '%'
}
} ,
selectedMode : 'multiple' ,
selectedOffset : 30 ,
radius : [ '50%' , '80%' ]
}
]
}
mCharts. setOption ( option)
</ script> </ body> </ html>
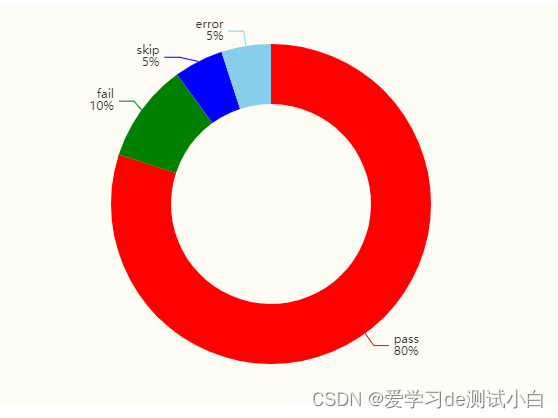
全局调色盘:在 option 下增加一个 color 的数组 var option = {
color : [ 'red' , 'green' , 'blue' , 'skyblue' , 'purple' ]
}
<! DOCTYPE html > < htmllang = " en" > < head> < metacharset = " UTF-8" > < metaname = " viewport" content = " width=device-width, initial-scale=1.0" > < metahttp-equiv = " X-UA-Compatible" content = " ie=edge" > < title> </ title> < scriptsrc = " https://cdn.jsdelivr.net/npm/echarts@5.4.1/dist/echarts.min.js" > </ script> < scriptsrc = " lib/CustomTheme.js" > </ script> </ head> < body> < divid = ' app' style = " width : 600px; height : 400px" > </ div> < script>
var mCharts = echarts. init ( document. getElementById ( "app" ) )
var pieData = [
{
name : 'pass' ,
value : 80
} ,
{
name : 'fail' ,
value : 10
} ,
{
name : 'skip' ,
value : 5
} ,
{
name : 'error' ,
value : 5
}
]
var option = {
color : [ 'red' , 'green' , 'blue' , 'skyblue' , 'purple' ] ,
series : [
{
type : 'pie' ,
data : pieData,
label : {
show : true ,
formatter : function ( arg ) {
console. log ( arg)
return arg. data. name + '\n' + arg. percent + '%'
}
} ,
selectedMode : 'multiple' ,
selectedOffset : 30 ,
radius : [ '50%' , '80%' ]
}
]
}
mCharts. setOption ( option)
</ script> </ body> </ html>
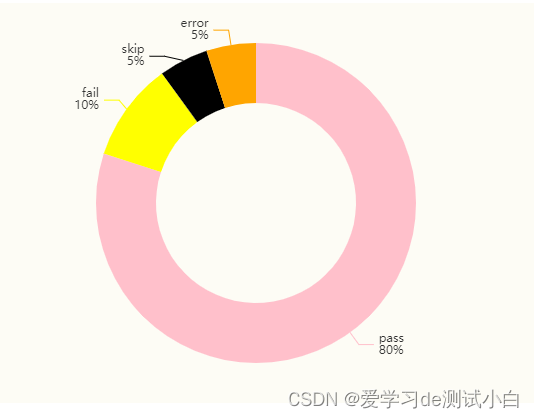
局部调色盘:在 series 下增加一个 color 的数组
说明 :如果全局的调色盘和局部的调色盘都设置了, 局部调色盘会产生效果, 这里面遵循的是就近原则
var option = {
color : [ 'red' , 'green' , 'blue' , 'skyblue' , 'purple' ] ,
series : [
{
type : 'pie' ,
data : pieData,
color : [ 'pink' , 'yellow' , 'black' , 'orange' , 'red' ]
}
]
}
mCharts. setOption ( option)
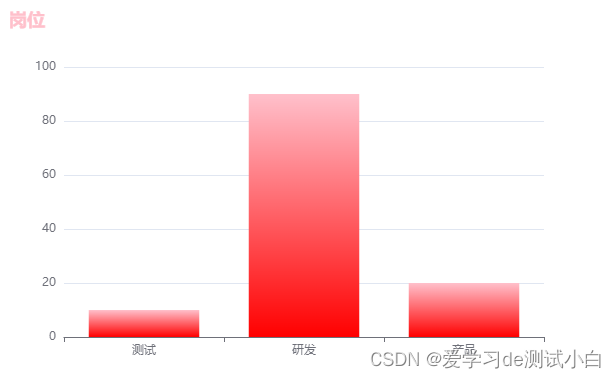
效果 线性渐变
线性渐变的类型为 linear , 他需要配置线性的方向, 通过 x, y, x2, y2 即可进行配置
<! DOCTYPE html > < htmllang = " en" > < head> < metacharset = " UTF-8" > < metaname = " viewport" content = " width=device-width, initial-scale=1.0" > < metahttp-equiv = " X-UA-Compatible" content = " ie=edge" > < title> </ title> < scriptsrc = " https://cdn.jsdelivr.net/npm/echarts@5.4.1/dist/echarts.min.js" > </ script> </ head> < body> < divid = ' app' style = " width : 600px; height : 400px" > </ div> < script>
var myCharts = echarts. init ( document. getElementById ( 'app' ) )
var option = {
xAxis : {
type : 'category' ,
data : [ '测试' , '研发' , '产品' ]
} ,
yAxis : {
type : 'value'
} ,
title : {
text : '岗位' ,
link : 'https://blog.csdn.net/IT_heima' ,
target : 'blank' ,
textStyle : {
color : 'pink' ,
fontWeight : 'bold'
}
} ,
series : [
{
name : '岗位' ,
type : 'bar' ,
data : [ 10 , 90 , 20 ] ,
itemStyle : {
color : {
type : 'linear' ,
x : 0 ,
y : 0 ,
x2 : 0 ,
y2 : 1 ,
colorStops : [ {
offset : 0 , color : 'pink'
} , {
offset : 1 , color : 'red'
} ]
}
}
}
]
}
myCharts. setOption ( option)
</ script> </ body> </ html> 效果 径向渐变
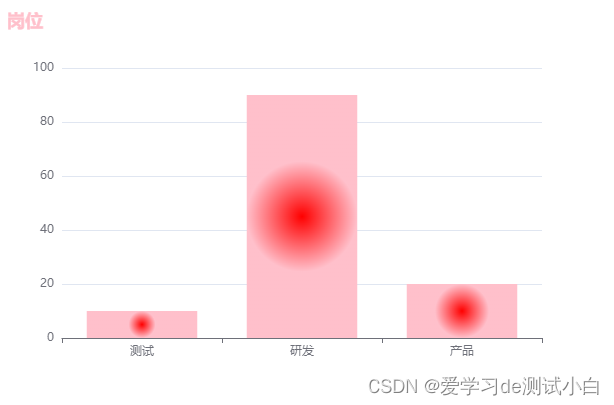
线性渐变的类型为 radial , 他需要配置径向的方向, 通过 x , y , r 即可进行配置
<! DOCTYPE html > < htmllang = " en" > < head> < metacharset = " UTF-8" > < metaname = " viewport" content = " width=device-width, initial-scale=1.0" > < metahttp-equiv = " X-UA-Compatible" content = " ie=edge" > < title> </ title> < scriptsrc = " https://cdn.jsdelivr.net/npm/echarts@5.4.1/dist/echarts.min.js" > </ script> </ head> < body> < divid = ' app' style = " width : 600px; height : 400px" > </ div> < script>
var myCharts = echarts. init ( document. getElementById ( 'app' ) )
var option = {
xAxis : {
type : 'category' ,
data : [ '测试' , '研发' , '产品' ]
} ,
yAxis : {
type : 'value'
} ,
title : {
text : '岗位' ,
link : 'https://blog.csdn.net/IT_heima' ,
target : 'blank' ,
textStyle : {
color : 'pink' ,
fontWeight : 'bold'
}
} ,
series : [
{
name : '岗位' ,
type : 'bar' ,
data : [ 10 , 90 , 20 ] ,
itemStyle : {
color : {
type : 'radial' ,
x : 0.5 ,
y : 0.5 ,
r : 0.5 ,
colorStops : [
{
offset : 0 , color : 'red'
} ,
{
offset : 1 , color : 'pink'
}
]
}
}
}
]
}
myCharts. setOption ( option)
</ script> </ body> </ html> 效果


![[附源码]Nodejs计算机毕业设计基于微信平台的车险投保系统设计与实现Express(程序+LW)](https://img-blog.csdnimg.cn/bd468cafad2b42e58bf73f7491d640be.png)
![[CISCN2019 华北赛区 Day1 Web2]](https://img-blog.csdnimg.cn/32151f23286448f88bb202ff3a2049d0.png)