需求
方法一
使用 div 定位 将数字放在饼图中间
  <div style="position: relative;">
      <pieChart :chartObj="usageMap" />
      <div class="pieNum" :style="{ left: drawer ? '40px' : '65px' }">
       <div class="pieTitle" v-if="usageMap">
         <div>{{ usageMap.usedPosCount }}</div>
          <div class="pieLine" v-if="usageMap.totalPosCount"></div>
          <div>{{ usageMap.totalPosCount }}</div>
        </div>
   </div>
 </div>
css
<style rel="stylesheet/scss" lang="scss" scoped>
.pieNum {
    color: #fff;
    position: absolute;
    top: 45px;

}

.pieTitle {
    display: flex;
    flex-direction: column;
    justify-content: center;
    align-items: center;
}

.pieLine {
    width: 40px;
    height: 1px;
    background-color: #fff;
}
</style>
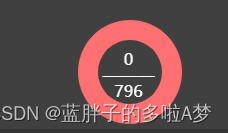
效果
也实现了需求
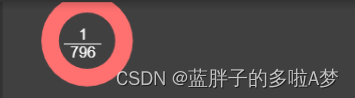
但是,当屏幕发生变化时,数字并没有跟着适配
缺点
不能适配所有屏幕,不能根据屏幕的大小而进行位置移动
方法二
使用环形图 自带的 title 属性,自定义title展示数据
代码
 title: {
                    top: 'center',
                    text: [
                        '{value|' + this.chartObj.usedPosCount + '}', '{sortLine|———}',
                        '{name|' + this.chartObj.totalPosCount + '}',
                    ].join('\n'),

                    left: '21%',
                    top: '25%',
                    textAlign: 'center',
                    textStyle: {
                        rich: {
                            value: {
                                color: '#ffff',
                                fontSize: 16,

                            },
                            name: {
                                color: '#ffff',
                                fontSize: 16,
                            },
                            sortLine: {
                                color: '#ffff',
                                fontSize: 16,

                            },
                        },
                    },
                },
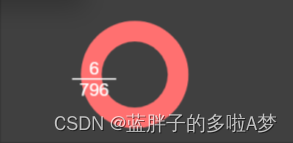
效果图

参考链接 https://blog.csdn.net/Guoyu1_/article/details/116978413