雷达图在多维度分析中是一种非常实用的可视化工具,主要有以下优势:
- 易于理解:雷达图使用多边形或者圆形的形式展示多维度的数据,直观易于理解。
- 多维度对比:雷达图可以在同一张图上比较多个项目或者实体在多个维度上的表现。
- 数据关系明显:通过雷达图,可以直观的看出各个数据之间的关系,比如哪个维度的表现好,哪个维度的表现差。
- 高度可定制:雷达图可以根据实际需求进行定制,比如更改轴的数量、更改颜色或者样式等。
- 凸显关键因素:雷达图中,离中心越远的点代表该维度的表现越突出,这样就可以直观的看出关键因素。
- 如下图实例:
实例中用到HTML,JS,Echarts等相关技术,但是代码部分的开发与测试,可以交给ChatGPT
OpenAI来实现。
具体操作。
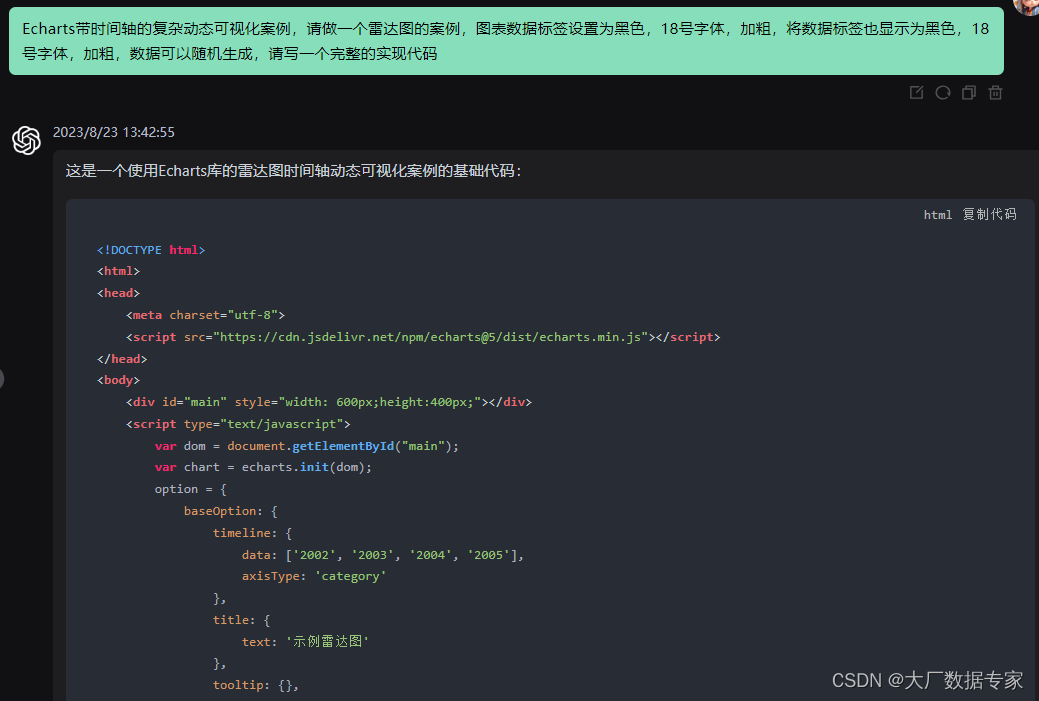
将完整的代码复制下来。
<html>
<head>
    <meta charset="utf-8">
    <script src="https://cdn.jsdelivr.net/npm/echarts@5/dist/echarts.min.js"></script>
</head>
<body>
    <div id="main" style="width: 800px;height:600px;"></div>
    <script type="text/javascript">
        var dom = document.getElementById("main");
        var chart = echarts.init(dom);
        option = {
            baseOption: {
                timeline: {
                    data: ['2020', '2021', '2022', '2023'],
                    axisType: 'category'
                },
                title: {
                    text: '示例雷达图'
                },
                tooltip: {},
                radar: {
                    name: {
                        textStyle: {
                            color: '#000',
                            fontSize: 20,
                            fontWeight: 'bold'
                        }
                    },
                    indicator: [
                        { name: '销售', max: 100 },
                        { name: '管理', max: 100 },
                        { name: '信息技术', max: 100 },
                        { name: '客户支持', max: 100 },
                        { name: '研发', max: 100 }
                    ]
                },
                series: [{
                    type: 'radar',
                    data: []
                }]
            },
            options: [
                {
                    series: [
                        {
                            data: [
                                {
                                    value: [Math.floor(Math.random() * 100), Math.floor(Math.random() * 100), Math.floor(Math.random() * 100), Math.floor(Math.random() * 100), Math.floor(Math.random() * 100)],
                                    name: '2002',
                                    label: {
                                        show: true,
                                        color: '#000',
                                        fontSize: 20,
                                        fontWeight: 'bold'
                                    }
                                }
                            ]
                        }
                    ]
                },
                {
                    series: [
                        {
                            data: [
                                {
                                    value: [Math.floor(Math.random() * 100), Math.floor(Math.random() * 100), Math.floor(Math.random() * 100), Math.floor(Math.random() * 100), Math.floor(Math.random() * 100)],
                                    name: '2003',
                                    label: {
                                        show: true,
                                        color: '#000',
                                        fontSize: 20,
                                        fontWeight: 'bold'
                                    }
                                }
                            ]
                        }
                    ]
                },
                {
                    series: [
                        {
                            data: [
                                {
                                    value: [Math.floor(Math.random() * 100), Math.floor(Math.random() * 100), Math.floor(Math.random() * 100), Math.floor(Math.random() * 100), Math.floor(Math.random() * 100)],
                                    name: '2004',
                                    label: {
                                        show: true,
                                        color: '#000',
                                        fontSize: 20,
                                        fontWeight: 'bold'
                                    }
                                }
                            ]
                        }
                    ]
                },
                {
                    series: [
                        {
                            data: [
                                {
                                    value: [Math.floor(Math.random() * 100), Math.floor(Math.random() * 100), Math.floor(Math.random() * 100), Math.floor(Math.random() * 100), Math.floor(Math.random() * 100)],
                                    name: '2005',
                                    label: {
                                        show: true,
                                        color: '#000',
                                        fontSize: 20,
                                        fontWeight: 'bold'
                                    }
                                }
                            ]
                        }
                    ]
                }
            ]
        };

        chart.setOption(option);
    </script>
</body>
</html>
将代码保存为HTML文件打开即可。

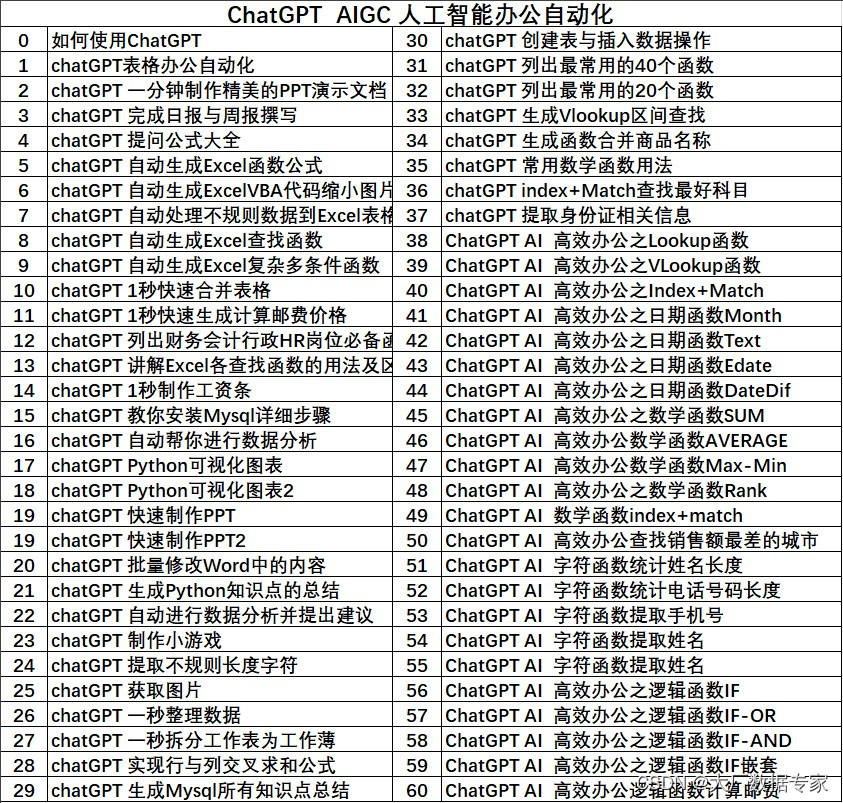
更多 AIGC ChatGPT 案例实战 http://t.csdn.cn/zBytu


![[谦实思纪 02]整理自2023雷军年度演讲——《成长》(下篇)创业之旅(创业与成长)](https://img-blog.csdnimg.cn/2bdaf9af8f31446cb3cb3e5cf6aa6b02.png)