文章目录
- 数据分析四剑客
- Numpy
- ndarray
- 数组和标量之间的运算
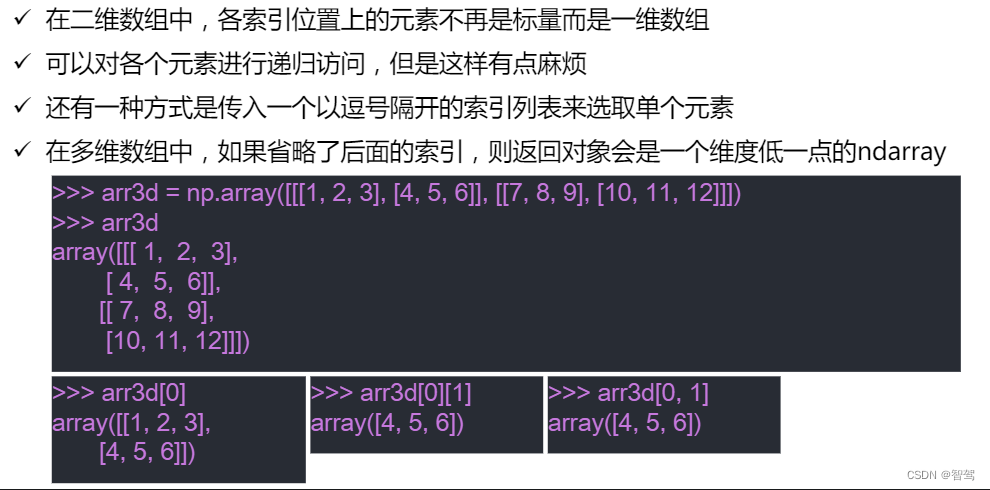
- 基本的索引和切片
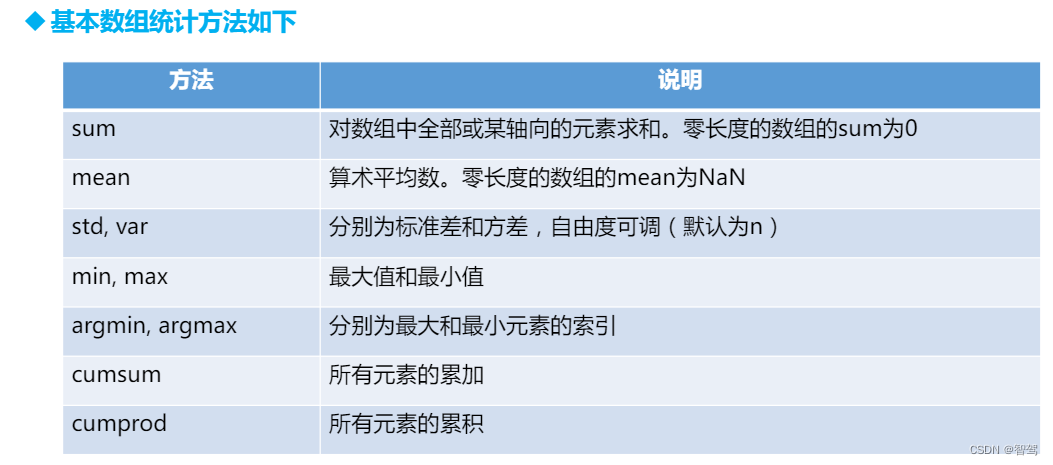
- 数学和统计方法
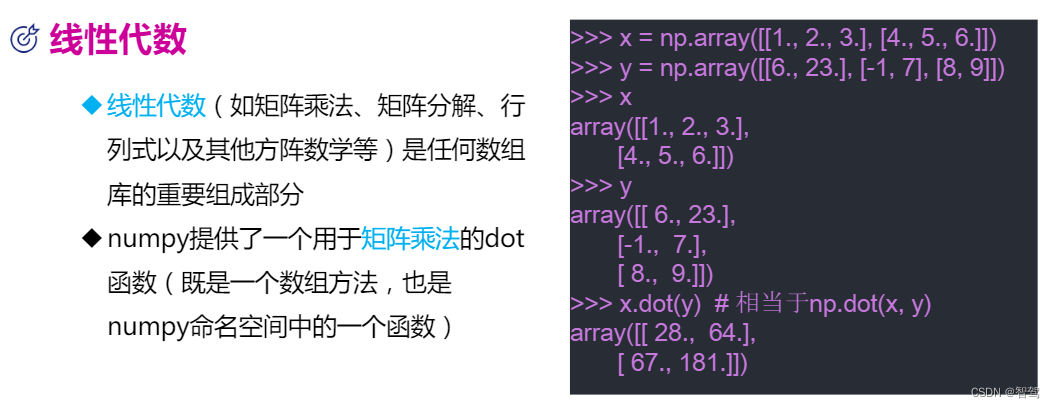
- 线性代数
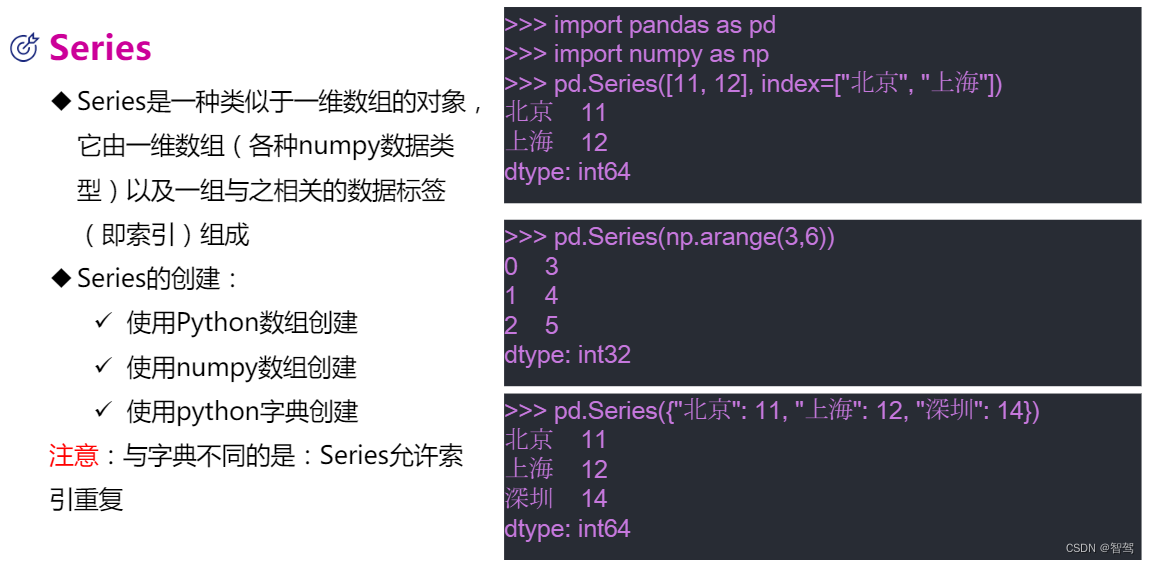
- Pandas
- Matplotlib
- PIL
数据分析四剑客
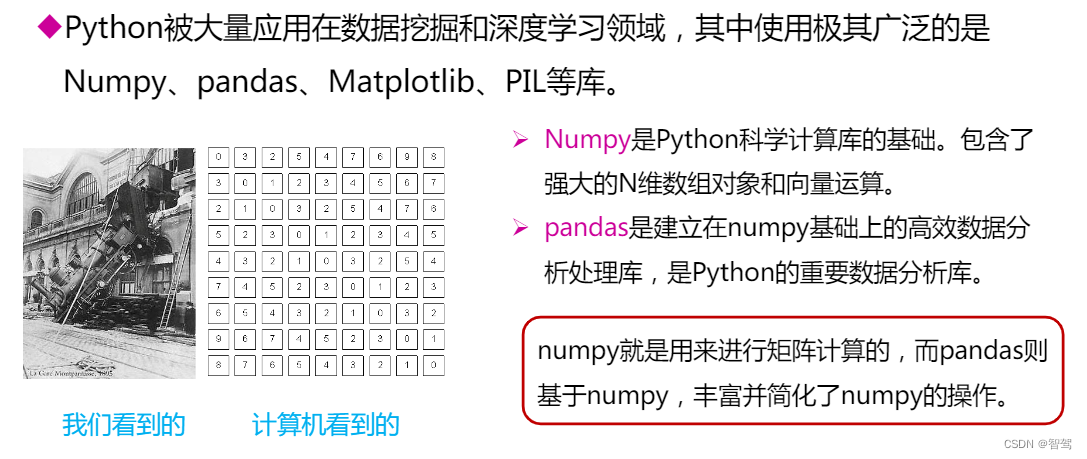

Numpy
Numpy中文网

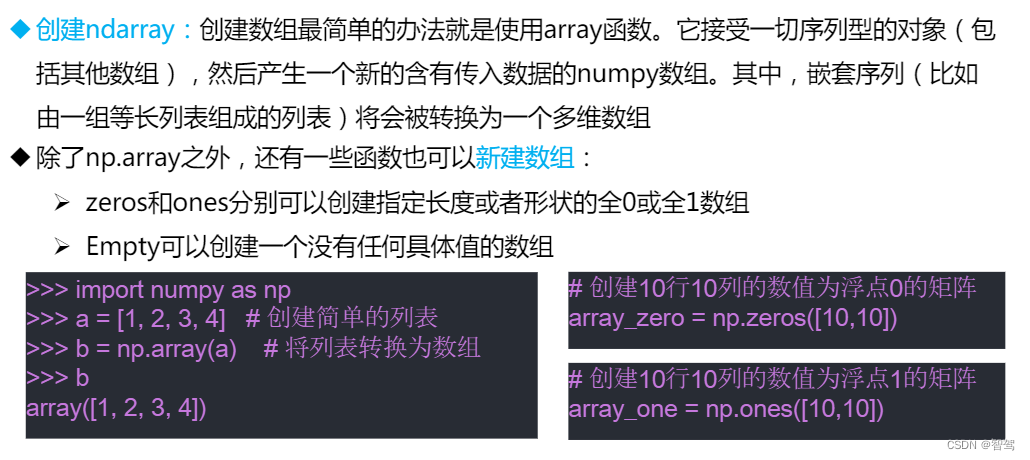
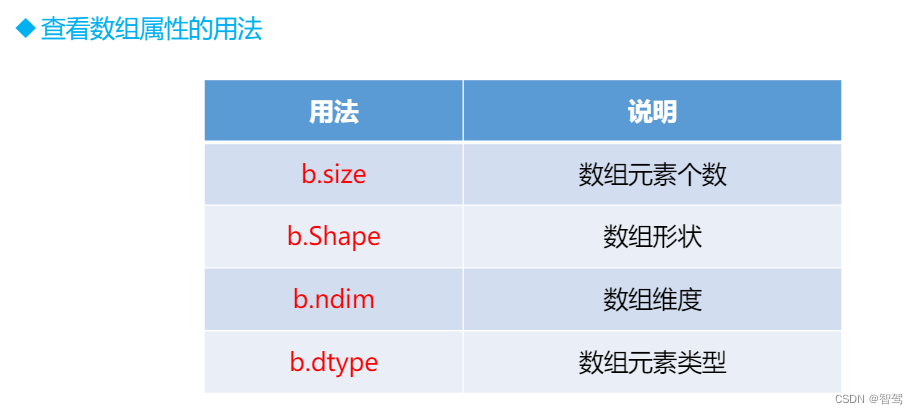
ndarray

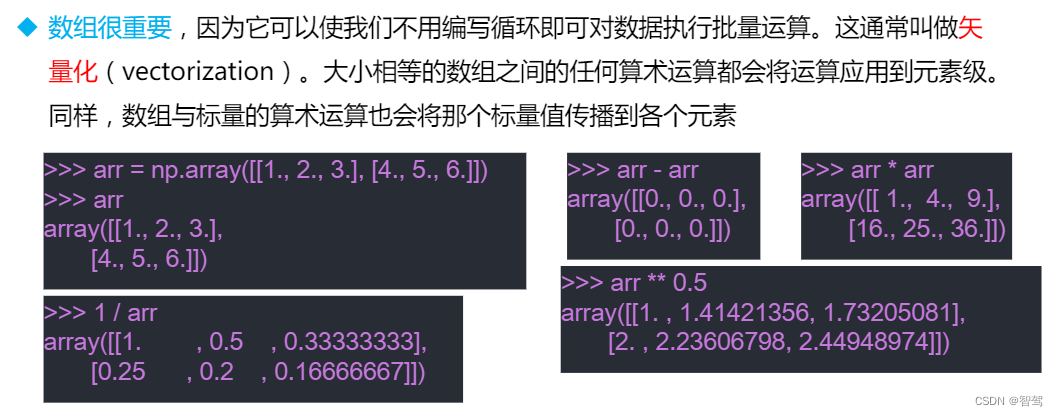
数组和标量之间的运算
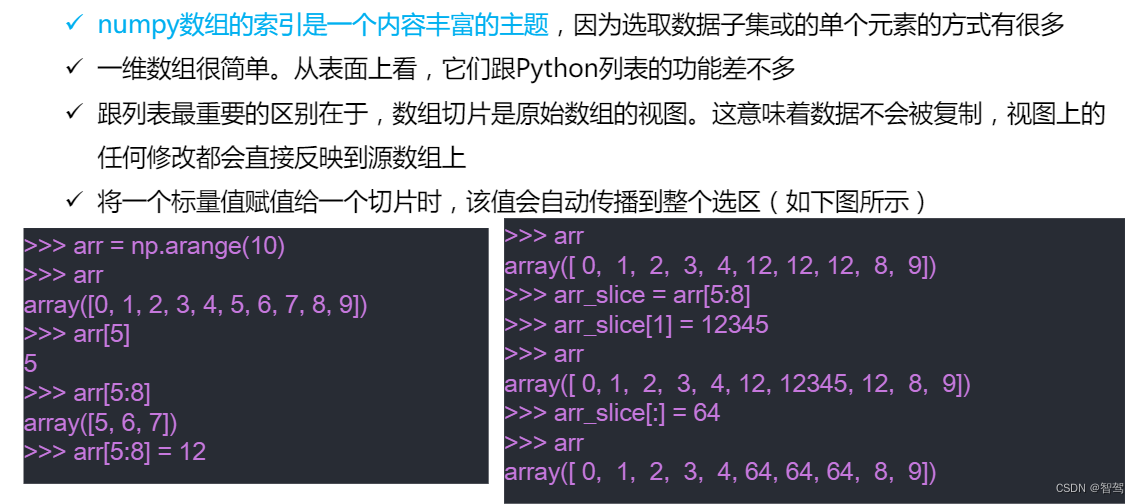
基本的索引和切片
数学和统计方法


线性代数

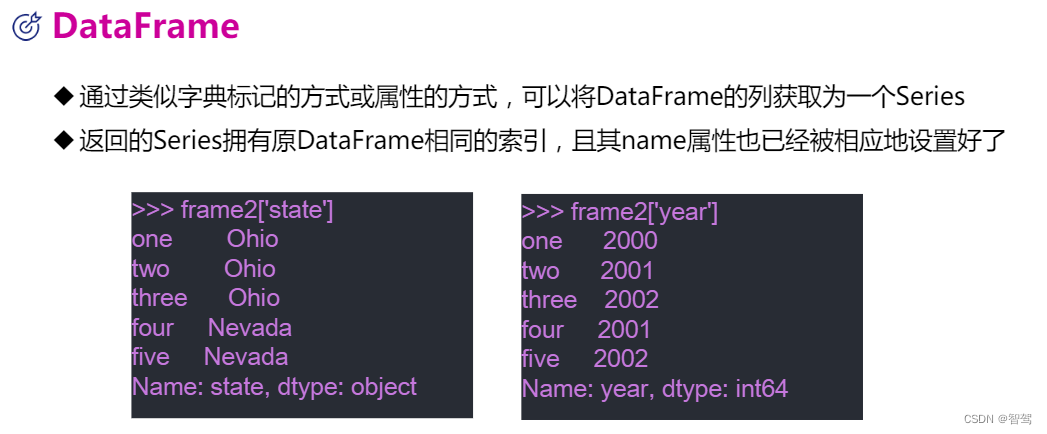
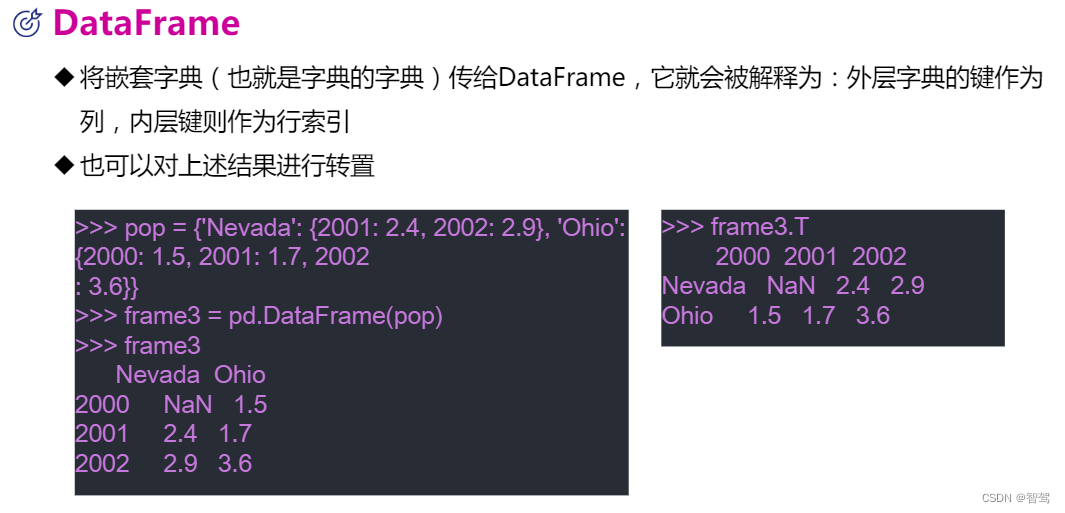
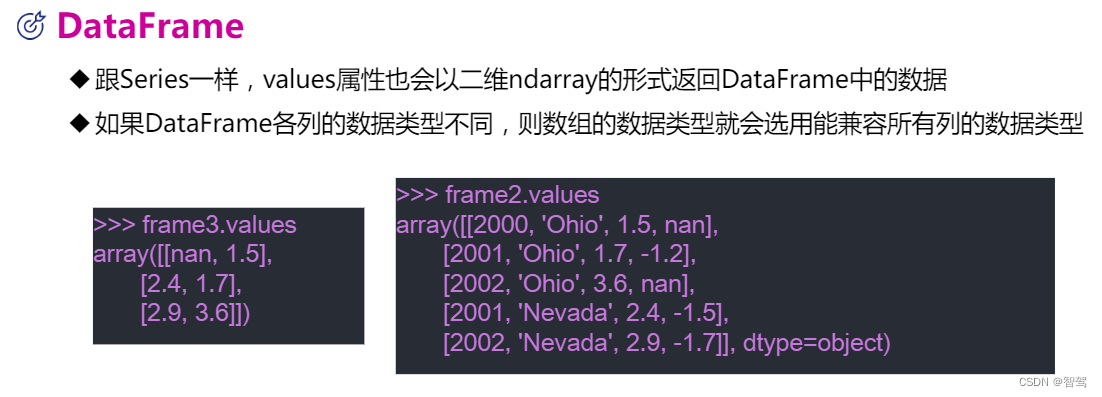
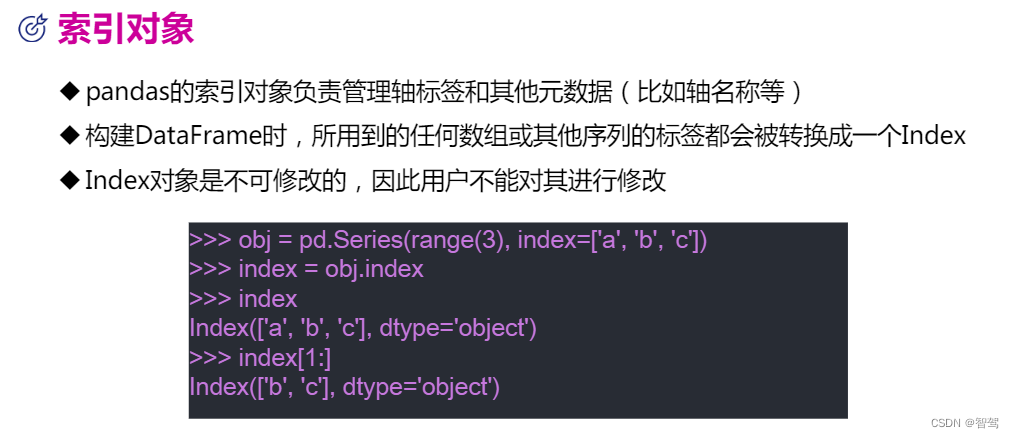
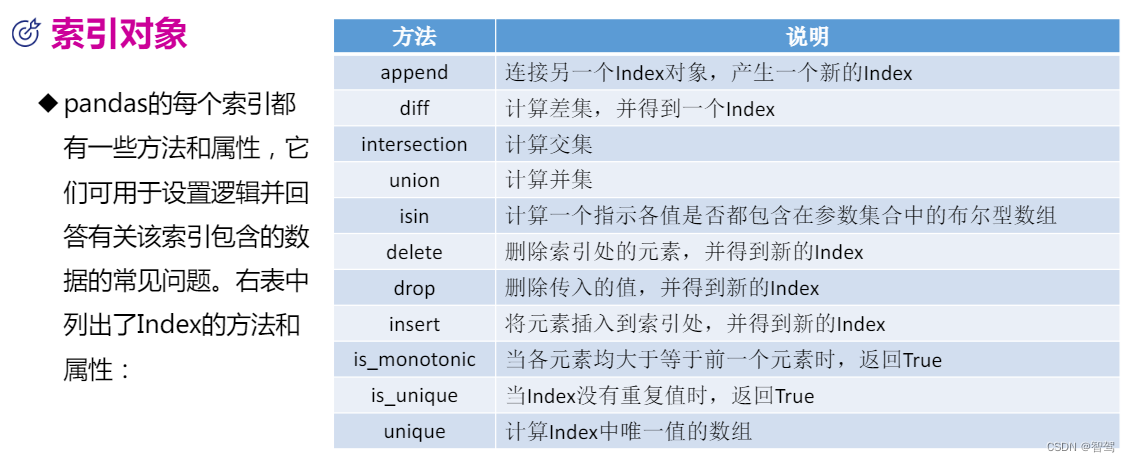
Pandas
Pandas中文网


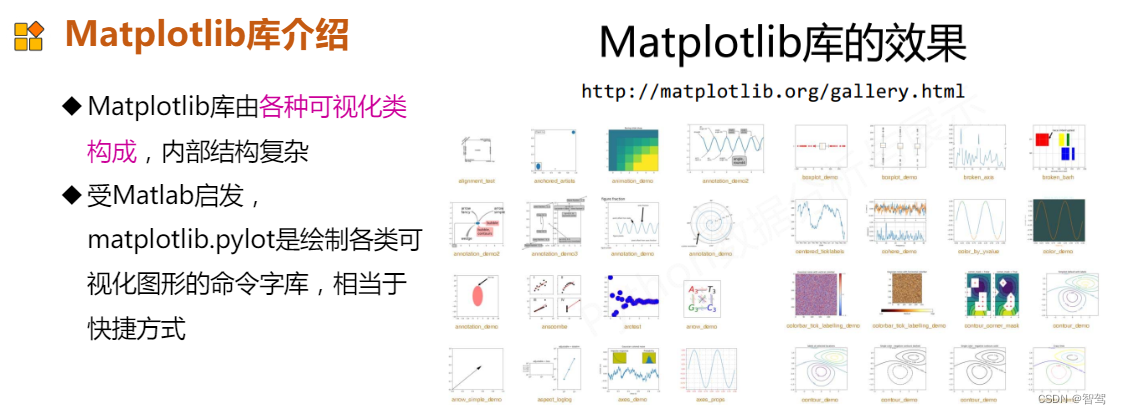
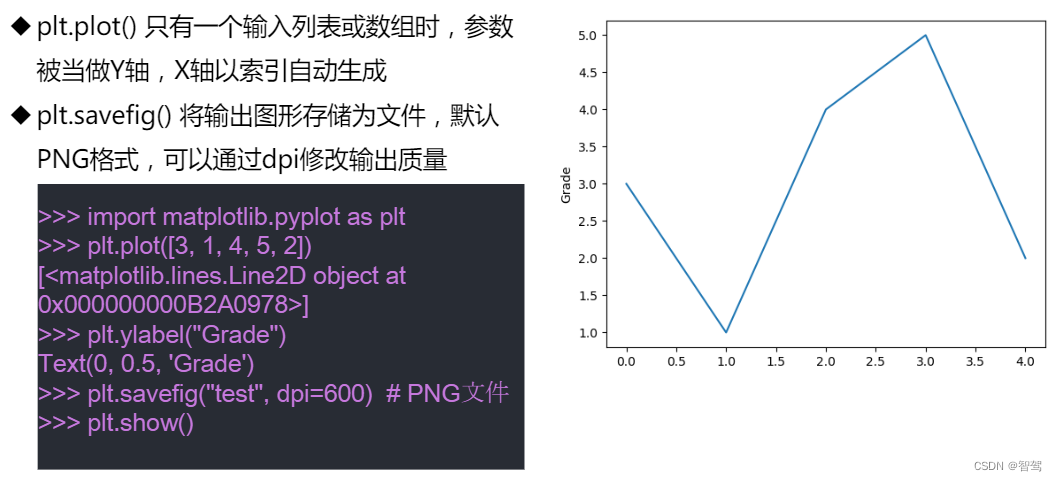
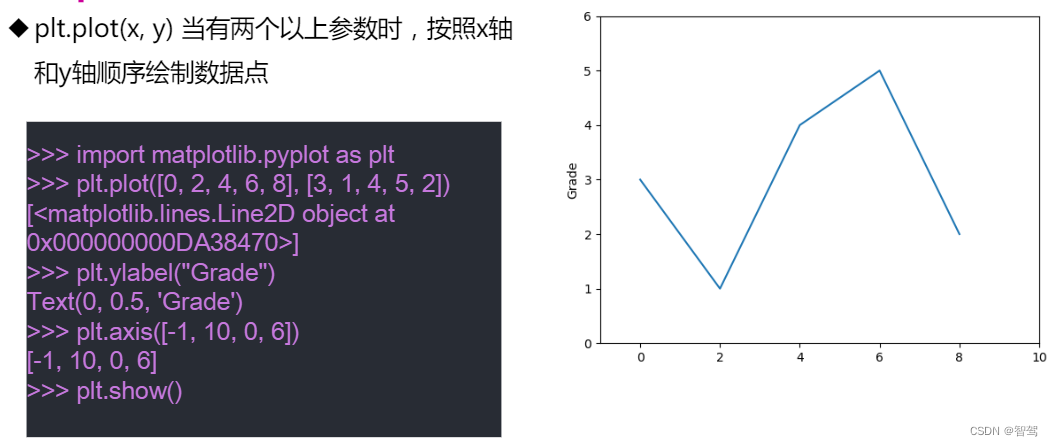
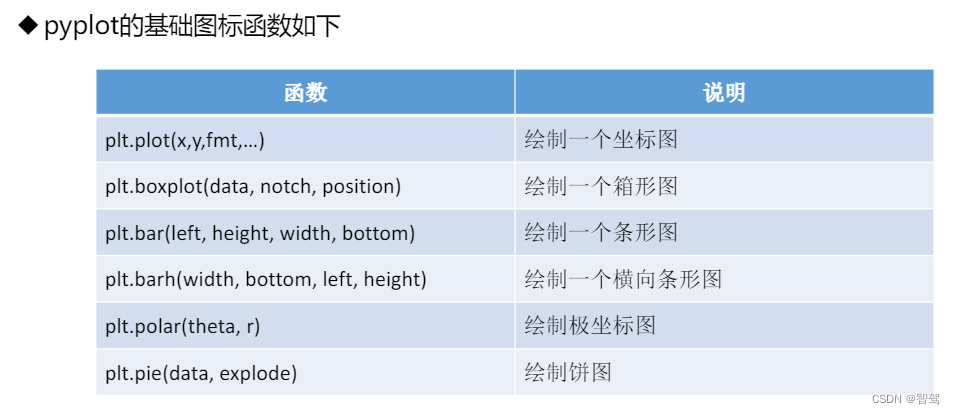
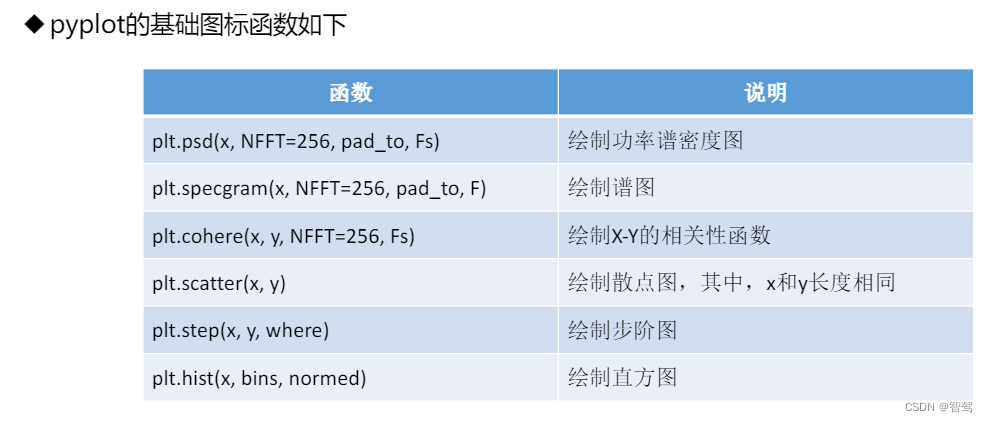
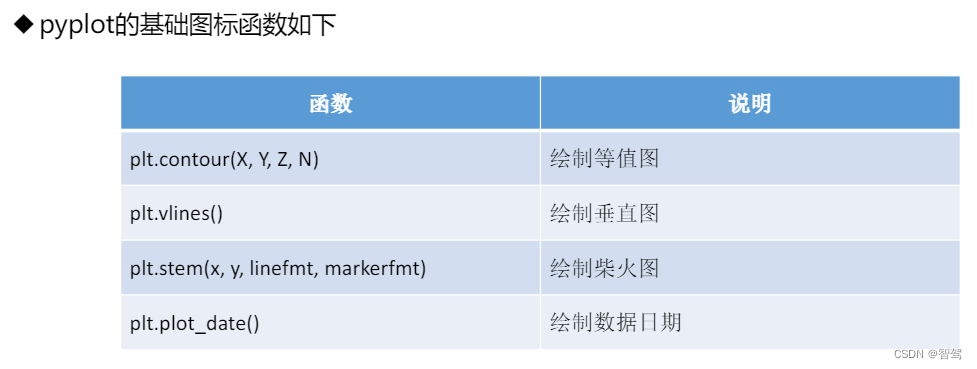
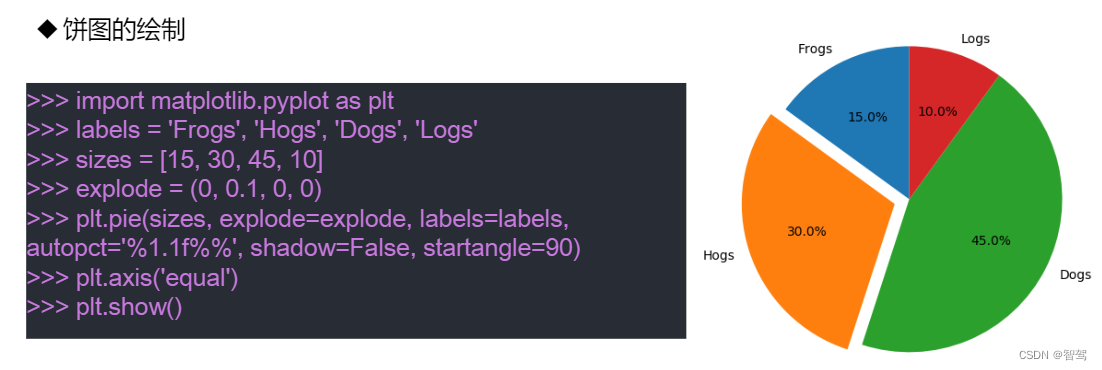
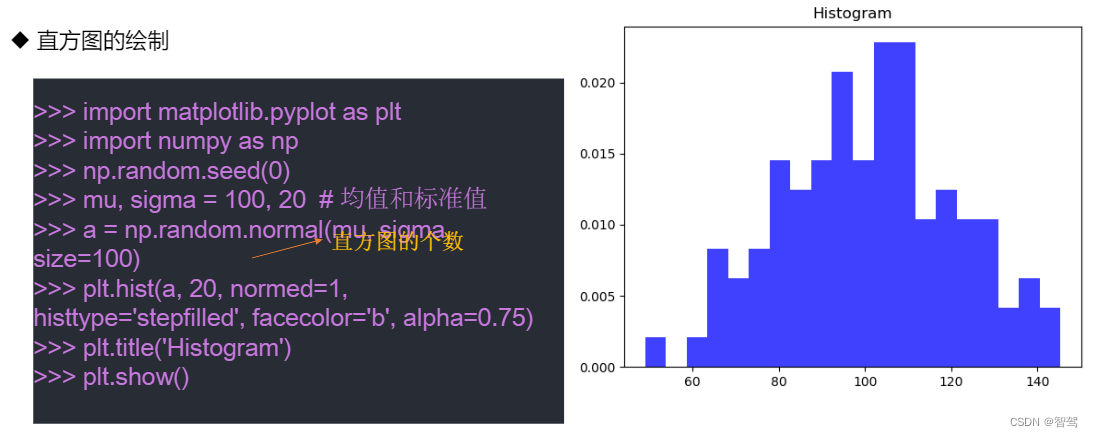
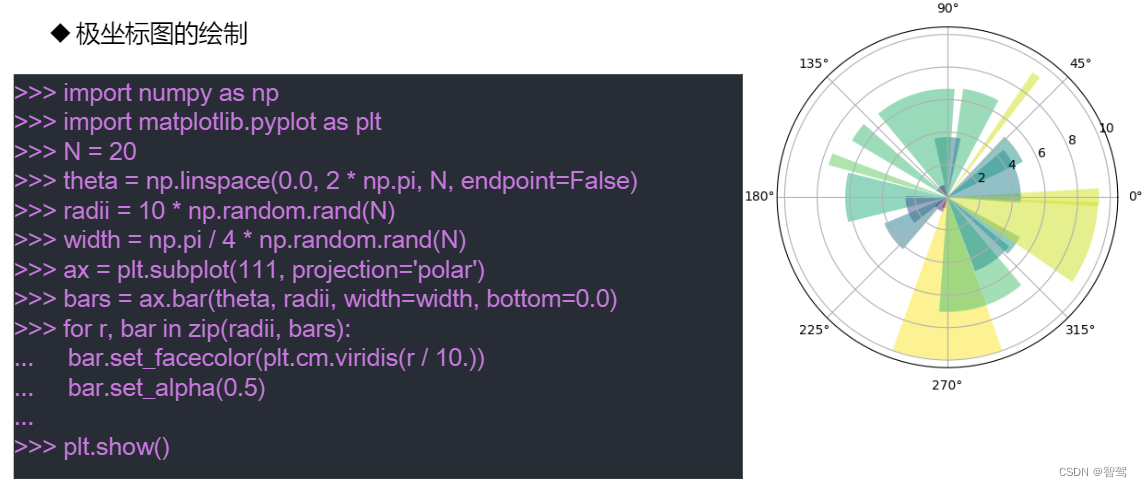
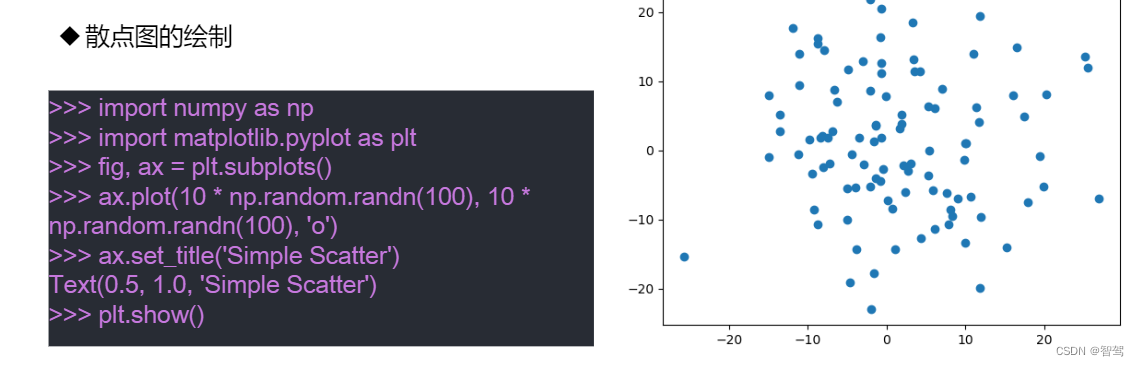
Matplotlib
Matplotlib中文网
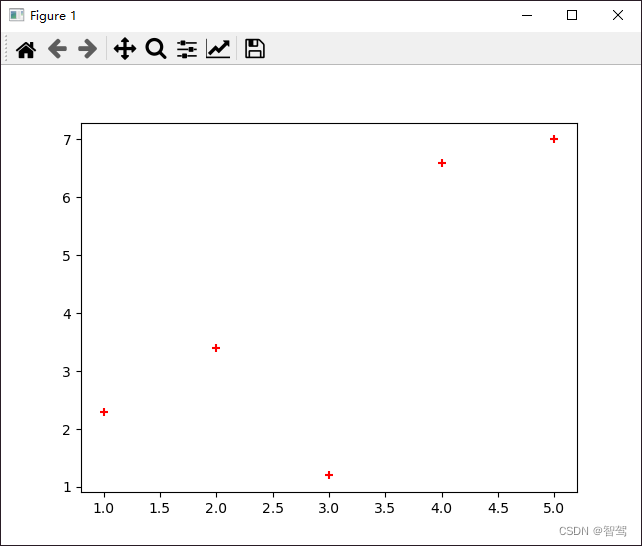
>>> import matplotlib.pyplot as plt
>>> x = [1, 2, 3, 4, 5]
>>> y = [2.3, 3.4, 1.2, 6.6, 7.0]
>>> plt.scatter(x, y, color='r', marker='+')
>>> plt.show()
PIL
Pillow
Pillow(PIL)入门教程(非常详细)