pieChart ( id ) {
const data = { value : 100 , type : 'aaa' }
let angle = 0 ;
let count = echarts. init ( document. getElementById ( id) ) ;
let option = {
title : [
{
text : "{a|" + data. value + "}{c|%}" ,
x : "center" ,
y : "center" ,
textStyle : {
rich : {
a : {
fontSize : 20 ,
color : "#27bac1" ,
fontWeight : "bold" ,
fontStyle : "italic" ,
} ,
c : {
fontSize : 20 ,
color : "#27bac1" ,
fontWeight : "bold" ,
fontStyle : "italic" ,
} ,
} ,
} ,
} ,
{
zlevel : 1 ,
text : data. type,
top : "bottom" ,
left : "46%" ,
textAlign : "center" ,
textStyle : { color : "#fff" , fontSize : 16 , fontWeight : "350" } ,
} ,
] ,
grid : {
top : 0 ,
left : 0 ,
bottom : "2%" ,
containLabel : true ,
} ,
series : [
{
name : "" ,
type : "custom" ,
coordinateSystem : "none" ,
renderItem : function ( params, api ) {
return {
type : "arc" ,
shape : {
cx : api. getWidth ( ) / 2 ,
cy : api. getHeight ( ) / 2 ,
r : ( Math. min ( api. getWidth ( ) , api. getHeight ( ) ) / 1.5 ) * 0.53 ,
startAngle : ( ( 0 + - angle) * Math. PI ) / 180 ,
endAngle : ( ( 360 + - angle) * Math. PI ) / 180 ,
} ,
style : {
stroke : "#1fddf7" ,
fill : "transparent" ,
lineWidth : 0.5 ,
} ,
silent : true ,
} ;
} ,
data : [ 0 ] ,
backgroundStyle : {
color : "#212b3a" ,
} ,
} ,
{
name : "" ,
type : "pie" ,
radius : [ "40%" , "60%" ] ,
silent : true ,
animationDuration : 2000 ,
clockwise : true ,
startAngle : 90 ,
z : 0 ,
zlevel : 0 ,
label : {
normal : {
position : "center" ,
} ,
} ,
data : [
{
value : data. value,
name : "" ,
itemStyle : {
normal : {
color : {
colorStops : [
{
offset : 0 ,
color : "#18f3c0" ,
} ,
{
offset : 1 ,
color : "#1fddf7" ,
} ,
] ,
} ,
} ,
} ,
} ,
{
value : 100 - data. value,
name : "" ,
label : {
normal : {
show : false ,
} ,
} ,
itemStyle : {
normal : {
color : "#173164" ,
} ,
} ,
} ,
] ,
} ,
{
name : "" ,
type : "gauge" ,
radius : "60%" ,
center : [ "50%" , "50%" ] ,
startAngle : 0 ,
endAngle : 359.9 ,
splitNumber : 12 ,
hoverAnimation : true ,
axisTick : {
show : false ,
} ,
splitLine : {
length : "110%" ,
lineStyle : {
width : 2 ,
color : "#000c26" ,
} ,
} ,
axisLabel : {
show : false ,
} ,
pointer : {
show : false ,
} ,
axisLine : {
lineStyle : {
opacity : 0 ,
} ,
} ,
detail : {
show : false ,
} ,
data : [
{
value : 0 ,
name : "" ,
} ,
] ,
} ,
] ,
} ;
count. setOption ( option) ;
window. addEventListener ( "resize" , ( ) => {
if ( count) {
count. resize ( ) ;
}
} ) ;
} ,
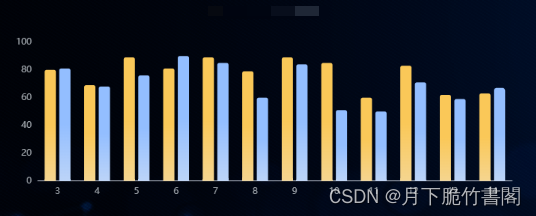
barChart ( id, data ) {
let count = echarts. init ( document. getElementById ( id) ) ;
let option = {
color : [
{
type : "linear" ,
x : 0 ,
y : 0 ,
x2 : 0 ,
y2 : 1 ,
colorStops : [
{
offset : 0 ,
color : "#fac858" ,
} ,
{
offset : 0.5 ,
color : "#fac858" ,
} ,
{
offset : 1 ,
color : "#f5d58f" ,
} ,
] ,
globalCoord : false ,
} ,
{
type : "linear" ,
x : 0 ,
y : 0 ,
x2 : 0 ,
y2 : 1 ,
colorStops : [
{
offset : 0 ,
color : "#93beff" ,
} ,
{
offset : 0.5 ,
color : "#93beff" ,
} ,
{
offset : 1 ,
color : "#bcd4f8" ,
} ,
] ,
globalCoord : false ,
} ,
] ,
tooltip : {
trigger : "axis" ,
axisPointer : {
type : "shadow" ,
} ,
} ,
legend : {
top : "4%" ,
itemWidth : 18 ,
itemHeight : 5 ,
textStyle : {
color : "#C8DBF4" ,
} ,
} ,
grid : {
width : "99%" ,
height : "75%" ,
left : 0 ,
bottom : "2%" ,
containLabel : true ,
} ,
xAxis : {
type : "category" ,
data : data[ 0 ] . xAxis,
axisLine : {
lineStyle : {
color : "#cdd5e2" ,
} ,
} ,
splitLine : {
show : false ,
} ,
axisTick : {
show : false ,
} ,
axisLabel : {
textStyle : {
color : "#a0a6ac" ,
} ,
} ,
} ,
yAxis : {
type : "value" ,
axisLine : {
show : false ,
lineStyle : {
color : "#cdd5e2" ,
} ,
} ,
splitLine : {
show : false ,
} ,
axisTick : {
show : false ,
} ,
axisLabel : {
textStyle : {
color : "#a0a6ac" ,
} ,
} ,
} ,
series : data. map ( ( { name, value } ) => {
return {
name,
type : "bar" ,
data : value,
barMaxWidth : 15 ,
animationDuration : 2000 ,
itemStyle : {
normal : {
barBorderRadius : [ 3 , 3 , 0 , 0 ] ,
} ,
} ,
} ;
} ) ,
} ;
count. setOption ( option) ;
window. addEventListener ( "resize" , ( ) => {
if ( count) {
count. resize ( ) ;
}
} ) ;
} ,