下载docker镜像
docker pull prom/prometheus
docker pull prom/node-exporter
启动
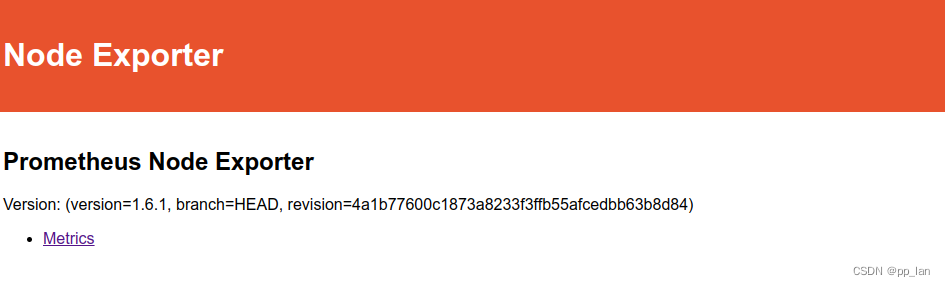
node-exporter
该程序用以采集机器内存等数据
启动脚本
docker run -d -p 9100:9100  prom/node-exporter
ss -anptl | grep 9100
启动截图
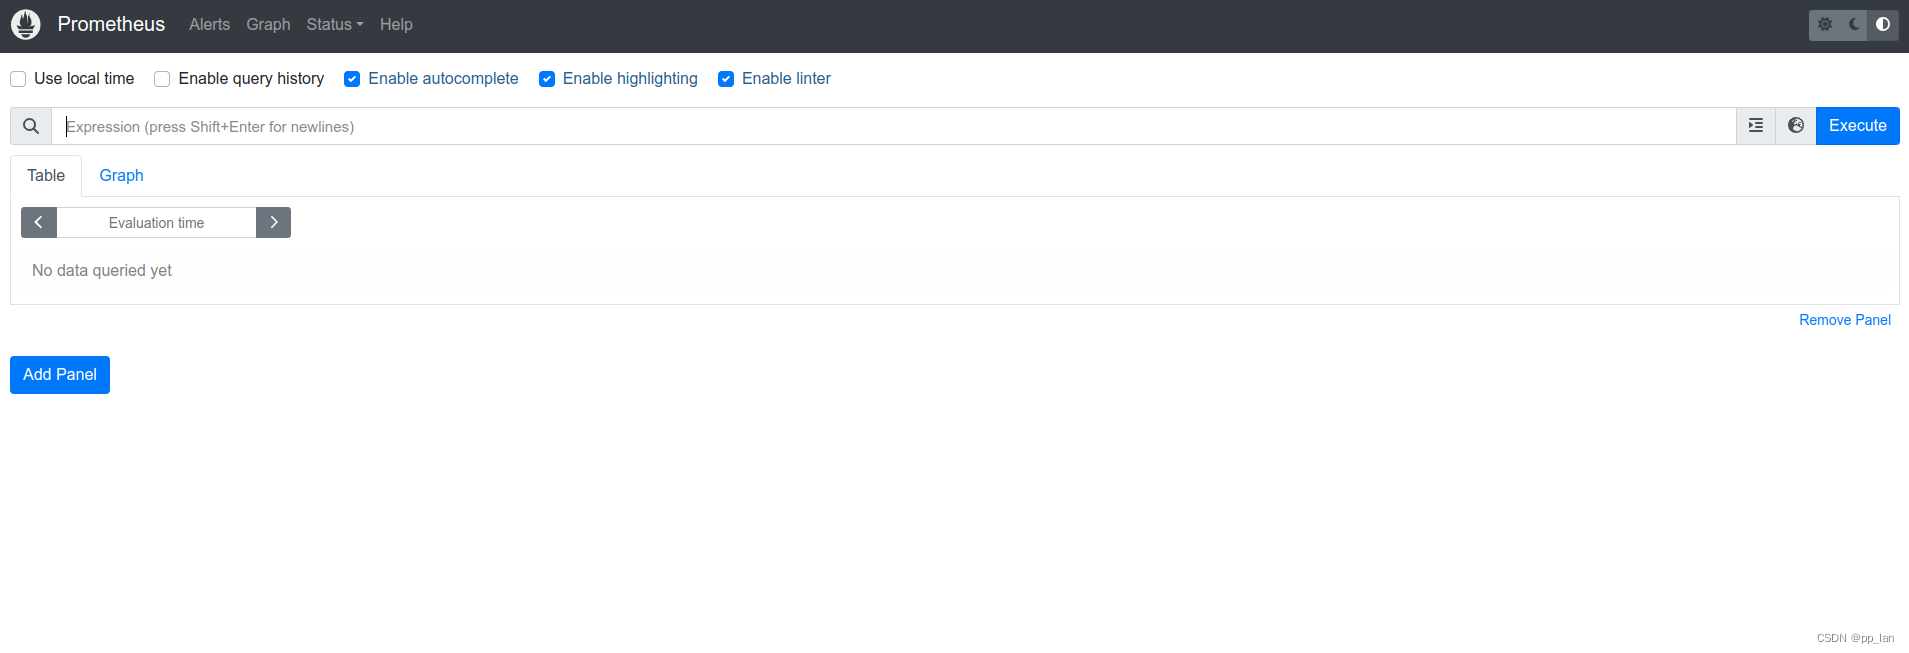
prometheus
启动脚本
# 3b907f5313b7 为镜像id
docker run -d --name prometheus -p 9090:9090 3b907f5313b7
启动截图
映射配置文件及自定义配置
复制配置文件
配置存放路径此处以/opt/start/prometheus/conf/prometheus为例
cd /opt/start/prometheus/conf/prometheus
# 进入容器
docker exec -it prometheus /bin/sh
# 到目的文件夹下执行命令进行复制
docker cp grafana:/usr/share/grafana/conf/defaults.ini ./
停止任务并删除容器
docker stop prometheus
docker rm prometheus
修改配置prometheus.yml
- 查看node-exporter网络地址
docker inspect node-exporter |grep Address
- 修改配置
vim /opt/start/prometheus/conf/prometheus/prometheus.yml
修改配置(job_name和targets),其中targets为为上面安装的node-exporter对应的网络地址
# my global config
global:
  scrape_interval: 15s # Set the scrape interval to every 15 seconds. Default is every 1 minute.
  evaluation_interval: 15s # Evaluate rules every 15 seconds. The default is every 1 minute.
  # scrape_timeout is set to the global default (10s).

# Alertmanager configuration
alerting:
  alertmanagers:
    - static_configs:
        - targets:
          # - alertmanager:9093

# Load rules once and periodically evaluate them according to the global 'evaluation_interval'.
rule_files:
  # - "first_rules.yml"
  # - "second_rules.yml"

# A scrape configuration containing exactly one endpoint to scrape:
# Here it's Prometheus itself.
scrape_configs:
  # The job name is added as a label `job=<job_name>` to any timeseries scraped from this config.
  - job_name: "prometheus"

    # metrics_path defaults to '/metrics'
    # scheme defaults to 'http'.

    static_configs:
      - targets: ["172.17.0.4:9100"]
创建容器(带文件映射,方便后续修改配置)
# 最后面为镜像id,也可以通过REPOSITORY:TAG来替换
docker run -d --name prometheus -v /opt/start/prometheus/conf/prometheus/prometheus.yml:/etc/prometheus/prometheus.yml -p 9090:9090 3b907f5313b7

# 查看运行状态
docker ps
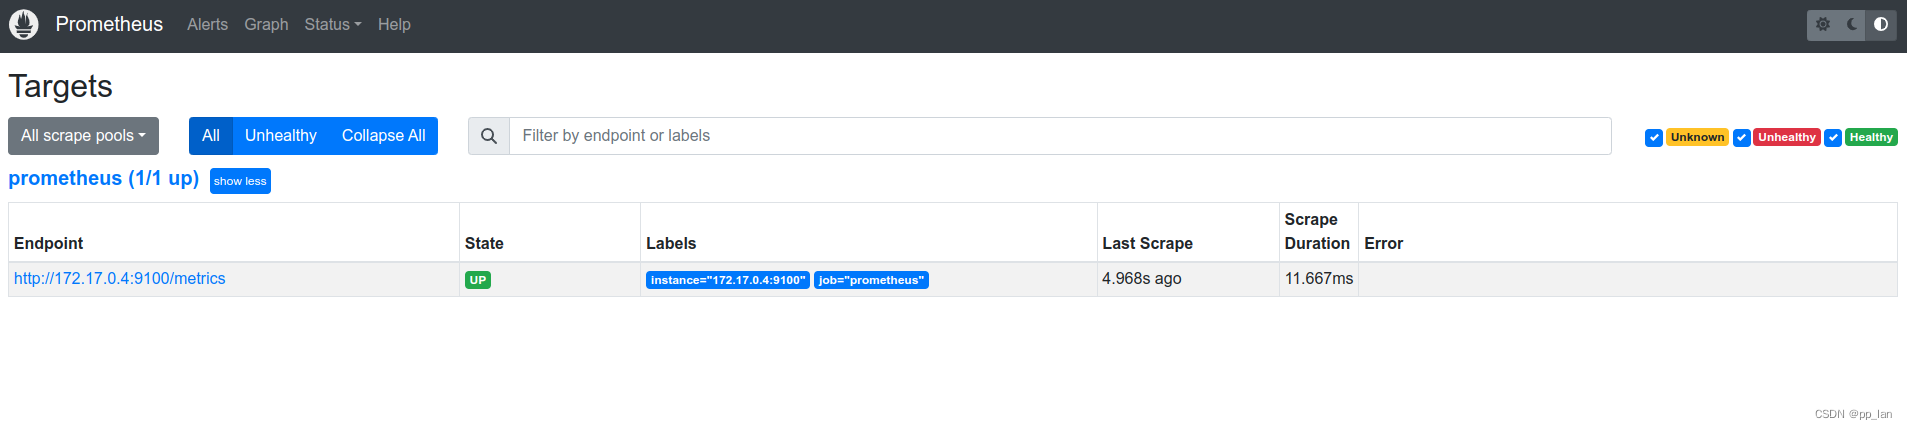
检查状态
- 登录prometheus界面(ip:9090)
- 点击status -> targets, 查看Status, Up表示正常