在这里,您将发现大量示例图,其中包含生成它们的代码。
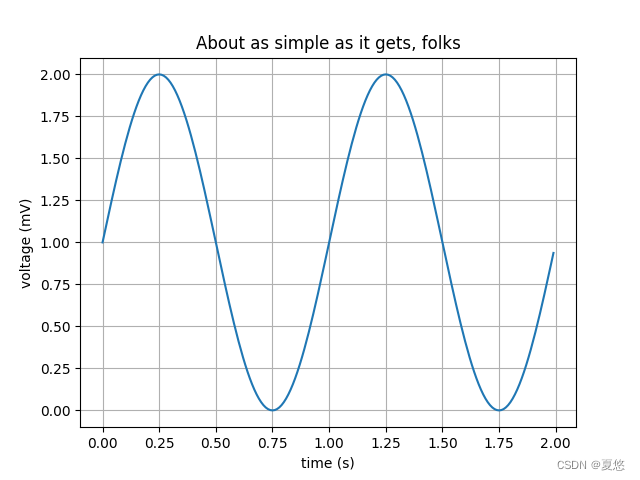
线图(Line Plot)
下面是如何使用plot()创建带有文本标签的线图。
Fig. 1: Simple Plot
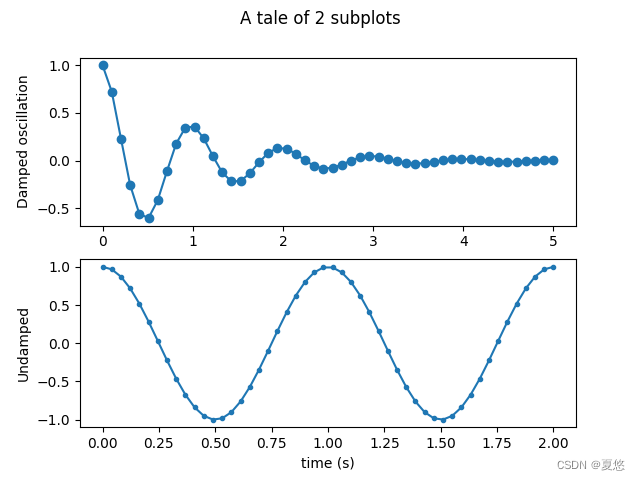
多个绘图区域(Multiple subplots in one figure)
多个绘图区域由subplot()函数创建:
Fig. 2: Subplot
图像(Images)
Matplotlib可以使用imshow()函数显示图像(假设刻度相等)。
Fig. 3: Example of using imshow() to display a CT scan

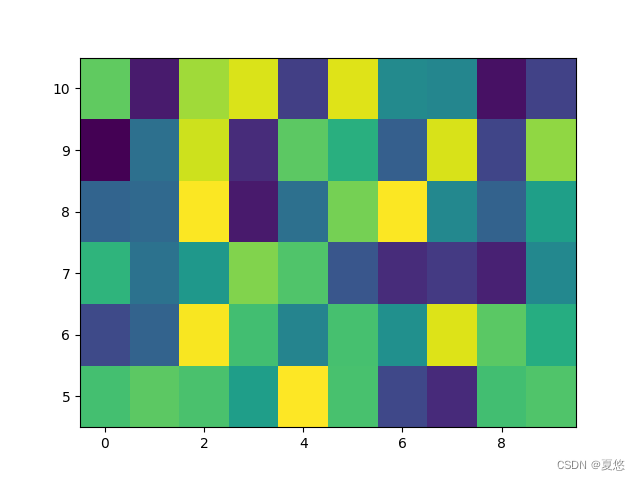
轮廓与伪彩色(Contouring and pseudocolor)
Pcolormesh()函数可以对二维数组进行着色表示,即使x轴和y轴的刻度不相同。contour()(等高线)函数是表示samedata的另一种方法:
Fig. 4: Example comparing pcolormesh() and contour() for plotting two-dimensional data
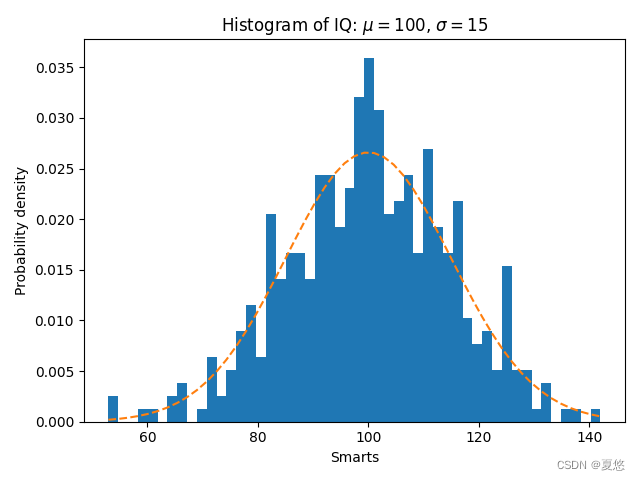
直方图(Histograms)
hist()函数自动生成直方图并返回bin计数或概率:
Fig. 5: Histogram Features


![[附源码]Python计算机毕业设计SSM基于框架预约挂号系统(程序+LW)](https://img-blog.csdnimg.cn/07743ee7d0ce48e1877470945a4b09b9.png)