包括构造数据集、正则化、交叉验证
1.构造数据集
from sklearn import datasets
import matplotlib.pyplot as plt
#构造数据
#用函数来建立 100 个 sample,有一个 feature,和一个 target,这样比较方便可视化。
X, y = datasets.make_regression(n_samples=100, n_features=1, n_targets=1, noise=10)
plt.scatter(X, y)
plt.show()
#noise越大点就会越来越离散,例如 noise 由 10 变为 50.
X, y = datasets.make_regression(n_samples=100, n_features=1, n_targets=1, noise=50)
plt.scatter(X, y)
plt.show()

2.正则化
#正则化
from sklearn import preprocessing #标准化数据模块
import numpy as np
#建立Array
a = np.array([[10, 2.7, 3.6],
              [-100, 5, -2],
              [120, 20, 40]], dtype=np.float64)

#将normalized后的a打印出
print(preprocessing.scale(a))
# [[ 0.         -0.85170713 -0.55138018]
#  [-1.22474487 -0.55187146 -0.852133  ]
#  [ 1.22474487  1.40357859  1.40351318]]
#数据标准化对机器学习成效的影响
# 标准化数据模块
from sklearn import preprocessing
import numpy as np
# 将资料分割成train与test的模块
from sklearn.model_selection import train_test_split
# 生成适合做classification资料的模块
from sklearn import datasets
# Support Vector Machine中的Support Vector Classifier
from sklearn.svm import SVC
# 可视化数据的模块
import matplotlib.pyplot as plt
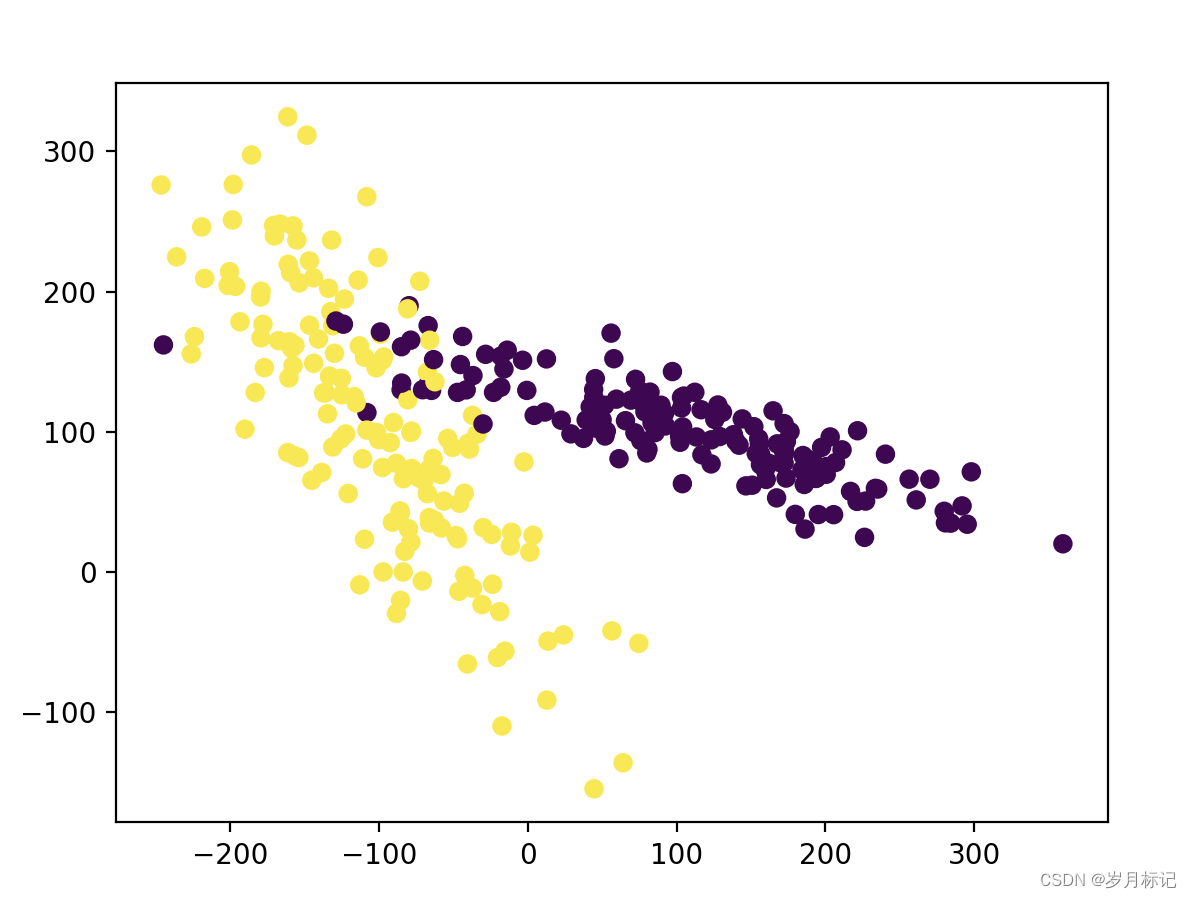
#生成具有2种属性的300笔数据
X, y = datasets.make_classification(
n_samples=300, n_features=2,
n_redundant=0, n_informative=2,
random_state=22, n_clusters_per_class=1,
scale=100)
#可视化数据
plt.scatter(X[:, 0], X[:, 1], c=y)
plt.show()
#标准化前准确率
X_train, X_test, y_train, y_test = train_test_split(X, y, test_size=0.3)
clf = SVC()
clf.fit(X_train, y_train)
print(clf.score(X_test, y_test))
# 0.477777777778(0.91)
#标准化后准确率
X = preprocessing.scale(X)
X_train, X_test, y_train, y_test = train_test_split(X, y, test_size=0.3)
clf = SVC()
clf.fit(X_train, y_train)
print(clf.score(X_test, y_test))
# 0.9(0.97)
3.交叉验证
基础验证
from sklearn.datasets import load_iris # iris数据集
from sklearn.model_selection import train_test_split # 分割数据模块
from sklearn.neighbors import KNeighborsClassifier # K最近邻(kNN,k-NearestNeighbor)分类算法
#加载iris数据集
iris = load_iris()
X = iris.data
y = iris.target
#分割数据并
X_train, X_test, y_train, y_test = train_test_split(X, y, random_state=4)
#建立模型
knn = KNeighborsClassifier()
#训练模型
knn.fit(X_train, y_train)
#将准确率打印出
print(knn.score(X_test, y_test))
# 0.973684210526
交叉验证
一般来说,准确率(accuracy)会用于判断分类(Classification)模型的好坏,平均方差(Mean squared error)会用于判断回归(Regression)模型的好坏。
#一般来说准确率(accuracy)会用于判断分类(Classification)模型的好坏
from sklearn.model_selection import cross_val_score # K折交叉验证模块
#使用K折交叉验证模块
scores = cross_val_score(knn, X, y, cv=5, scoring='accuracy')
#将5次的预测准确率打印
print(scores)
# [ 0.96666667  1.          0.93333333  0.96666667  1.        ]
#将5次的预测准确平均率打印出
print(scores.mean())
# 0.973333333333

#一般来说平均方差(Mean squared error)会用于判断回归(Regression)模型的好坏
from sklearn.model_selection import cross_val_score # K折交叉验证模块
loss = -cross_val_score(knn, X, y, cv=10, scoring='neg_mean_squared_error')
print(loss)
#[0.         0.06666667 0.         0.         0.13333333 0.06666667
# 0.06666667 0.         0.         0.        ]
#将10次的预测损失打印
print(loss.mean())
# 0.03333333333333333

