1 图中自定义选择区间, 手动鼠标拉取区间显示

2 底部数据选择条
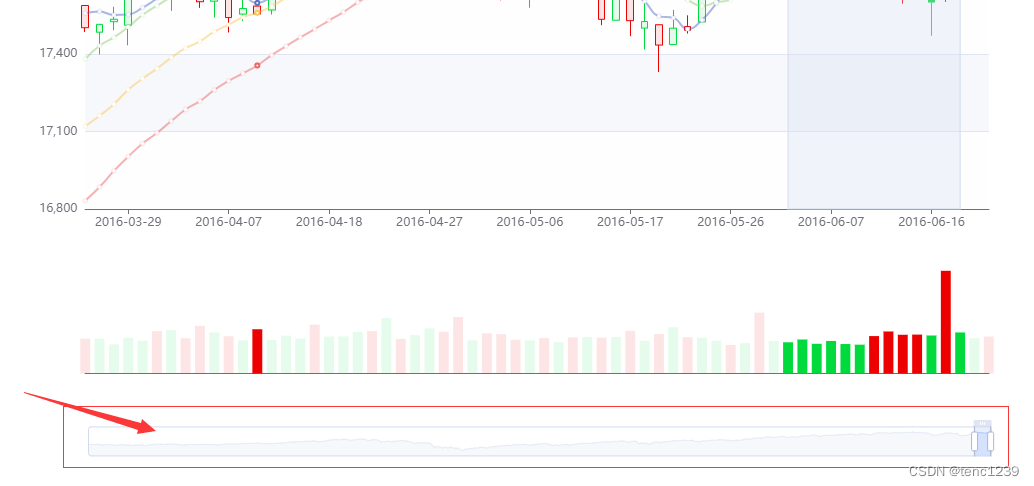
dataZoom: [
        {
          type: 'inside',
          xAxisIndex: [0, 1],
          start: 98,
          end: 100
        },
        {
          show: true, // 这个是打开数据 选择条
          xAxisIndex: [0, 1],
          type: 'slider',
          top: '85%',
          start: 98,
          end: 100
        }
      ],
3 鼠标在 k线图 选择区域 显示 的工具

toolbox: {
        feature: {
          dataZoom: {
            yAxisIndex: false
          },
          brush: {
            type: ['lineX', 'clear']
          }
        }
        left: 100
      },
4 图像上 选取框 常亮
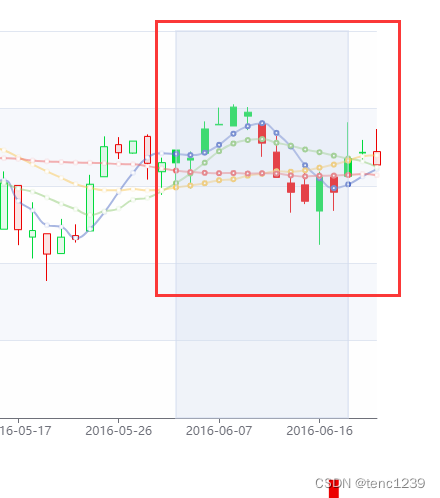
// 1 在 option 中设置
brush: {
        xAxisIndex: 'all',
        brushLink: 'all',
        outOfBrush: {
          colorAlpha:0.5 // K线颜色
        }

// 2 在myChart.setOption(this.option, true) 之后
  myChart.dispatchAction({
    type: 'brush',
    areas: [
      {
        brushType: 'lineX',
        coordRange: ['2016-06-02', '2016-06-20'],
        xAxisIndex: 0
      }
    ]
  });

![[论文总结]YOLO v1、YOLO v2、YOLO v3、YOLO v4、YOLOv5](https://img-blog.csdnimg.cn/883af388b4ce4f1e94e381079c6fba26.png)


![商业海外社交媒体营销10步指南 [2023]](https://img-blog.csdnimg.cn/img_convert/ec6d5dd11ec57e4b36919ac308f113cb.png)