目录
Springboot 相关
Pom
重点包
如果有需要可以增加安全包-一般内部机房没啥事-(非必选)
Application.yml配置文件-(非必选)
Application.properties
management.endpoints.web.exposure.include介绍
启动类
查看监控信息
Prometheus
Prometheus.yml 配置
如果使用类安全包-(非必选)
启动就可以看到了
Grafana 模板 12900
一、报告模板内容
二、设置告警邮件接收人
三、邮箱发送人配置(找个自己常用的邮箱开启smtp相关权限配置即可)
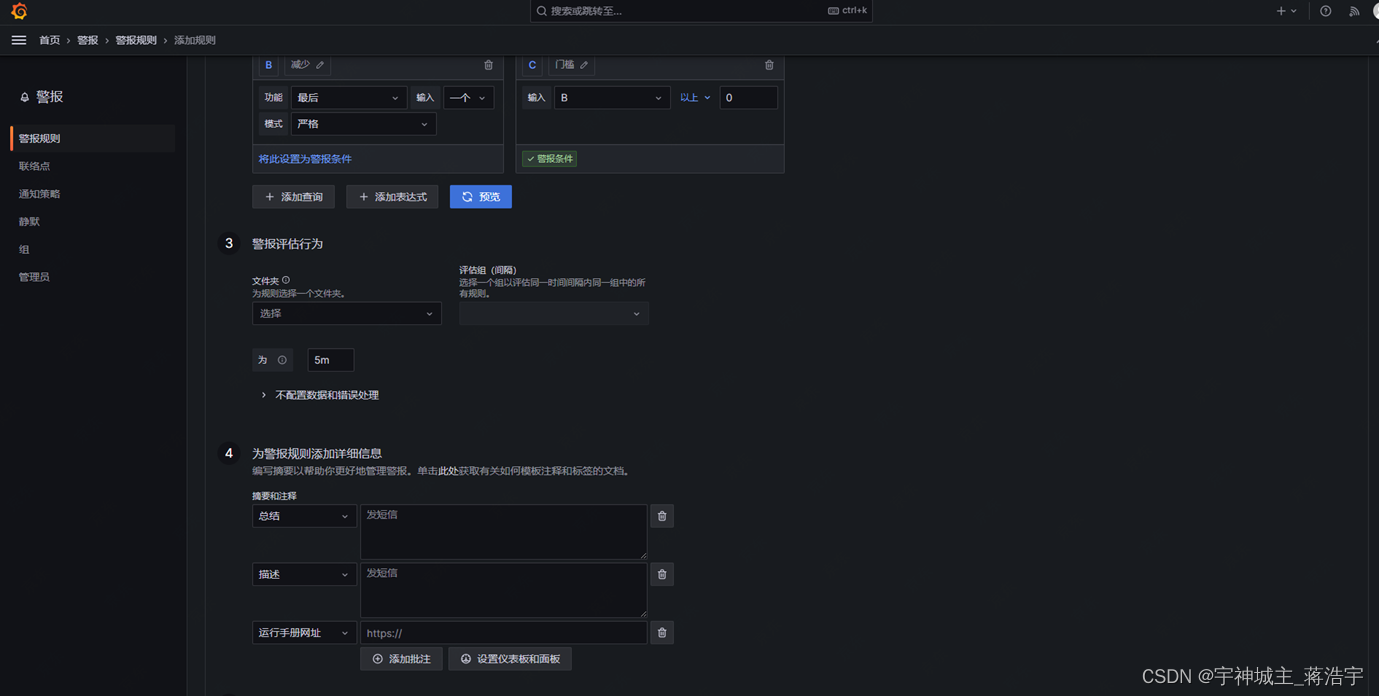
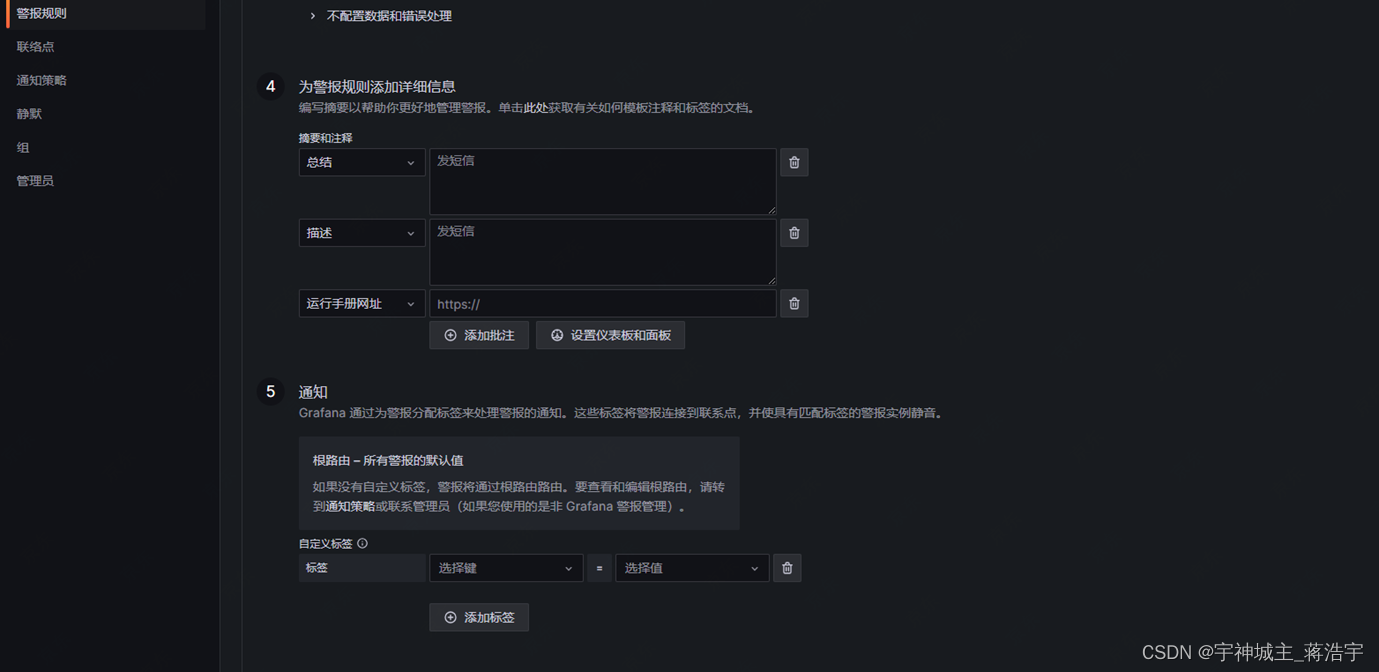
然后专门配置几个告警规则 走走测试验证下即可
Springboot 相关
Pom
<?xml version="1.0" encoding="UTF-8"?>

<project xmlns="http://maven.apache.org/POM/4.0.0" xmlns:xsi="http://www.w3.org/2001/XMLSchema-instance"

    xsi:schemaLocation="http://maven.apache.org/POM/4.0.0 https://maven.apache.org/xsd/maven-4.0.0.xsd">

    <modelVersion>4.0.0</modelVersion>

    <parent>

       <groupId>org.springframework.boot</groupId>

       <artifactId>spring-boot-starter-parent</artifactId>

       <version>2.2.4.RELEASE</version>

       <relativePath/> <!-- lookup parent from repository -->

    </parent>

    <groupId>com.example</groupId>

    <artifactId>springboot2demo</artifactId>

    <version>0.0.1-SNAPSHOT</version>

    <name>springboot2demo</name>

    <description>Demo project for Spring Boot</description>


    <properties>

       <java.version>1.8</java.version>

    </properties>


    <dependencies>

       <dependency>

           <groupId>org.springframework.boot</groupId>

           <artifactId>spring-boot-starter-actuator</artifactId>

       </dependency>

       <dependency>

           <groupId>org.springframework.boot</groupId>

           <artifactId>spring-boot-starter-web</artifactId>

       </dependency>

       <dependency>

           <groupId>io.micrometer</groupId>

           <artifactId>micrometer-registry-prometheus</artifactId>

           <version>1.1.4</version>

       </dependency>


       <dependency>

           <groupId>org.springframework.boot</groupId>

           <artifactId>spring-boot-starter-test</artifactId>

           <scope>test</scope>

           <exclusions>

              <exclusion>

                  <groupId>org.junit.vintage</groupId>

                  <artifactId>junit-vintage-engine</artifactId>

              </exclusion>

           </exclusions>

       </dependency>

    </dependencies>


    <build>

       <plugins>

           <plugin>

              <groupId>org.springframework.boot</groupId>

              <artifactId>spring-boot-maven-plugin</artifactId>

           </plugin>

       </plugins>

    </build>


</project>
重点包
<dependency>

           <groupId>org.springframework.boot</groupId>

           <artifactId>spring-boot-starter-actuator</artifactId>

       </dependency>


       <dependency>

           <groupId>io.micrometer</groupId>

           <artifactId>micrometer-registry-prometheus</artifactId>

       </dependency>
如果有需要可以增加安全包-一般内部机房没啥事-(非必选)
 <dependency>

            <groupId>org.springframework.boot</groupId>

            <artifactId>spring-boot-starter-security</artifactId>

        </dependency>
Application.yml配置文件-(非必选)
security:
  user:
    name: admin
    password: 1234
  basic:
    enabled: true
    # 安全路径列表,逗号分隔,此处只针对/actuator路径进行认证
    path: /actuator
Application.properties
server.port=8101

spring.application.name=springBootDemo

# 打开所有 Actuator 服务

management.endpoints.web.exposure.include=*

# 将应用名称添加到计量器的 tag 中去

# 以便 Prometheus 根据应用名区分不同服务

management.metrics.tags.application=${spring.application.name}
management.endpoints.web.exposure.include介绍
路径    描述

/autoconfig   提供了一份自动配置报告,记录哪些自动配置条件通过了,哪些没通过

/beans 描述应用程序上下文里全部的Bean,以及它们的关系

/env    获取全部环境属性

/configprops 描述配置属性(包含默认值)如何注入Bean

/dump 获取线程活动的快照

/health     报告应用程序的健康指标,这些值由HealthIndicator的实现类提供

/info    获取应用程序的定制信息,这些信息由info打头的属性提供

/mappings     描述全部的URI路径,以及它们和控制器(包含Actuator端点)的映射关系

/metrics    报告各种应用程序度量信息,比如内存用量和HTTP请求计数

/shutdown     关闭应用程序,要求endpoints.shutdown.enabled设置为true

/trace  提供基本的HTTP请求跟踪信息(时间戳、HTTP头等)

/prometheus
启动类
package com.example.springboot2demo;
import io.micrometer.core.instrument.MeterRegistry;
import org.springframework.beans.factory.annotation.Value;
import org.springframework.boot.SpringApplication;
import org.springframework.boot.actuate.autoconfigure.metrics.MeterRegistryCustomizer;
import org.springframework.boot.autoconfigure.SpringBootApplication;
import org.springframework.context.annotation.Bean;
@SpringBootApplication
public class Springboot2demoApplication {
public static void main(String[] args) {
SpringApplication.run(Springboot2demoApplication.class, args);
}
@Bean
MeterRegistryCustomizer<MeterRegistry> configurer(
@Value("${spring.application.name}") String applicationName) {
return (registry) -> registry.config().commonTags("application", applicationName);
}
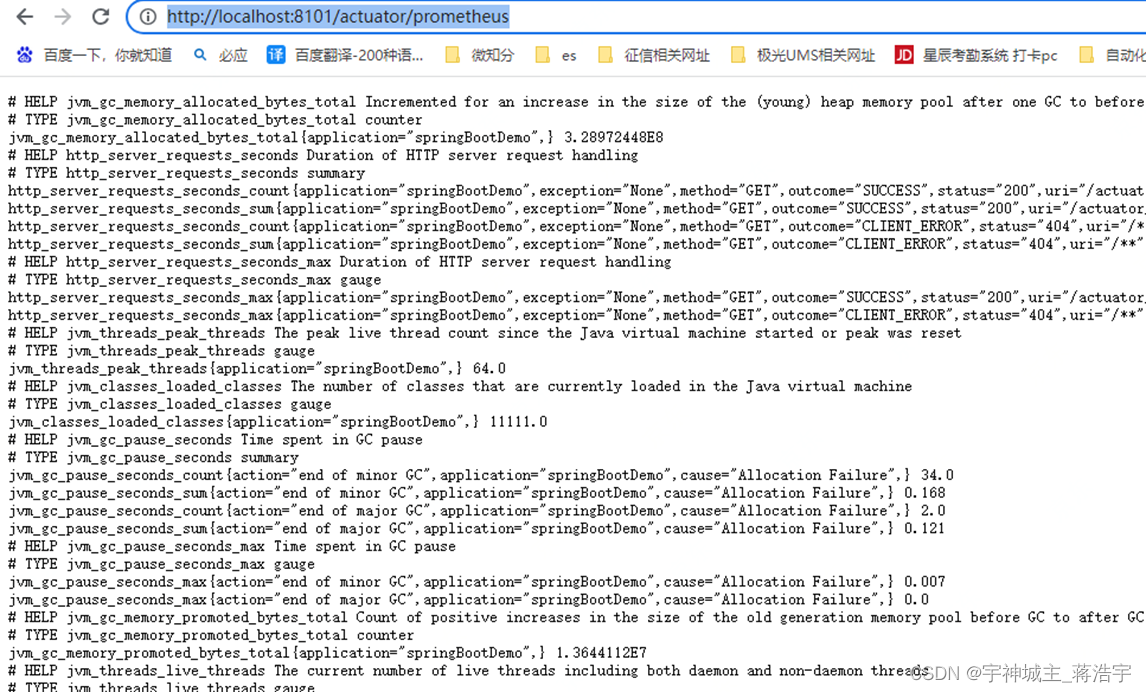
}查看监控信息
http://localhost:8101/actuator/prometheus
Prometheus
Prometheus.yml 配置
- job_name: " actuator-demo"

    metrics_path: "/actuator/prometheus"

    static_configs:

      - targets: ["localhost:8101"]
如果使用类安全包-(非必选)
- job_name: 'monitor-demo'

    scrape_interval: 5s # 刮取的时间间隔

    scrape_timeout: 5s

    metrics_path: /actuator/prometheus

    scheme: http

    basic_auth: #认证信息

      username: admin

      password: 1234

    static_configs:

      - targets:

        - 127.0.0.1: 8101 #此处填写 Spring Boot 应用的 IP + 端口号
启动就可以看到了

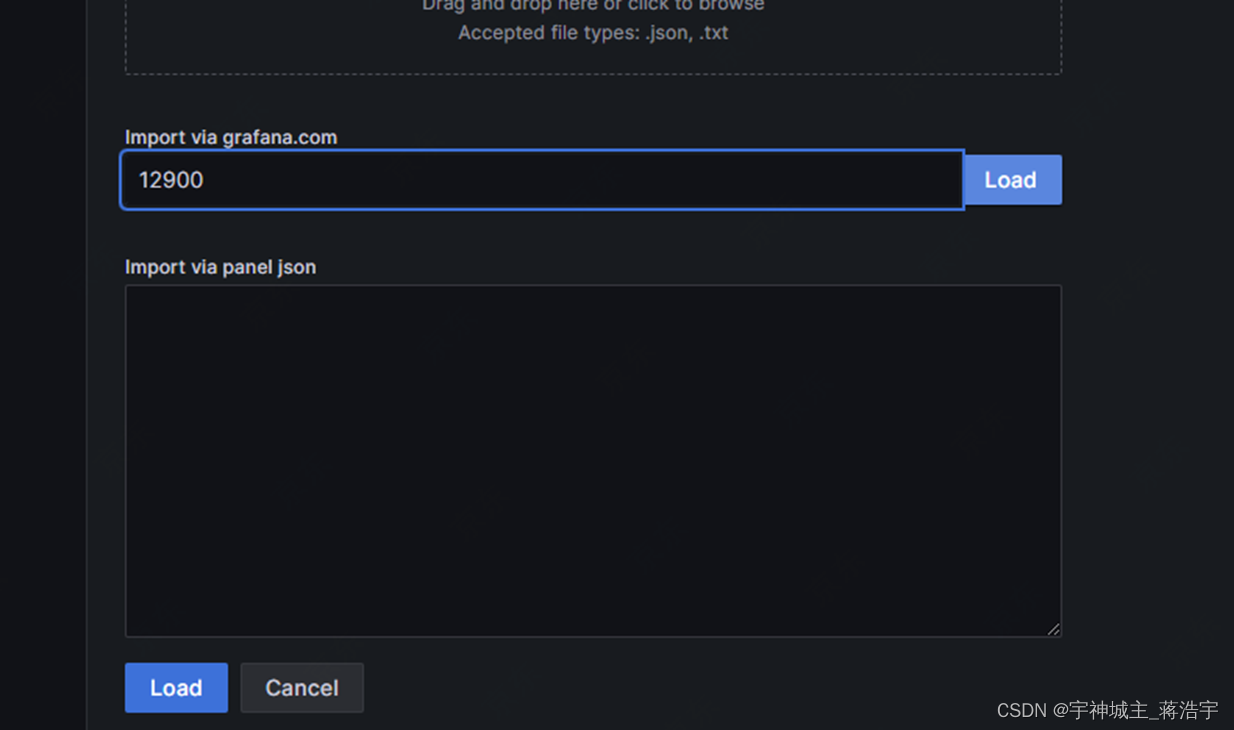
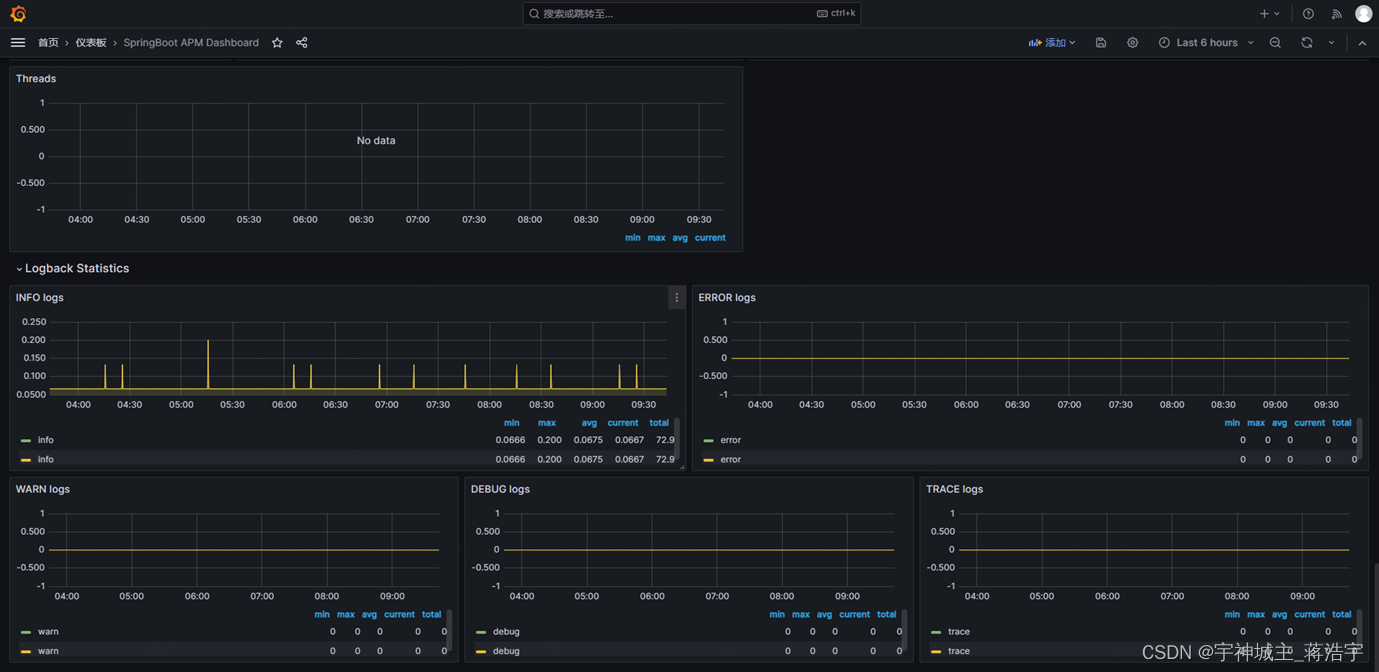
Grafana 模板 12900
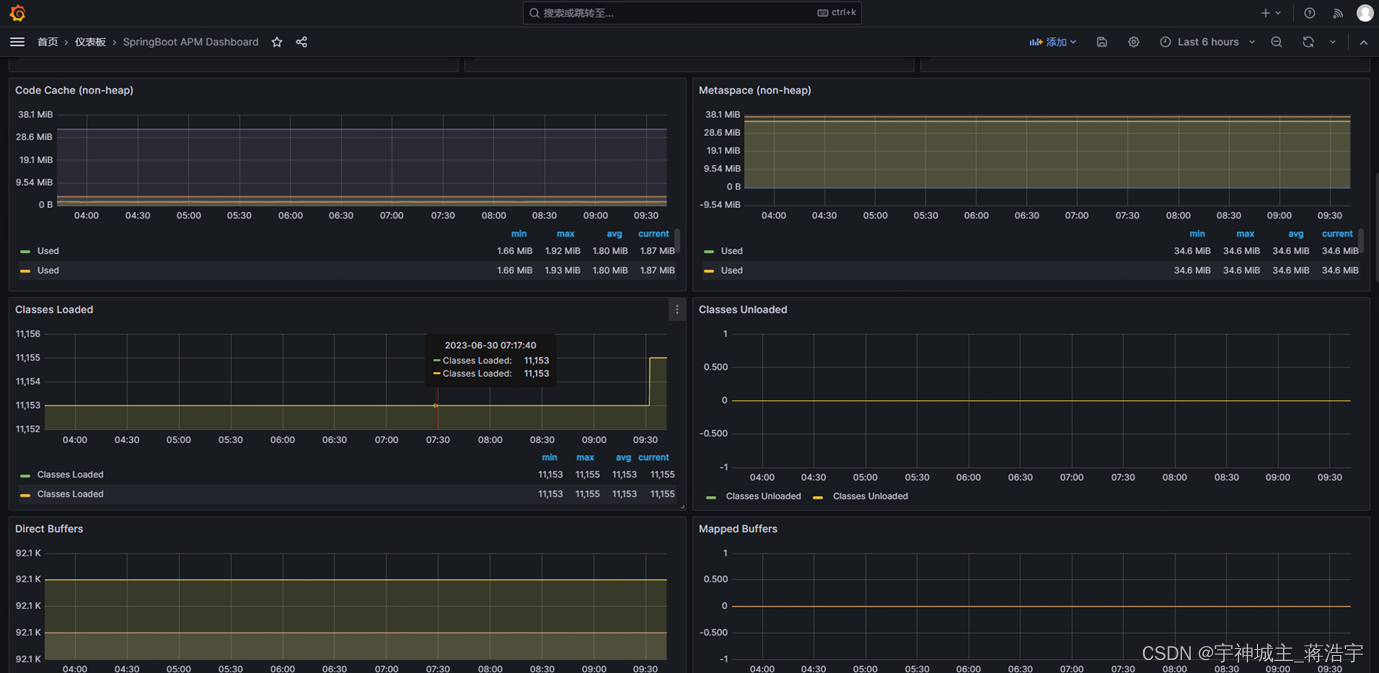
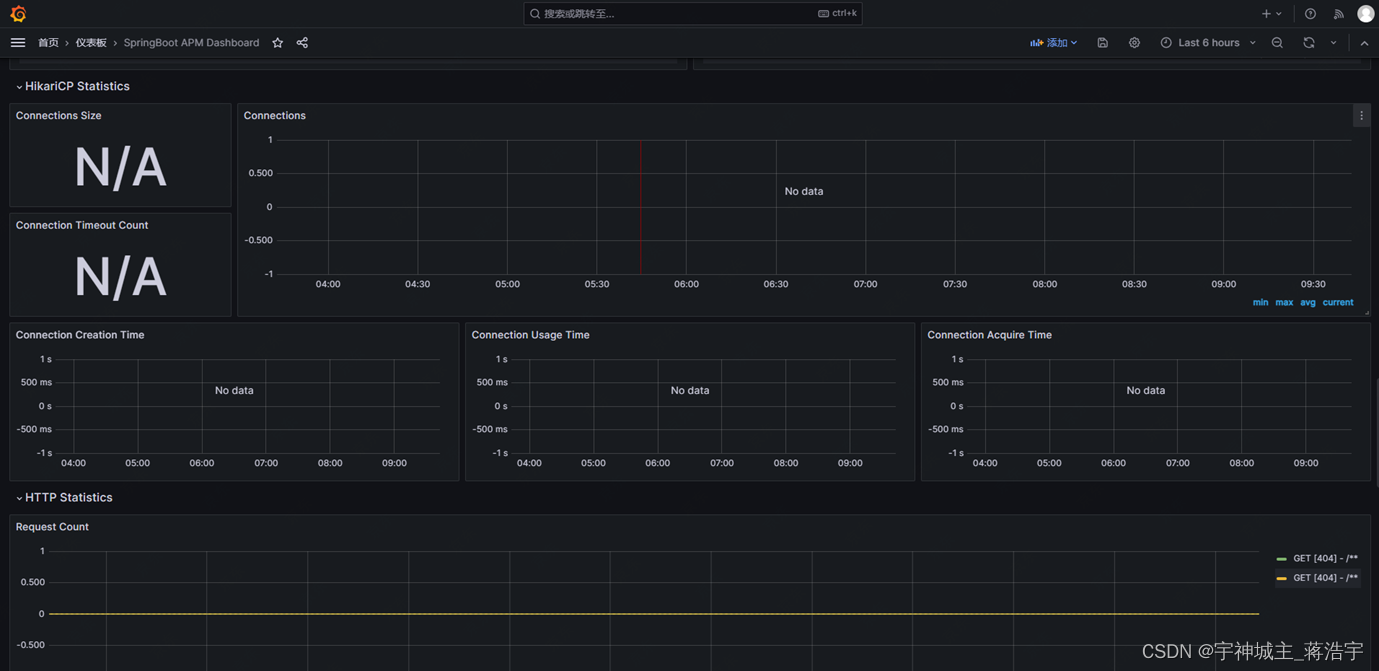
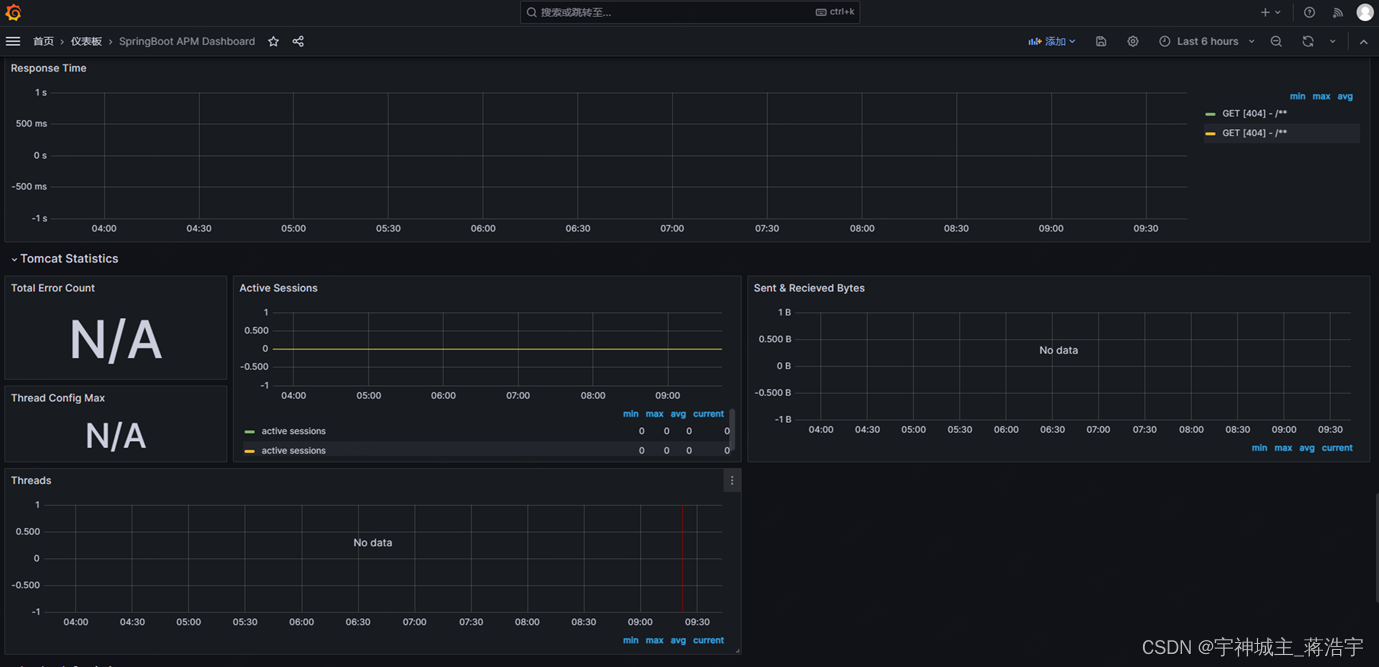
一、报告模板内容
程序运行 Jvm tomcat 请求响应 日志


二、设置告警邮件接收人
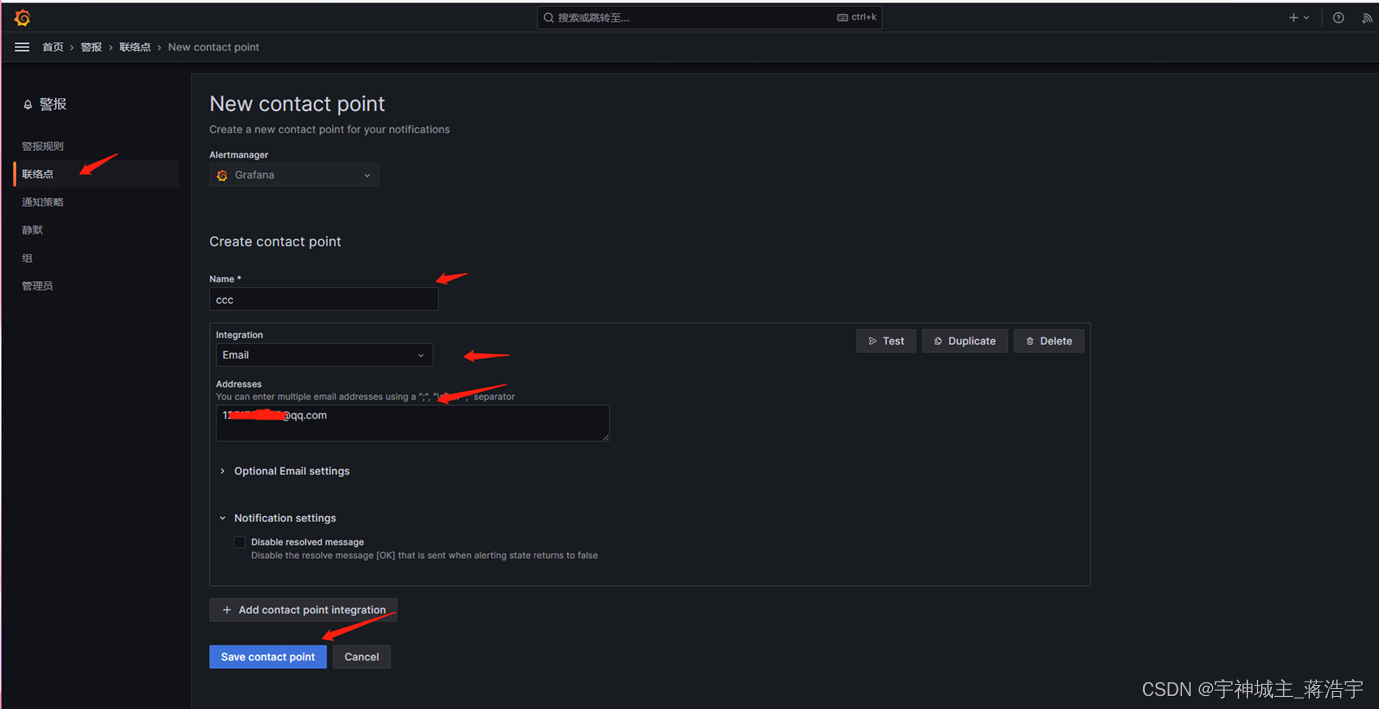
三、邮箱发送人配置(找个自己常用的邮箱开启smtp相关权限配置即可)
Grafana默认使用conf目录下defaults.ini作为配置文件运行 在这直接改就ok了
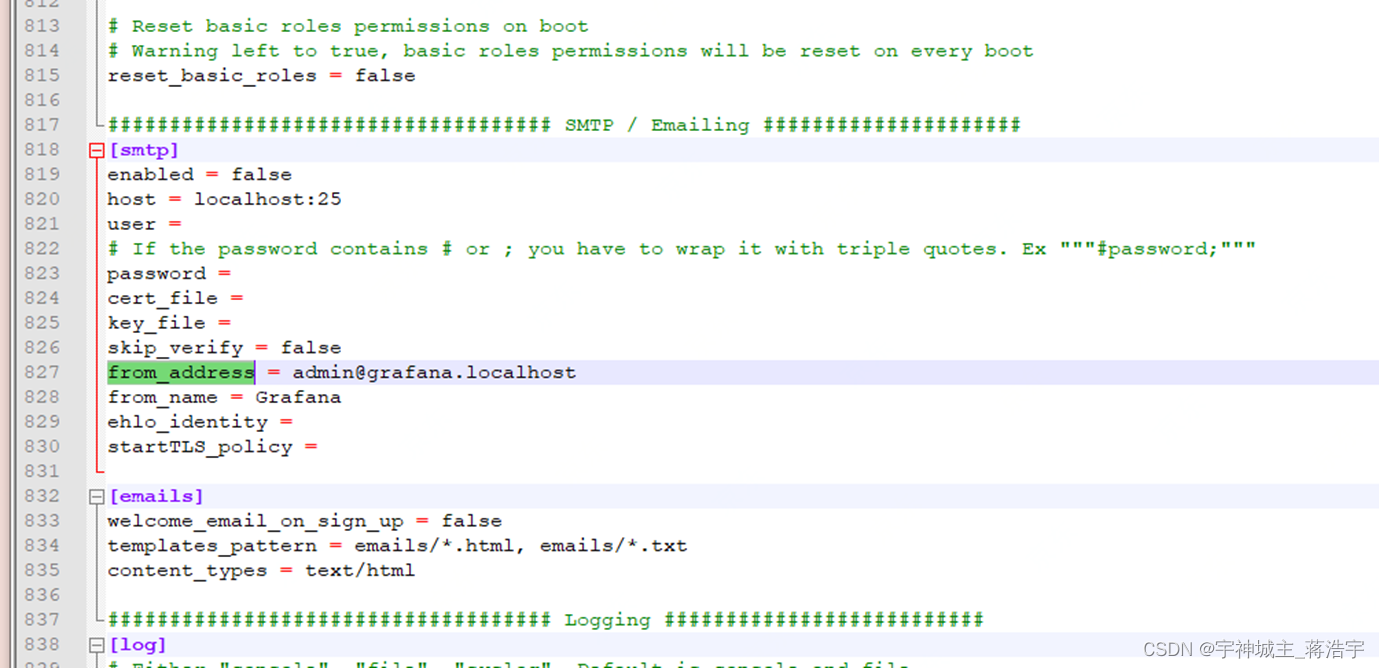
#################################### SMTP / Emailing #####################

[smtp]

enabled = true

host = smtp.exmail.qq.com:465

user = xxxx@ininin.com

# If the password contains # or ; you have to wrap it with triple quotes. Ex """#password;"""

password = XXX

cert_file =

key_file =

skip_verify = true

from_address = xxxx@ininin.com

from_name = Grafana

ehlo_identity = ininin.com
然后专门配置几个告警规则 走走测试验证下即可
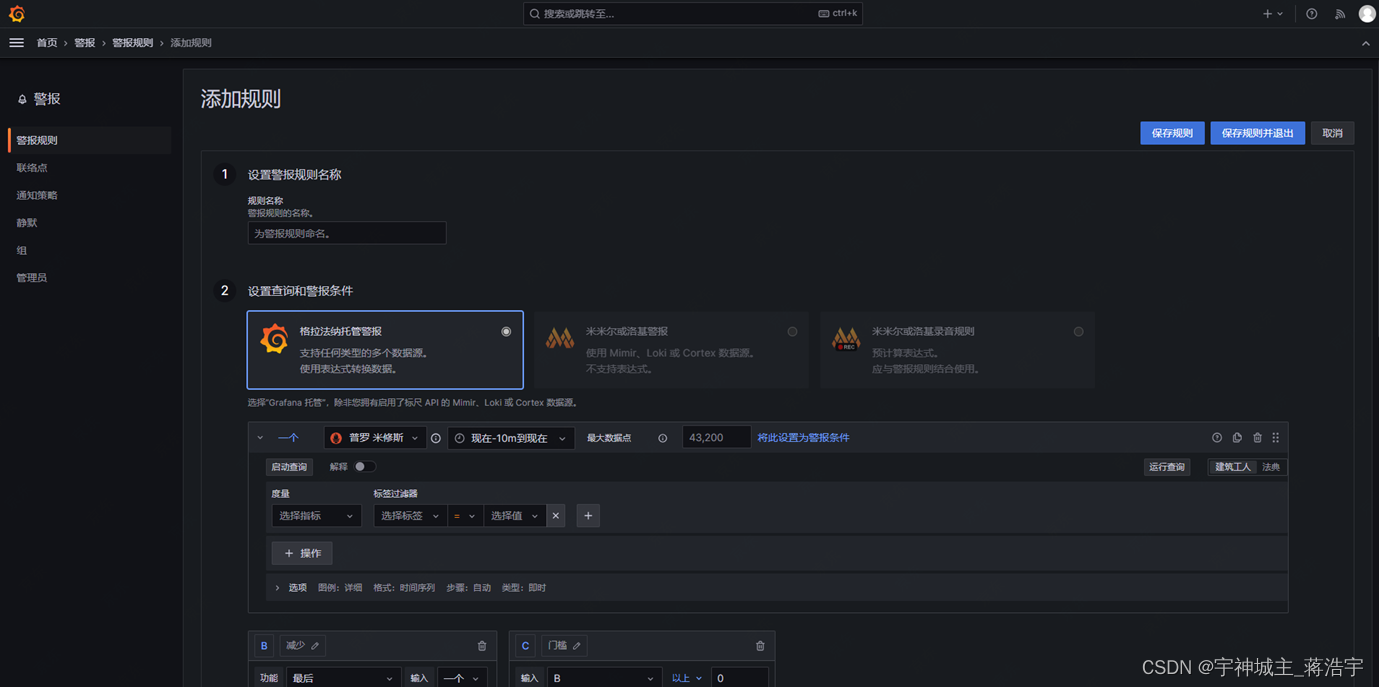
ok
持续更新
![[RocketMQ] Producer发送单向/异步/同步消息源码 (八)](https://img-blog.csdnimg.cn/cd3fa024ad6b4838af13afebc4541e64.png)