Matplotlib入门[03]——处理文本
参考:
- https://ailearning.apachecn.org/
- Matplotlib官网
- Python 字符串前缀r、u、b、f含义
使用Jupyter进行练习
![[外链图片转存失败,源站可能有防盗链机制,建议将图片保存下来直接上传(img-sOdxxkHo-1670313887721)(https://matplotlib.org/stable/_static/images/logo2.svg)]](https://img-blog.csdnimg.cn/53d8a4c276f943d3b48ddf2610634dec.png)
import matplotlib.pyplot as plt
import numpy as np
处理文本-基础
基础文本函数
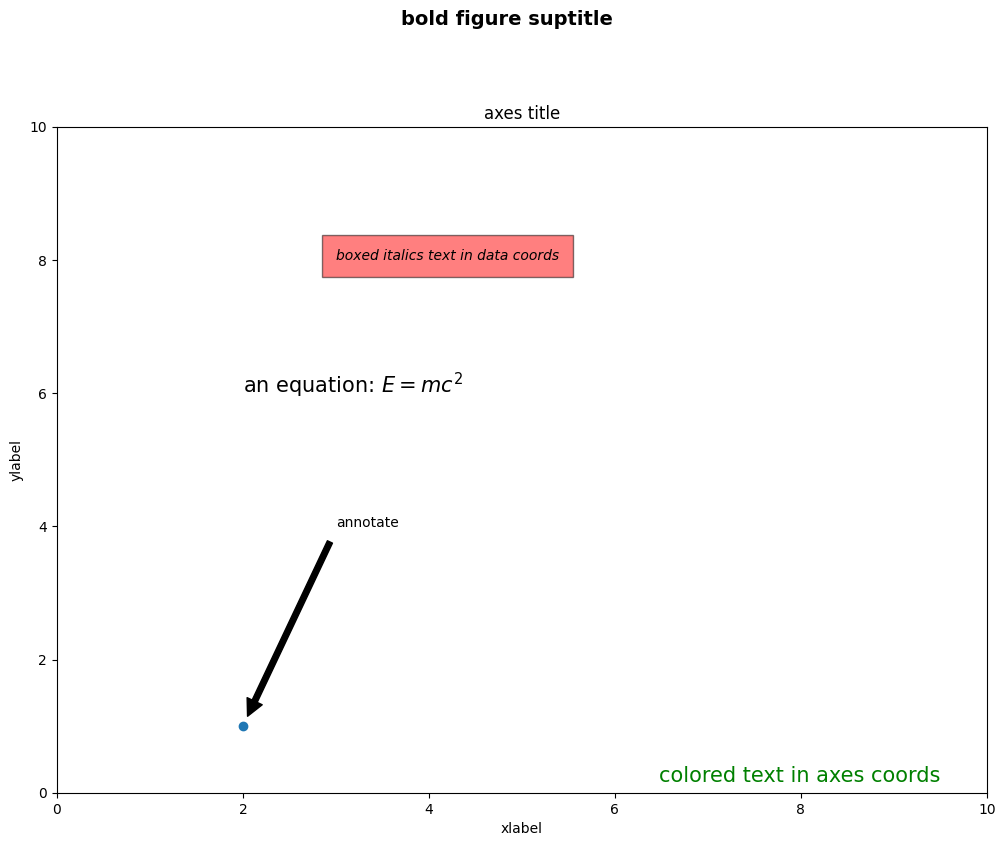
在 matplotlib.pyplot 中,基础的文本函数如下:
text()在Axes对象的任意位置添加文本xlabel()添加 x 轴标题ylabel()添加 y 轴标题title()给Axes对象添加标题figtext()在Figure对象的任意位置添加文本suptitle()给Figure对象添加标题anotate()给Axes对象添加注释(可选择是否添加箭头标记)
# -*- coding: utf-8 -*-
import unicodedata
import matplotlib.pyplot as plt
%matplotlib inline

# plt.figure() 返回一个 Figure() 对象
fig = plt.figure(figsize=(12, 9))

# 设置这个 Figure 对象的标题
# 事实上,如果我们直接调用 plt.suptitle() 函数,它会自动找到当前的 Figure 对象
fig.suptitle('bold figure suptitle', fontsize=14, fontweight='bold')

# Axes 对象表示 Figure 对象中的子图
# 这里只有一幅图像,所以使用 add_subplot(111)
ax = fig.add_subplot(111)
fig.subplots_adjust(top=0.85)

# 可以直接使用 set_xxx 的方法来设置标题
ax.set_title('axes title')
# 也可以直接调用 title(),因为会自动定位到当前的 Axes 对象
# plt.title('axes title')

ax.set_xlabel('xlabel')
ax.set_ylabel('ylabel')

# 添加文本,斜体加文本框
ax.text(3, 8, 'boxed italics text in data coords', style='italic',
        bbox={'facecolor':'red', 'alpha':0.5, 'pad':10})

# 数学公式,用 $$ 输入 Tex 公式
ax.text(2, 6, r'an equation: $E=mc^2$', fontsize=15)

# 颜色,对齐方式
ax.text(0.95, 0.01, 'colored text in axes coords',
        verticalalignment='bottom', horizontalalignment='right',
        transform=ax.transAxes,
        color='green', fontsize=15)

# 注释文本和箭头
ax.plot([2], [1], 'o')
ax.annotate('annotate', xy=(2, 1), xytext=(3, 4),
            arrowprops=dict(facecolor='black', shrink=0.05))

# 设置显示范围
ax.axis([0, 10, 0, 10])

plt.show()
文本属性和布局
可以通过下列关键词,在文本函数中设置文本的属性:
| 关键词 | 值 |
|---|---|
| alpha | float |
| backgroundcolor | any matplotlib color |
| bbox | rectangle prop dict plus key 'pad' which is a pad in points |
| clip_box | a matplotlib.transform.Bbox instance |
| clip_on | [True , False] |
| clip_path | a Path instance and a Transform instance, a Patch |
| color | any matplotlib color |
| family | [ 'serif' , 'sans-serif' , 'cursive' , 'fantasy' , 'monospace' ] |
| fontproperties | a matplotlib.font_manager.FontProperties instance |
| horizontalalignment or ha | [ 'center' , 'right' , 'left' ] |
| label | any string |
| linespacing | float |
| multialignment | ['left' , 'right' , 'center' ] |
| name or fontname | string e.g., ['Sans' , 'Courier' , 'Helvetica' …] |
| picker | [None,float,boolean,callable] |
| position | (x,y) |
| rotation | [ angle in degrees 'vertical' , 'horizontal' |
| size or fontsize | [ size in points , relative size, e.g., 'smaller', 'x-large' ] |
| style or fontstyle | [ 'normal' , 'italic' , 'oblique'] |
| text | string or anything printable with ‘%s’ conversion |
| transform | a matplotlib.transform transformation instance |
| variant | [ 'normal' , 'small-caps' ] |
| verticalalignment or va | [ 'center' , 'top' , 'bottom' , 'baseline' ] |
| visible | [True , False] |
| weight or fontweight | [ 'normal' , 'bold' , 'heavy' , 'light' , 'ultrabold' , 'ultralight'] |
| x | float |
| y | float |
| zorder | any number |
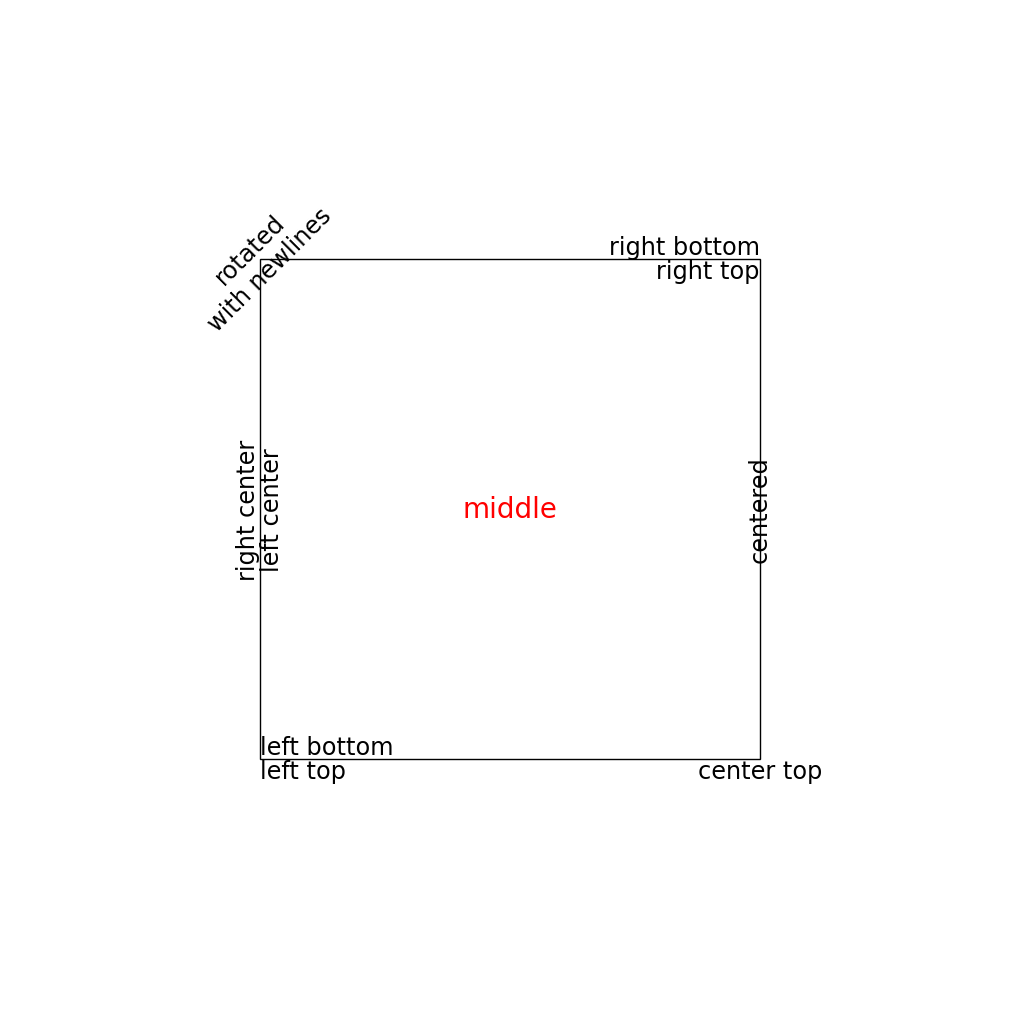
其中 va, ha, multialignment 可以用来控制布局。
horizontalalignmentorha:x 位置参数表示的位置verticalalignmentorva:y 位置参数表示的位置multialignment:多行位置控制
import matplotlib.pyplot as plt
import matplotlib.patches as patches

# 创建一个矩形
left, width = .25, .5
bottom, height = .25, .5
right = left + width
top = bottom + height

fig = plt.figure(figsize=(10,10)) # 以英寸为单位的宽高
ax = fig.add_axes([0,0,1,1])

# 坐标轴坐标是(0,0)是左下(1,1)是右上
p = patches.Rectangle(
    (left, bottom), width, height,
    fill=False, transform=ax.transAxes, clip_on=False
    )

ax.add_patch(p)

ax.text(left, bottom, 'left top',
        horizontalalignment='left',
        verticalalignment='top',
        transform=ax.transAxes,
        size='xx-large')

ax.text(left, bottom, 'left bottom',
        horizontalalignment='left',
        verticalalignment='bottom',
        transform=ax.transAxes,
        size='xx-large')

ax.text(right, top, 'right bottom',
        horizontalalignment='right',
        verticalalignment='bottom',
        transform=ax.transAxes,
        size='xx-large')

ax.text(right, top, 'right top',
        horizontalalignment='right',
        verticalalignment='top',
        transform=ax.transAxes,
        size='xx-large')

ax.text(right, bottom, 'center top',
        horizontalalignment='center',
        verticalalignment='top',
        transform=ax.transAxes,
        size='xx-large')

ax.text(left, 0.5*(bottom+top), 'right center',
        horizontalalignment='right',
        verticalalignment='center',
        rotation='vertical',
        transform=ax.transAxes,
        size='xx-large')

ax.text(left, 0.5*(bottom+top), 'left center',
        horizontalalignment='left',
        verticalalignment='center',
        rotation='vertical',
        transform=ax.transAxes,
        size='xx-large')

ax.text(0.5*(left+right), 0.5*(bottom+top), 'middle',
        horizontalalignment='center',
        verticalalignment='center',
        fontsize=20, color='red',
        transform=ax.transAxes)

ax.text(right, 0.5*(bottom+top), 'centered',
        horizontalalignment='center',
        verticalalignment='center',
        rotation='vertical',
        transform=ax.transAxes,
        size='xx-large')

ax.text(left, top, 'rotated\nwith newlines',
        horizontalalignment='center',
        verticalalignment='center',
        rotation=45,
        transform=ax.transAxes,
        size='xx-large')

ax.set_axis_off()
plt.show()
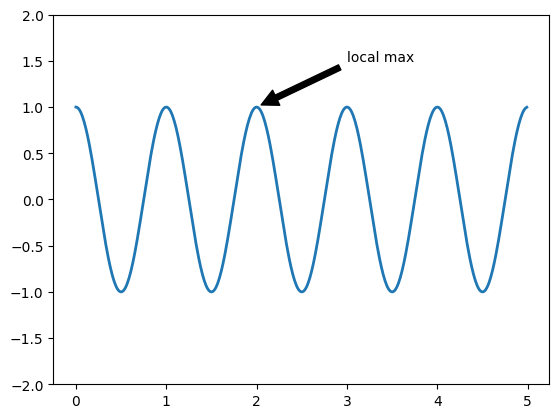
注释文本
text() 函数在 Axes 对象的指定位置添加文本,而 annotate() 则是对某一点添加注释文本,需要考虑两个位置:一是注释点的坐标 xy ,二是注释文本的位置坐标 xytext:
fig = plt.figure()
ax = fig.add_subplot(111)

t = np.arange(0.0, 5.0, 0.01)
s = np.cos(2*np.pi*t)
line, = ax.plot(t, s, lw=2)

ax.annotate('local max', xy=(2, 1), xytext=(3, 1.5),
            arrowprops=dict(facecolor='black', shrink=0.05),
            )

ax.set_ylim(-2,2)
plt.show()
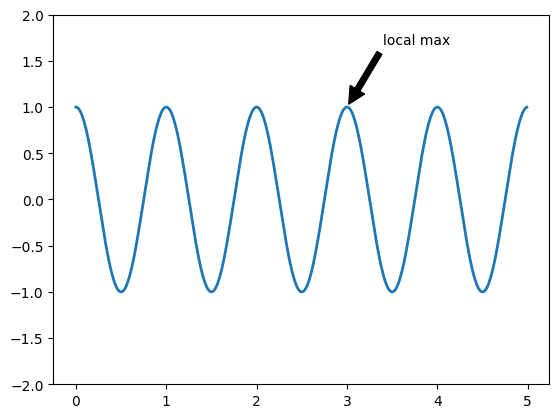
在上面的例子中,两个左边使用的都是原始数据的坐标系,不过我们还可以通过 xycoords 和 textcoords 来设置坐标系(默认是 'data'):
| 参数 | 坐标系 |
|---|---|
| ‘figure points’ | points from the lower left corner of the figure |
| ‘figure pixels’ | pixels from the lower left corner of the figure |
| ‘figure fraction’ | 0,0 is lower left of figure and 1,1 is upper right |
| ‘axes points’ | points from lower left corner of axes |
| ‘axes pixels’ | pixels from lower left corner of axes |
| ‘axes fraction’ | 0,0 is lower left of axes and 1,1 is upper right |
| ‘data’ | use the axes data coordinate system |
使用一个不同的坐标系:
fig = plt.figure()
ax = fig.add_subplot(111)

t = np.arange(0.0, 5.0, 0.01)
s = np.cos(2*np.pi*t)
line, = ax.plot(t, s, lw=2)

ax.annotate('local max', xy=(3, 1),  xycoords='data',
            xytext=(0.8, 0.95), textcoords='axes fraction',
            arrowprops=dict(facecolor='black', shrink=0.05),
            horizontalalignment='right', verticalalignment='top',
            )

ax.set_ylim(-2,2)
plt.show()
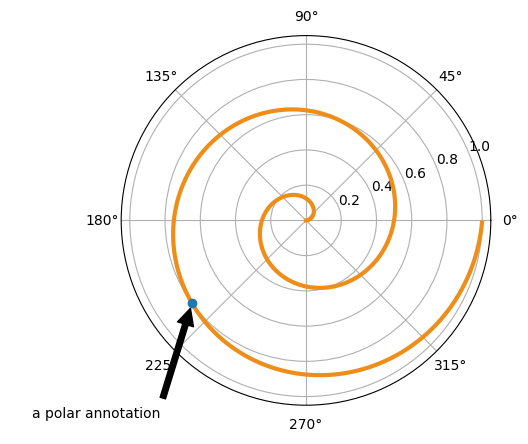
极坐标系注释文本
产生极坐标系需要在 subplot 的参数中设置 polar=True:
fig = plt.figure()
ax = fig.add_subplot(111, polar=True)
r = np.arange(0,1,0.001)
theta = 2*2*np.pi*r
line, = ax.plot(theta, r, color='#ee8d18', lw=3)

ind = 800
thisr, thistheta = r[ind], theta[ind]
ax.plot([thistheta], [thisr], 'o')
ax.annotate('a polar annotation',
            xy=(thistheta, thisr),  # theta, radius
            xytext=(0.05, 0.05),    # fraction, fraction
            textcoords='figure fraction',
            arrowprops=dict(facecolor='black', shrink=0.05),
            horizontalalignment='left',
            verticalalignment='bottom',
            )
plt.show()
处理文本-数学表达式
字符串前缀r、u、b、f含义
-
r/R表示raw string(原始字符串)
-
u/U表示unicode string(unicode编码字符串)
-
b/B表示byte string(转换成bytes类型)
-
f/F表示format string(格式化字符串)
在字符串中使用一对 $$ 符号可以利用 Tex 语法打出数学表达式,而且并不需要预先安装 Tex。在使用时我们通常加上 r 标记表示它是一个原始字符串(raw string)
# 纯文本
plt.title('alpha > beta')

plt.show()
# 数学表达式
plt.title(r'$\alpha > \beta$')

plt.show()
具体的语法可以参考Tex相关语法。
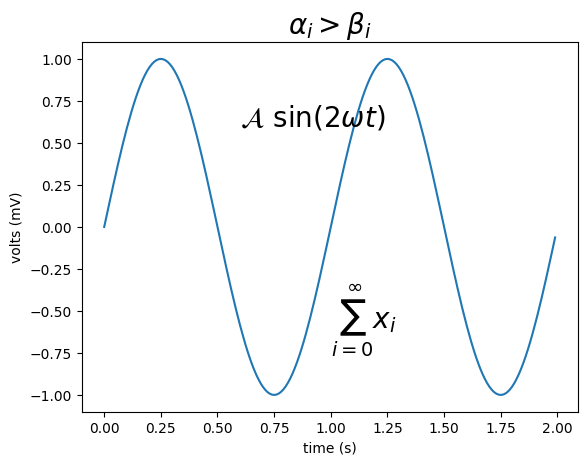
举例
import numpy as np
import matplotlib.pyplot as plt
t = np.arange(0.0, 2.0, 0.01)
s = np.sin(2*np.pi*t)

plt.plot(t,s)
plt.title(r'$\alpha_i > \beta_i$', fontsize=20)
plt.text(1, -0.6, r'$\sum_{i=0}^\infty x_i$', fontsize=20)
plt.text(0.6, 0.6, r'$\mathcal{A}\ \mathrm{sin}(2 \omega t)$',
         fontsize=20)
plt.xlabel('time (s)')
plt.ylabel('volts (mV)')
plt.show()