Grafana 可以显示图数据,例:

依赖
- Grafana >= 7.5.0
下载地址 https://grafana.com/grafana/download
# 启动 Grafana
$ ./grafana-sever
- Grafana Node Graph API Plugin
# 安装插件
$ grafana-cli plugins install hamedkarbasi93-nodegraphapi-datasource
# 重新启动 Grafana
$ grafana-server
步骤
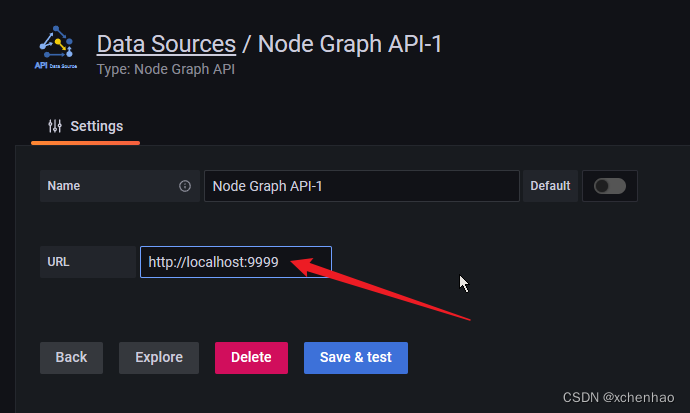
(1)Grafana 添加数据源,选择 Node Graph API

填写 Node Graph API URL,如 http://localhost:9999
注:$URL 需要提供三个 API
$URL/api/heatlh健康检查接口- method: GET
- 返回 HTTP CODE 200 即可
$URL/api/graph/fields图节点与边涉及的字段接口- method:
GET - content type:
application/json - response body example:
{
  "edges_fields": [
    {
      "field_name": "id",
      "type": "string"
    },
    {
      "field_name": "source",
      "type": "string"
    },
    {
      "field_name": "target",
      "type": "string"
    },
    {
      "field_name": "mainStat",
      "type": "number"
    }
  ],
  "nodes_fields": [
    {
      "field_name": "id",
      "type": "string"
    },
    {
      "field_name": "title",
      "type": "string"
    },
    {
      "field_name": "mainStat",
      "type": "string"
    },
    {
      "field_name": "secondaryStat",
      "type": "number"
    },
    {
      "color": "red",
      "field_name": "arc__failed",
      "type": "number"
    },
    {
      "color": "green",
      "field_name": "arc__passed",
      "type": "number"
    },
    {
      "displayName": "Role",
      "field_name": "detail__role",
      "type": "string"
    }
  ]
}
- method:
$URL/api/graph/data图节点与与边关系数据接口- method:
GET - content type:
application/json - response body example:
{
    "edges": [
        {
            "id": "1",
            "mainStat": "53/s",
            "source": "1",
            "target": "2"
        }
    ],
    "nodes": [
        {
            "arc__failed": 0.7,
            "arc__passed": 0.3,
            "detail__zone": "load",
            "id": "1",
            "subTitle": "instance:#2",
            "title": "Service1"
        },
        {
            "arc__failed": 0.5,
            "arc__passed": 0.5,
            "detail__zone": "transform",
            "id": "2",
            "subTitle": "instance:#3",
            "title": "Service2"
        }
    ]
}
- method:
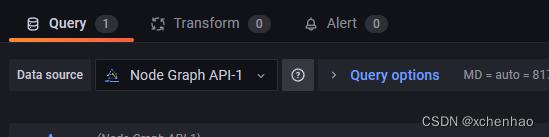
(2)Grafana 新建 Panel,选择 Node Graph

选择对应的 Data Source 为刚刚添加的数据源
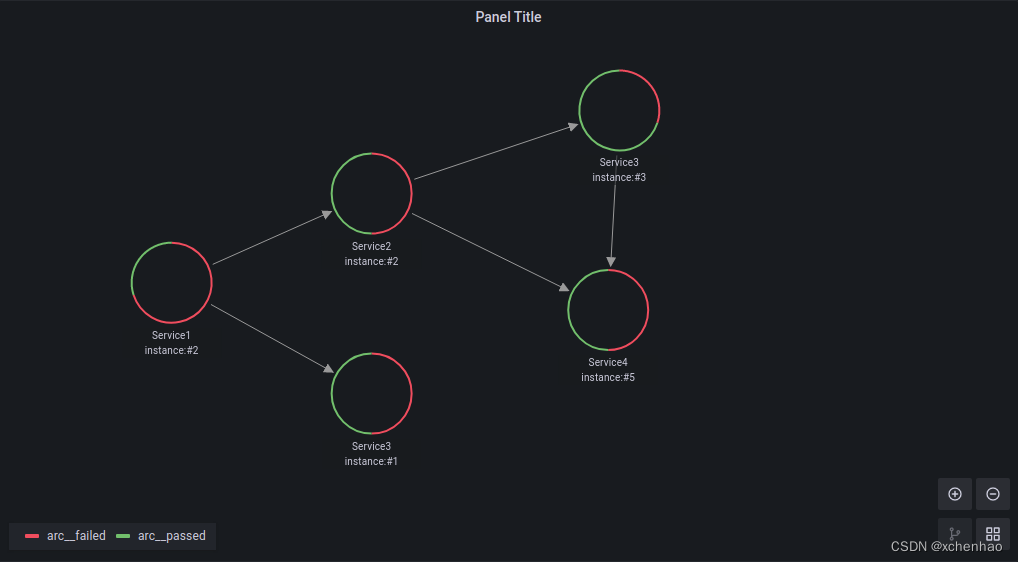
(3)得到图
参考
- https://grafana.com/docs/grafana/latest/panels-visualizations/visualizations/node-graph/
Grafana Node Graph Panel - https://grafana.com/grafana/plugins/hamedkarbasi93-nodegraphapi-datasource/
Grafana Node Graph API


![[opencv]opencv-python环境搭建](https://img-blog.csdnimg.cn/659a3c34ae1141e8850f7b7f162e3633.png)