Prometheus+Grafana普罗米修斯搭建+监控MySQL
一,Prometheus
1.什么是Prometheus?
Prometheus 是 Cloud Native Computing Foundation 的一个监控系统项目, 集采集、监控、报警等特点于一体。
Prometheus主要受启发于Google的Brogmon监控系统, 从2012年开始由前Google工程师在Soundcloud以开源软件的形式进行研发,2017年底发布了基于全新存储层的2.0版本,当前最新版本是2.44.0版本。
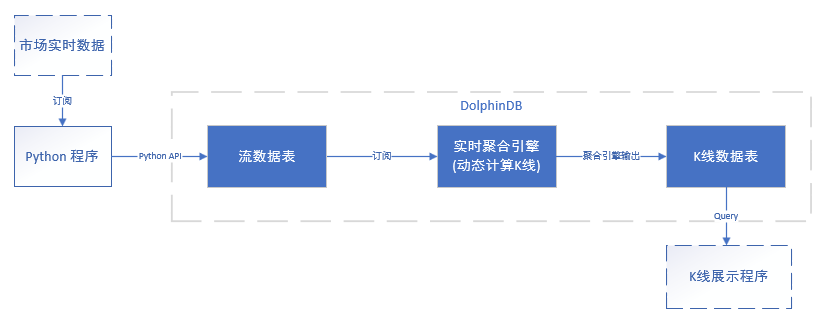
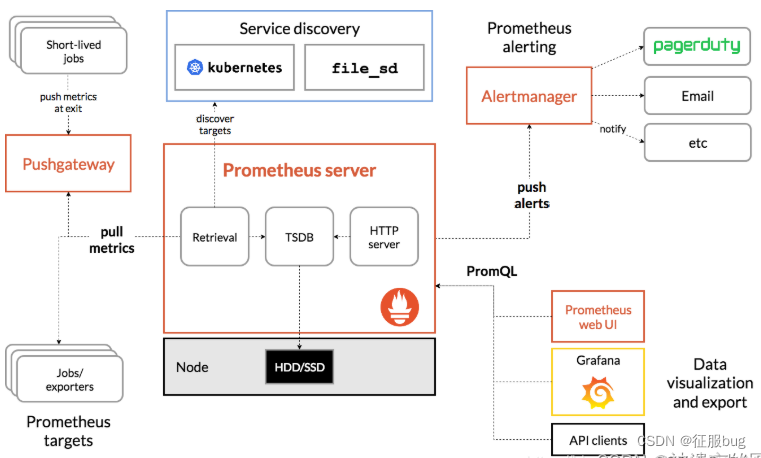
2.Prometheus架构
3.prometheus具有那些特点?
- 多维数据模型(由指标名称、键/值组合的时间序列);
- 提供了一种强大而灵活的查询语言
promsql; - 没有对分布式存储的依赖,单个服务器节点是自主的;
- 主要支持时间序列集合的HTTP拉模模型,同时也提供
PushGateway来满足; - 服务发现;
- 自带
UI,支持丰富多种图形和仪表板,还能与其他; - 支持分层和水平联合;
二,Prometheus搭建
| IP | 角色 | |
|---|---|---|
| 192.168.2.4 | prometheus服务器端 | |
| 192.168.2.3 | node_exporter客户端 |
1.二进制安装Prometheus
[root@server ~]# wget https://github.com/prometheus/prometheus/releases/download/v2.44.0/prometheus-2.44.0.linux-amd64.tar.gz
[root@server ~]# tar zxf prometheus-2.44.0.linux-amd64.tar.gz
[root@server ~]# mv prometheus-2.44.0.linux-amd64 /usr/local/prometheus
1.查看版本号
[root@server ~]# cd /usr/local/prometheus/
[root@server prometheus]# ./prometheus --version
prometheus, version 2.44.0 (branch: HEAD, revision: 1ac5131f698ebc60f13fe2727f89b115a41f6558)
  build user:       root@739e8181c5db
  build date:       20230514-06:18:11
  go version:       go1.20.4
  platform:         linux/amd64
  tags:             netgo,builtinassets,stringlabels
2.查看帮助文档
[root@server prometheus]# ./prometheus --help
2.prometheus.yml配置解释
# my global config
global:
  # 默认情况下,每15s拉取一次目标采样点数据。
  scrape_interval:     15s # Set the scrape interval to every 15 seconds. Default is every 1 minute.
  # 每15秒评估一次规则。默认值为每1分钟。
  evaluation_interval: 15s # Evaluate rules every 15 seconds. The default is every 1 minute.
  # scrape_timeout is set to the global default (10s).

# Alertmanager configuration
alerting:
  alertmanagers:
  - static_configs:
    - targets:
      # - alertmanager:9093

# Load rules once and periodically evaluate them according to the global 'evaluation_interval'.
rule_files:
  # - "first_rules.yml"
  # - "second_rules.yml"

# A scrape configuration containing exactly one endpoint to scrape:
# Here it's Prometheus itself.
scrape_configs:
  # job名称会增加到拉取到的所有采样点上,同时还有一个instance目标服务的host:port标签也会增加到采样点上
  - job_name: 'prometheus'

    # 覆盖global的采样点,拉取时间间隔5s
    scrape_interval: 5s
    static_configs:
    - targets: ['localhost:9090']
3.升级为系统服务
# 启动服务
cd /usr/lib/systemd/system
vi prometheus.service

[Unit]
  Description=https://prometheus.io

  [Service]
  Restart=on-failure
  ExecStart=/usr/local/prometheus/prometheus --config.file=/usr/local/prometheus/prometheus.yml --web.listen-address=:9090

  [Install]
  WantedBy=multi-user.target

#保存退出
其他选项解释:
常用选项解释:
# 指定配置文件
--config.file="prometheus.yml"
# 默认指定监听地址端口,可修改端口
--web.listen-address="0.0.0.0:9090"
# 最大连接数
--web.max-connections=512
# tsdb数据存储的目录,默认当前data/
--storage.tsdb.path="data/"
# premetheus 存储数据的时间,默认保存15天
--storage.tsdb.retention=15d
# 通过命令热加载无需重启 curl -XPOST 192.168.2.45:9090/-/reload
--web.enable-lifecycle
# 可以启用 TLS 或 身份验证 的配置文件的路径
--web.config.file=""

启动选项了解:./prometheus --help
4.刷新system文件,启动
systemctl daemon-reload
systemctl start prometheus
5.访问测试
IP:9090

三,客户端node_exporter搭建
1.监控目的Linux安装node_exporter
[root@server ~]# wget https://github.com/prometheus/node_exporter/releases/download/v1.1.2/node_exporter-1.1.2.linux-amd64.tar.gz
[root@server ~]# tar xf node_exporter-1.1.2.linux-amd64.tar.gz -C /usr/local/
[root@server ~]# cd /usr/local/
[root@server ~]# mv node_exporter-1.1.2.linux-amd64/ node_exporter
2.添加为系统服务
[root@server ~]# vi /usr/lib/systemd/system/node_exporter.service
[Unit]
Description=node_exporter
After=network.target

[Service]
ExecStart=/usr/local/node_exporter/node_exporter
Restart=on-failure

[Install]
WantedBy=multi-user.target

# 启动node_exporter
systemctl daemon-reload
systemctl start node_exporter
3.prometheus服务器端添加监控项
[root@server prometheus]# cat prometheus.yml
# my global config
global:
  scrape_interval:     15s # Set the scrape interval to every 15 seconds. Default is every 1 minute.
  evaluation_interval: 15s # Evaluate rules every 15 seconds. The default is every 1 minute.
  # scrape_timeout is set to the global default (10s).

# Alertmanager configuration
alerting:
  alertmanagers:
  - static_configs:
    - targets:
      # - alertmanager:9093

# Load rules once and periodically evaluate them according to the global 'evaluation_interval'.
rule_files:
scrape_configs:
  - job_name: 'prometheus'
    static_configs:
    - targets: ['192.168.2.4:9090']

  - job_name: 'linux'
    static_configs:
    - targets: ['192.168.2.4:9100','192.168.2.3:9100'] # 多个用,分开

# 添加上面三行
4.重启系统普罗米修斯
[root@server ~]# systemctl restart prometheus.service
5.监控界面

四,监控MySQL
1.安装mysqld-exporter
[root@VM_2-44 ~]# wget https://github.com/prometheus/mysqld_exporter/releases/download/v0.12.1/mysqld_exporter-0.12.1.linux-amd64.tar.gz
[root@VM_2-44 ~]# tar xf mysqld_exporter-0.12.1.linux-amd64.tar.gz -C /usr/local/
[root@VM_2-44 /usr/local]# mv mysqld_exporter-0.12.1.linux-amd64 mysqld_exporter
[root@VM_2-44 /usr/local/mysqld_exporter]# vi .my.cnf
[client]
host=192.168.2.3
user=root
password=123456
port=3306
2.启动mysqld-exporter服务
[root@VM_2-44 /usr/local/mysqld_exporter]# ./mysqld_exporter --config.my-cnf="/usr/local/mysqld_exporter/.my.cnf" &
[root@VM_2-44 /usr/local/mysqld_exporter]# ps -ef |grep exporter
root       3447   3398  0 01:31 pts/1    00:00:02 ./node_exporter
root       4647   3398  0 02:13 pts/1    00:00:00 ./mysqld_exporter --config.my-cnf=/usr/local/mysqld_exporter/.my.cnf
root       4654   3398  0 02:13 pts/1    00:00:00 grep --color=auto exporter
[root@VM_2-44 /usr/local/mysqld_exporter]# ss -lntp |grep 4647
LISTEN     0      128         :::9104                    :::*                   users:(("mysqld_exporter",pid=4647,fd=3))
[root@VM_2-44 /usr/local/mysqld_exporter]#

# 启动后会监听9104端口
3.普罗米修斯配置文件添加监控项
[root@VM_2-45 /usr/local/prometheus]# vi prometheus.yml
  - job_name: 'mysql'
    static_configs:
    - targets: ['192.168.2.3:9104']
4.重启普罗米修斯
[root@VM_2-45 /usr/local/prometheus]# systemctl restart prometheus.service
5.查看状态
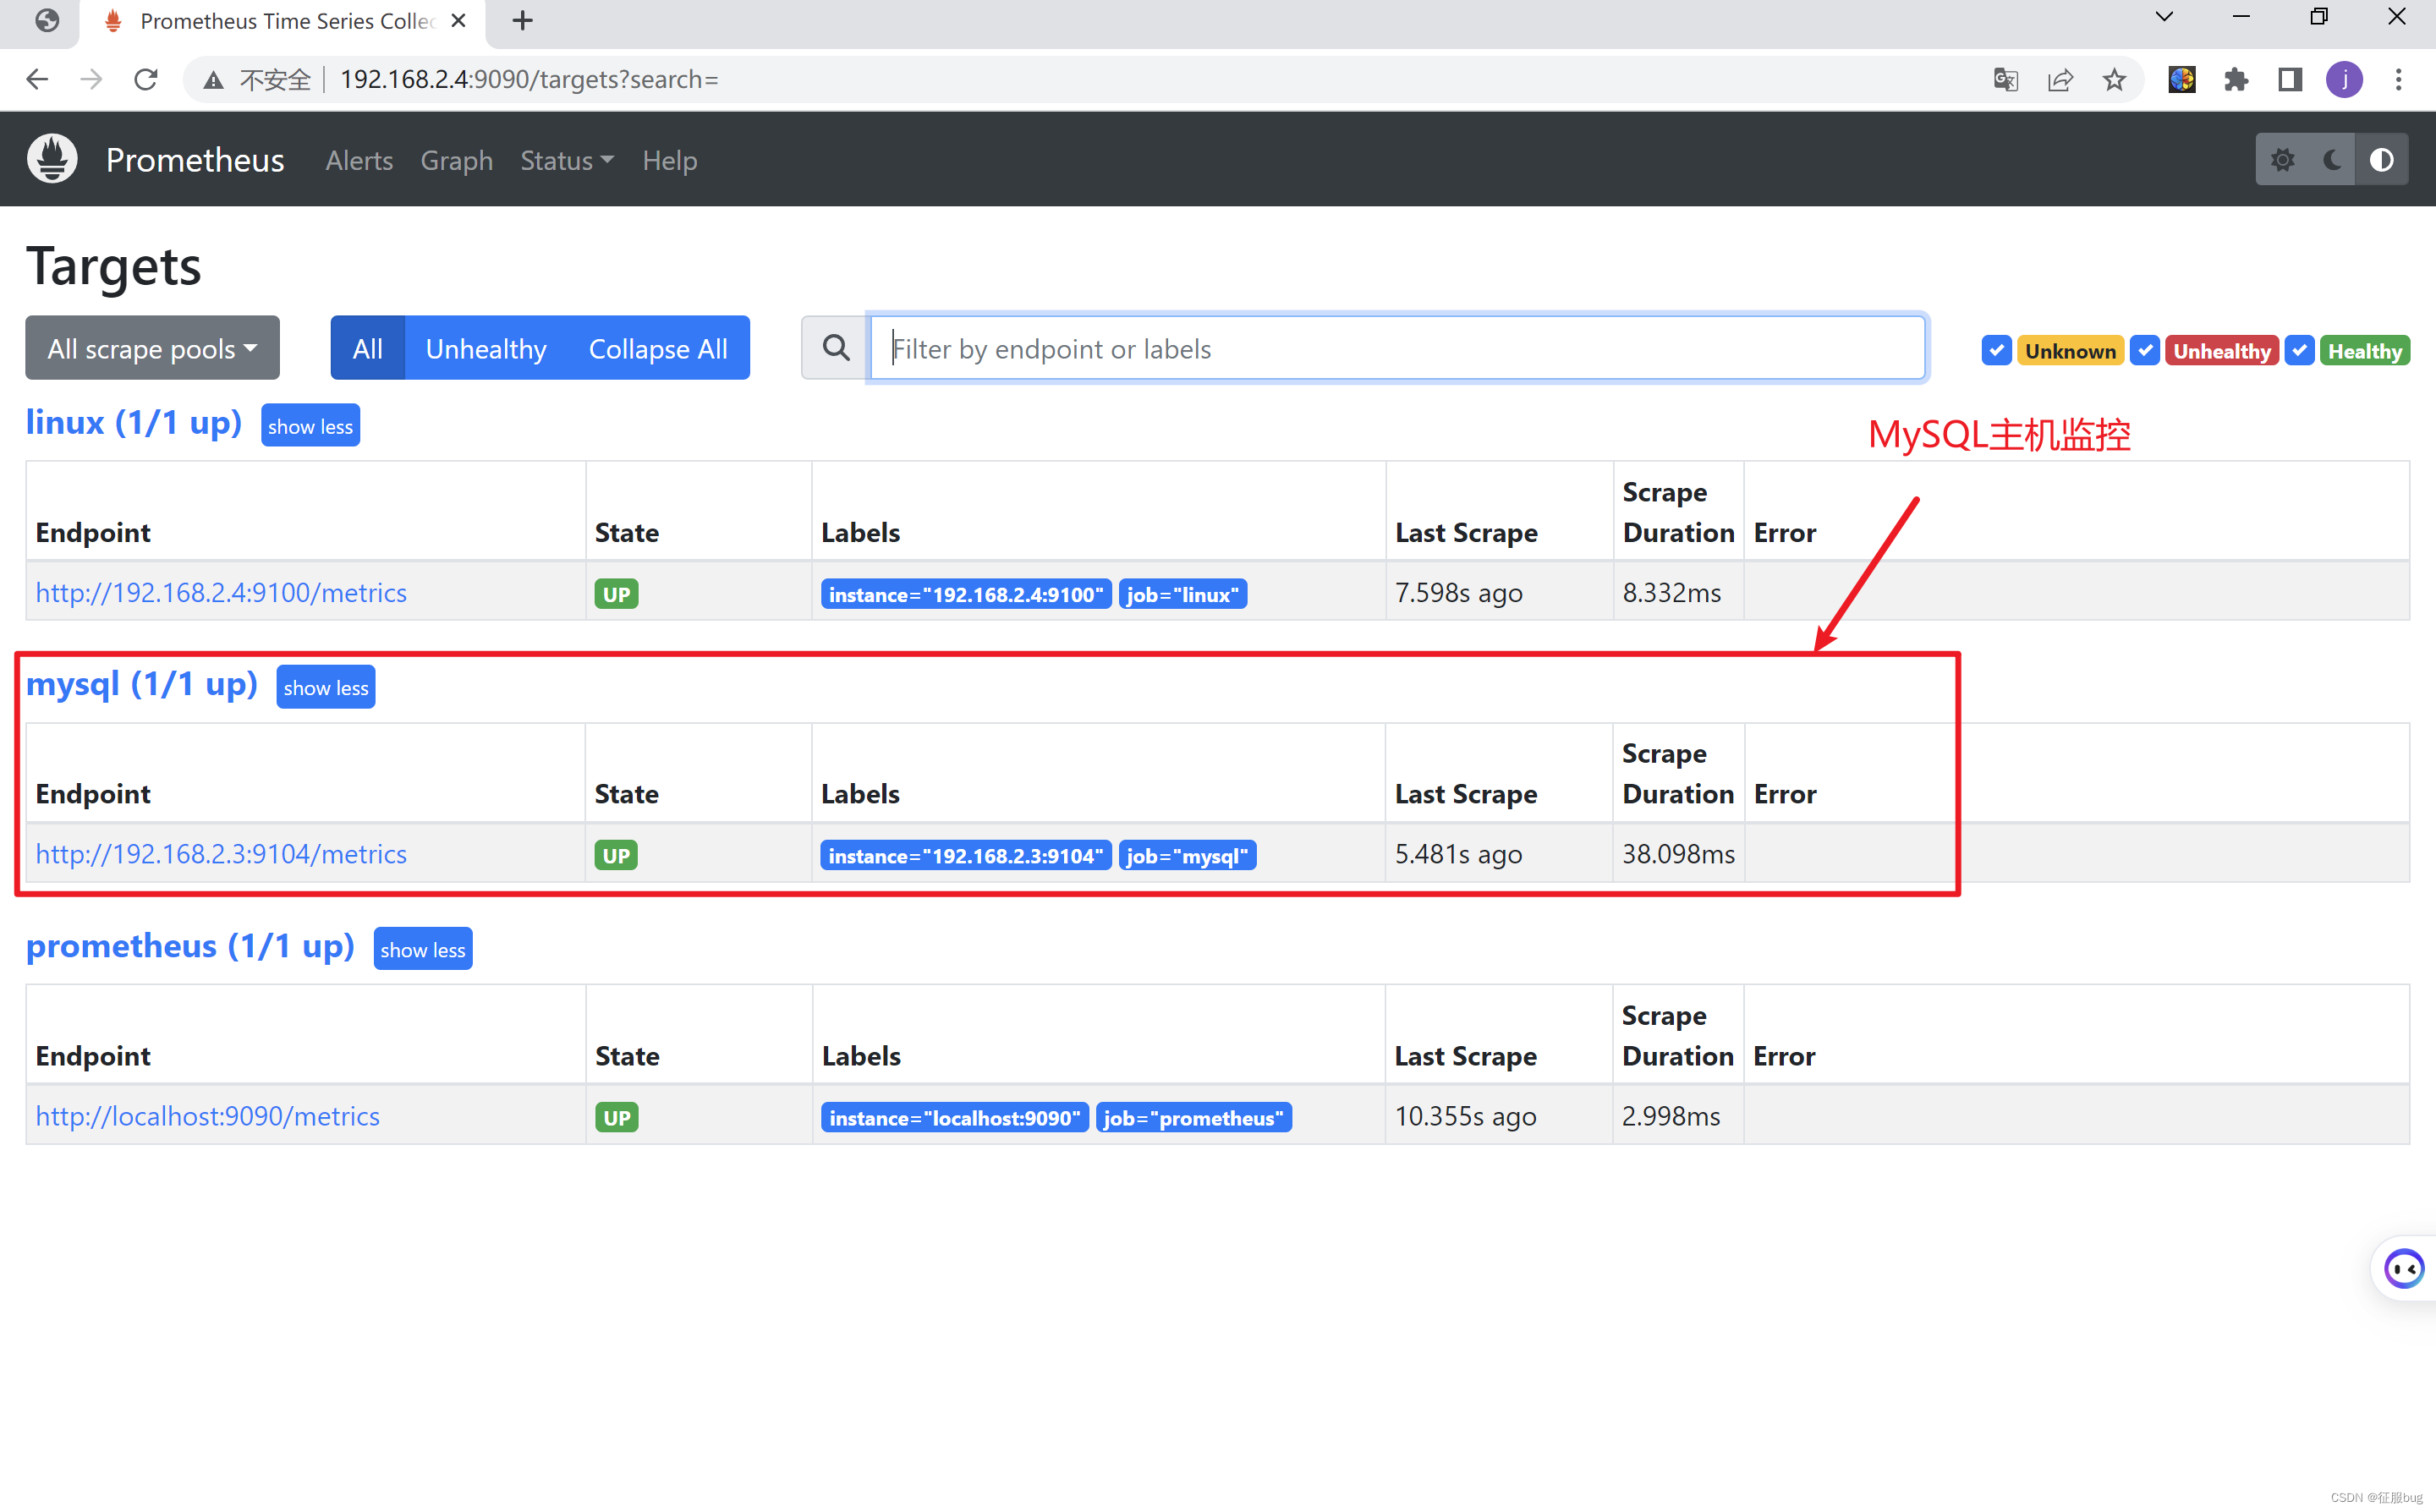
五,grafana展示prometheus数据
1.在prometheus安装grafana
wget https://mirrors.tuna.tsinghua.edu.cn/grafana/yum/rpm/Packages/grafana-7.4.3-1.x86_64.rpm

[root@VM_2-45 ~]# yum install initscripts fontconfig
[root@VM_2-45 ~]# yum install -y grafana-7.4.3-1.x86_64.rpm
[root@VM_2-45 ~]# systemctl start grafana-server.service
2.访问grafana
启动后访问地址:ip:3000
初始用户名和密码都是admin

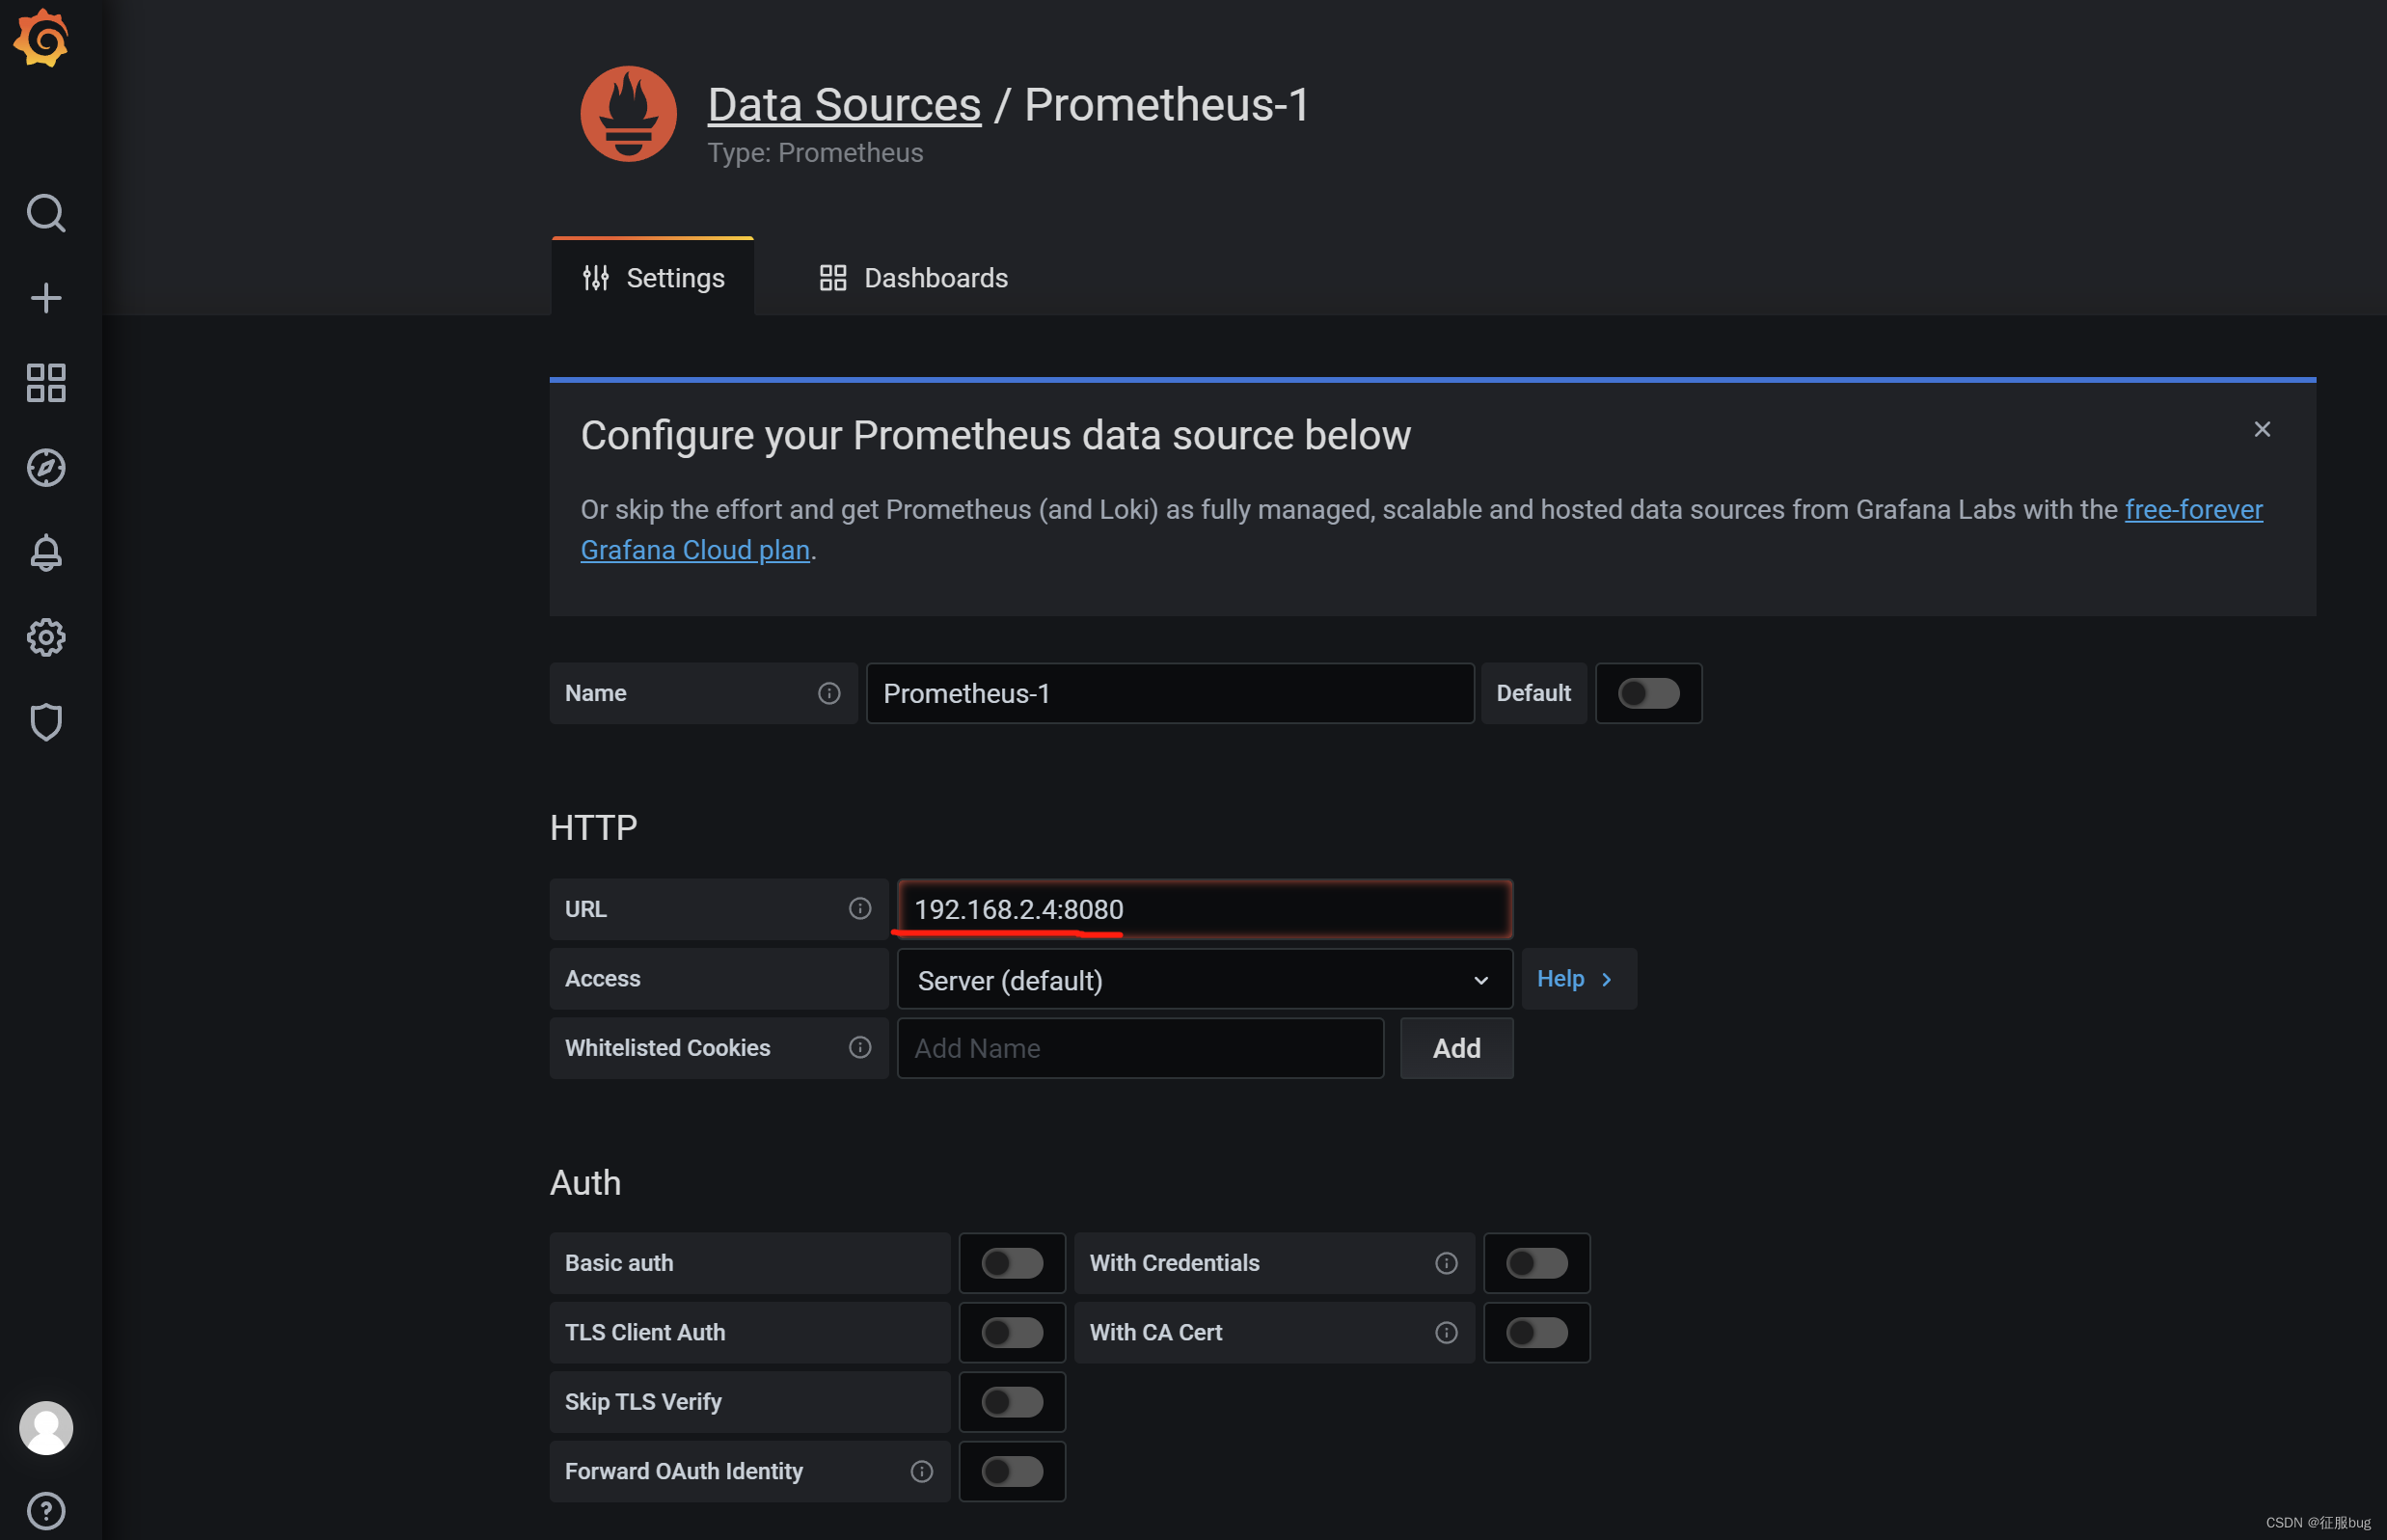
3.添加Prometheus数据源
Configuration -> Data Sources ->add data source -> Prometheus
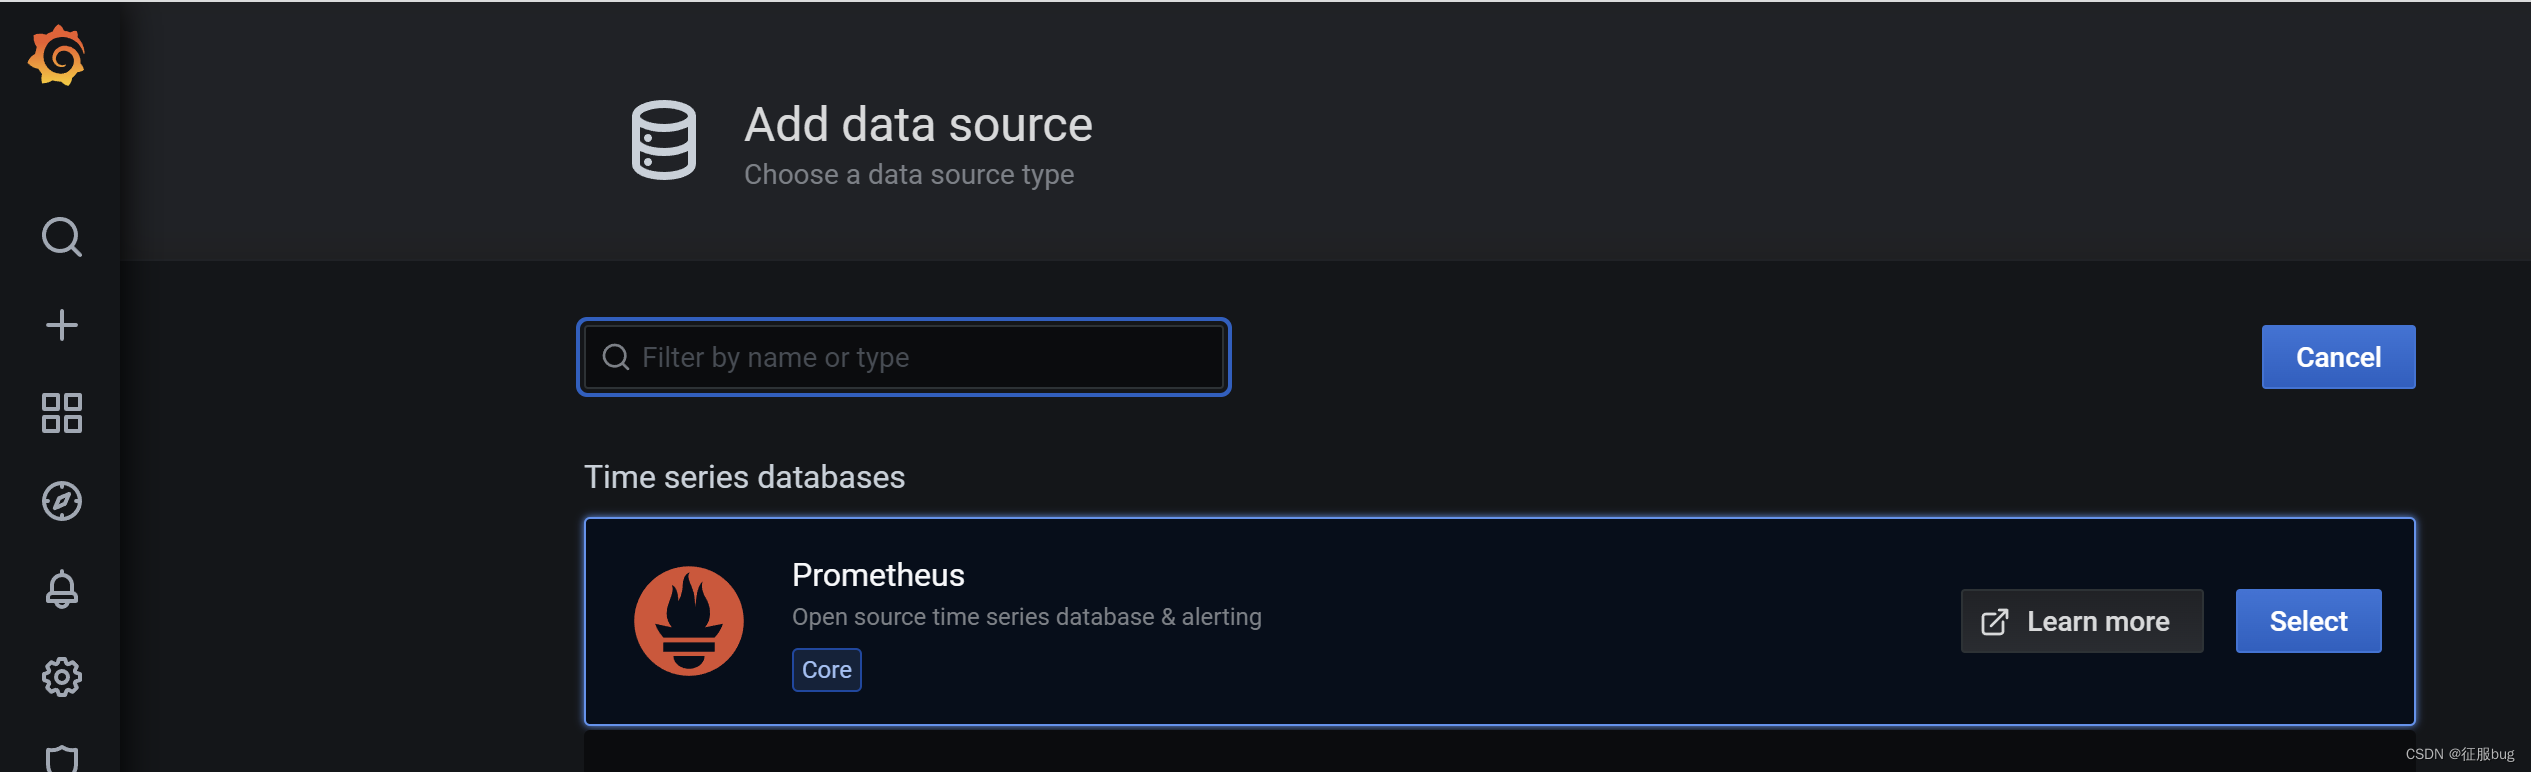
添加prometheus服务器
4.添加dashboard Linux基础数据展示
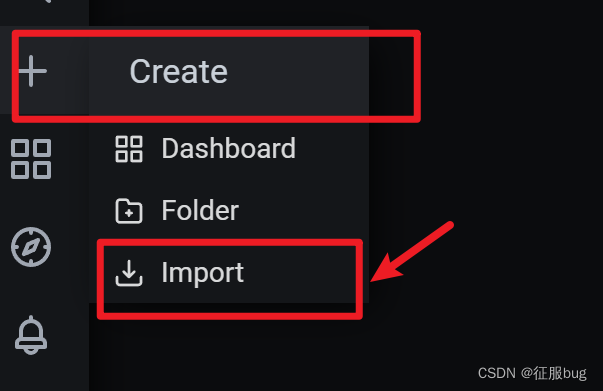
导入模板8919
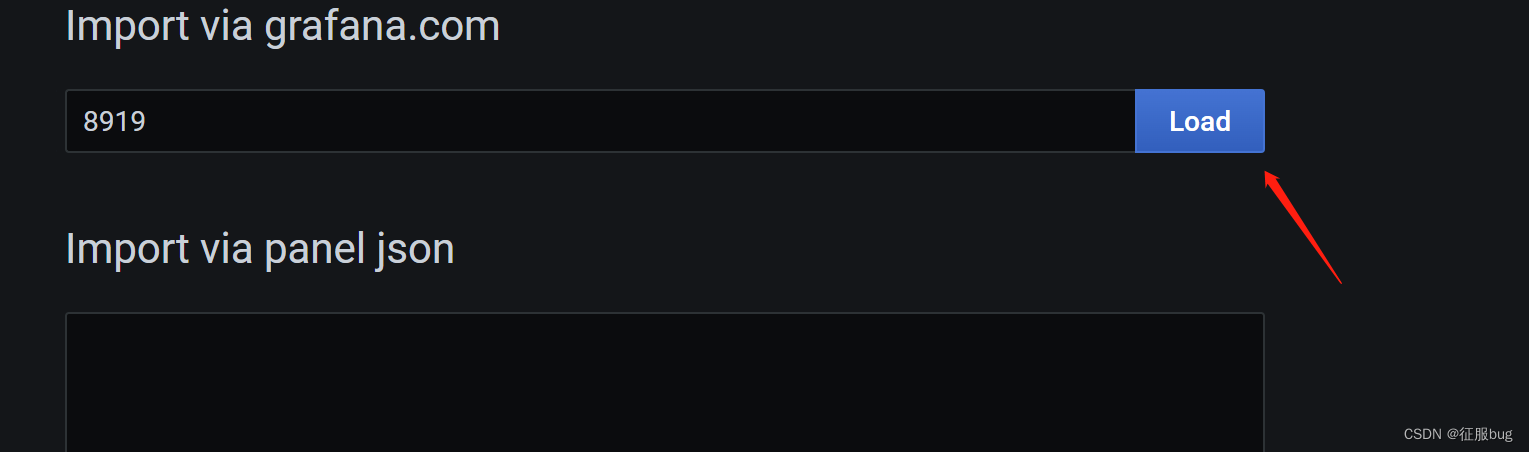
选择数据源

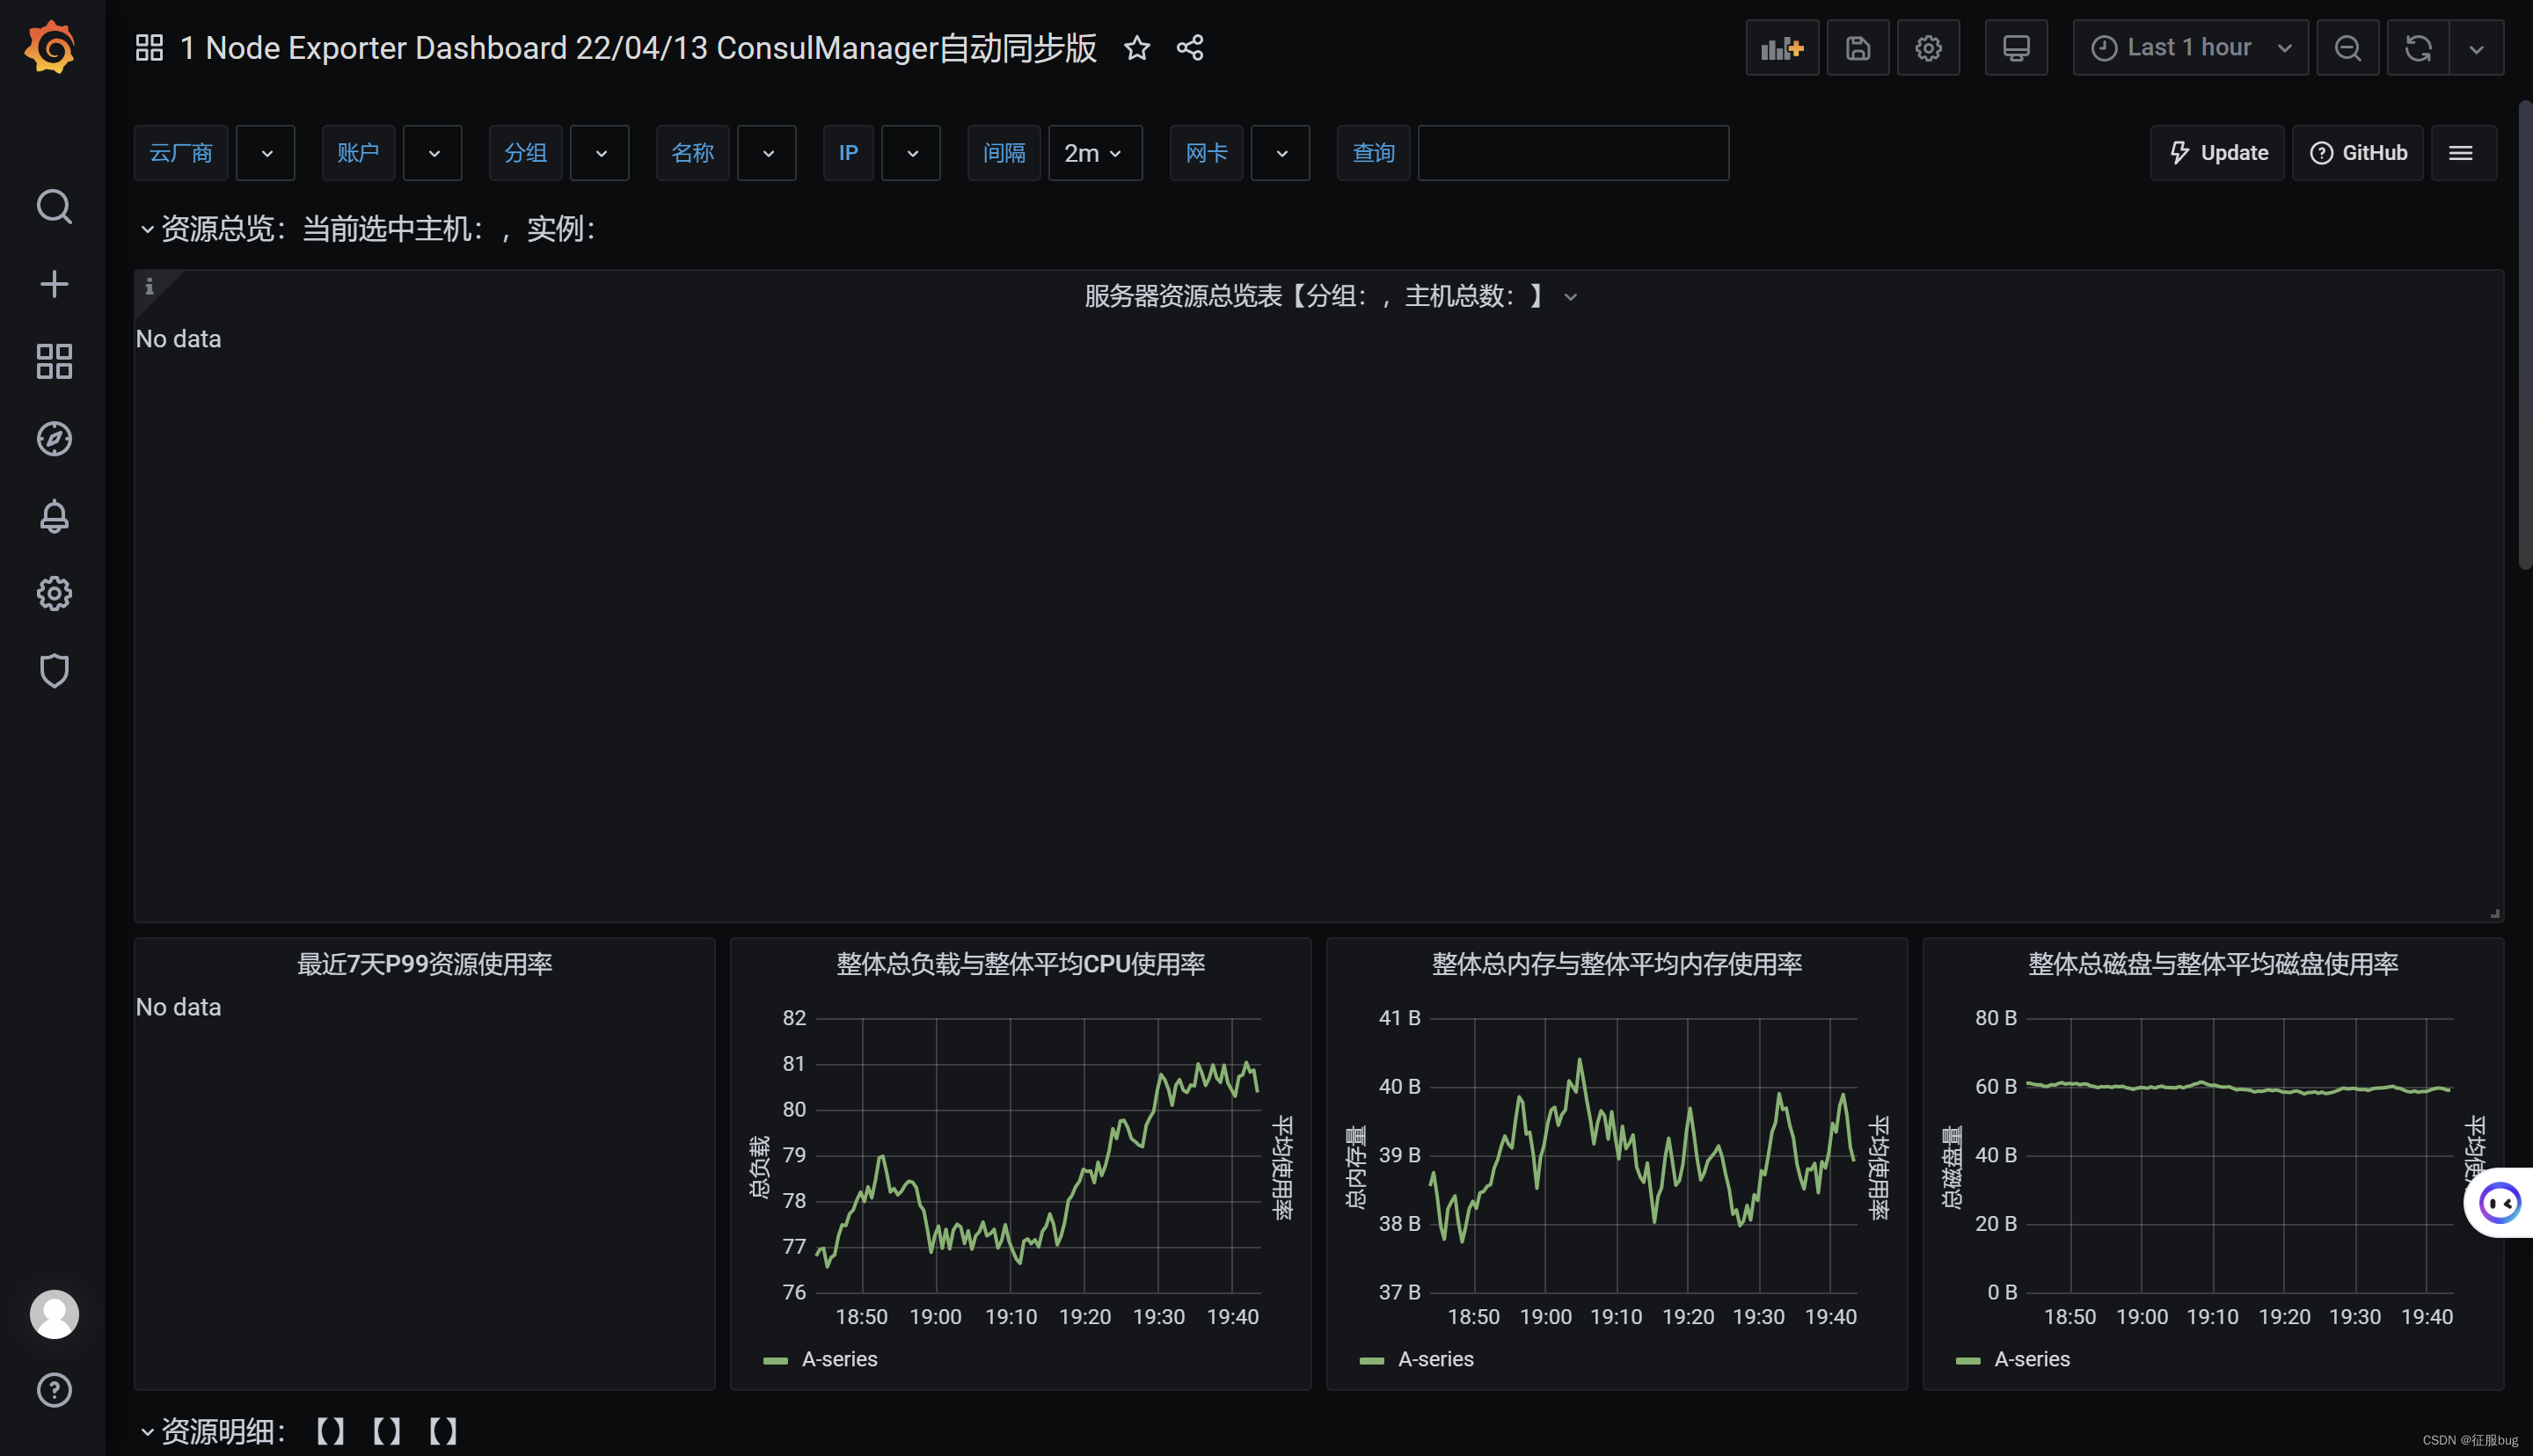
5.查看dashboard
Dashboards ->Manage
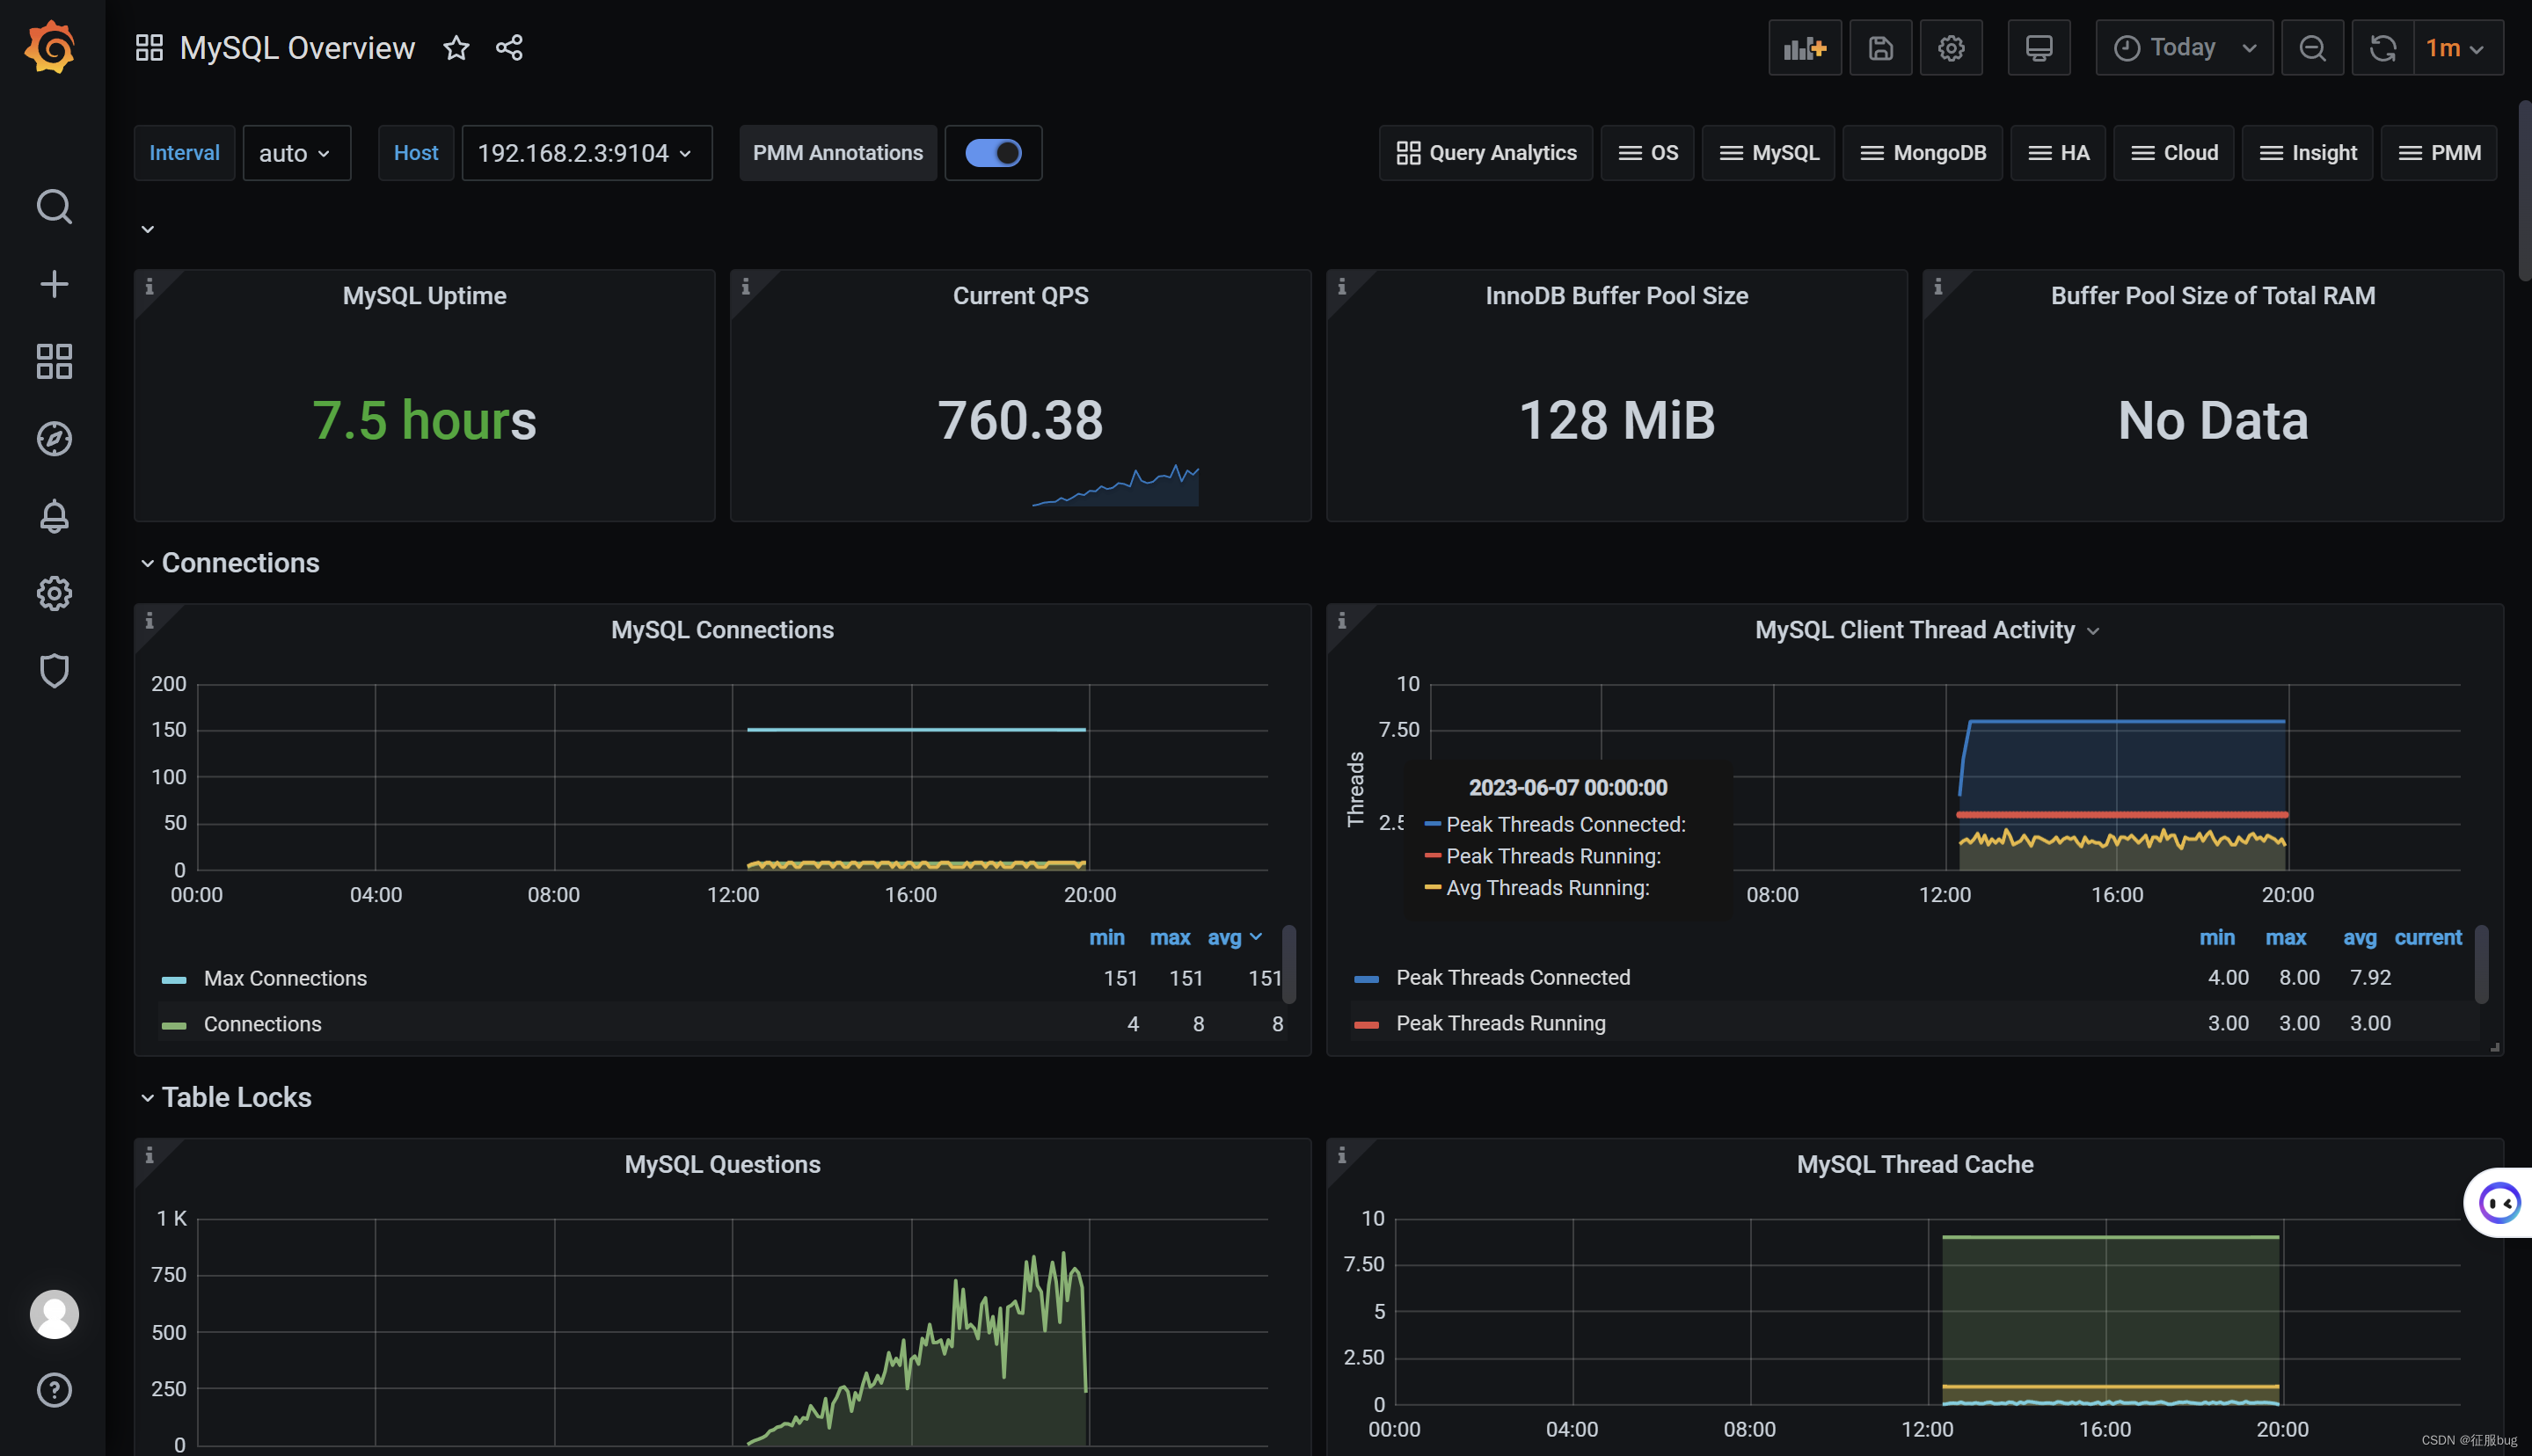
六,grafana展示MySQL信息
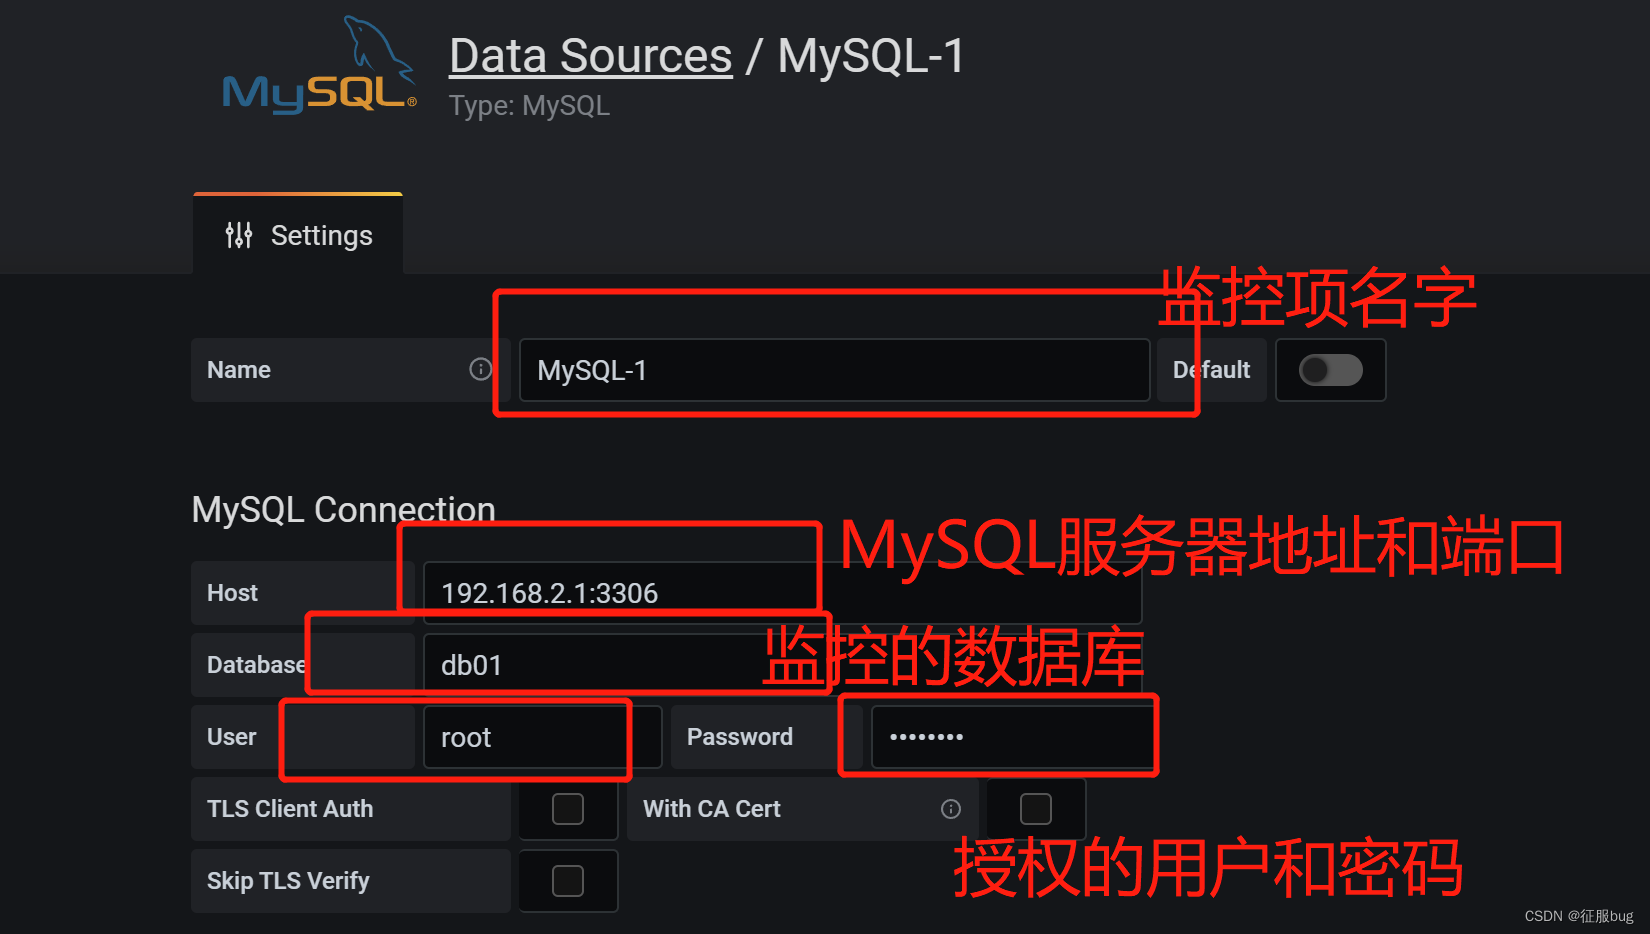
1.设置数据源
Configuration -> Data Sources ->add data source -> MySQL

2.数据库上授权用户
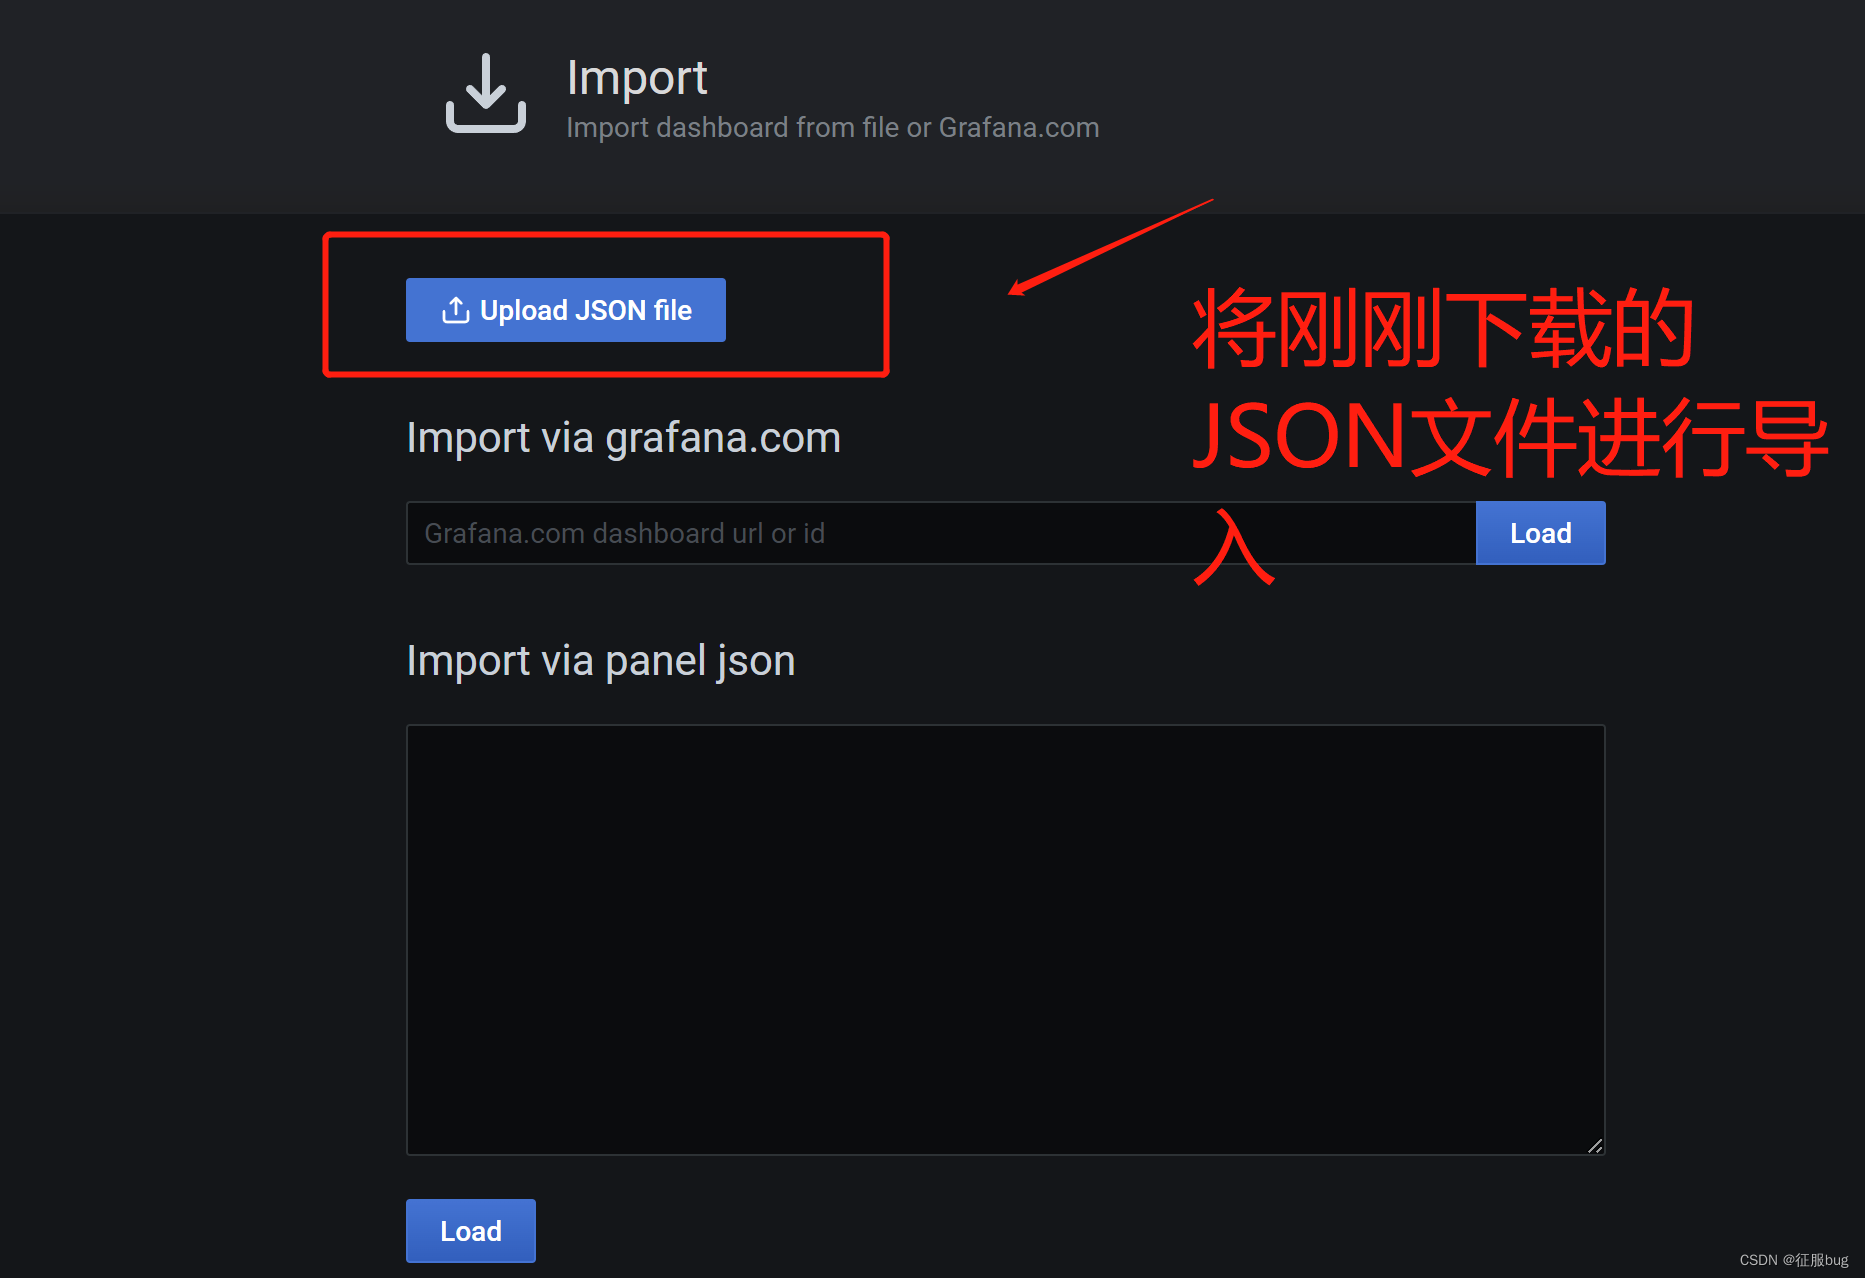
3.导入下载的dashboard,数据源现在刚刚创建的
https://pan.baidu.com/s/1GBzogDLsYS3IvwH4WbdPLw 提取码:ef6e
4.查看效果