面对各种定制,echarts图表有时候不好处理,无论是数据处理还是样式处理,都会被echarts限制。
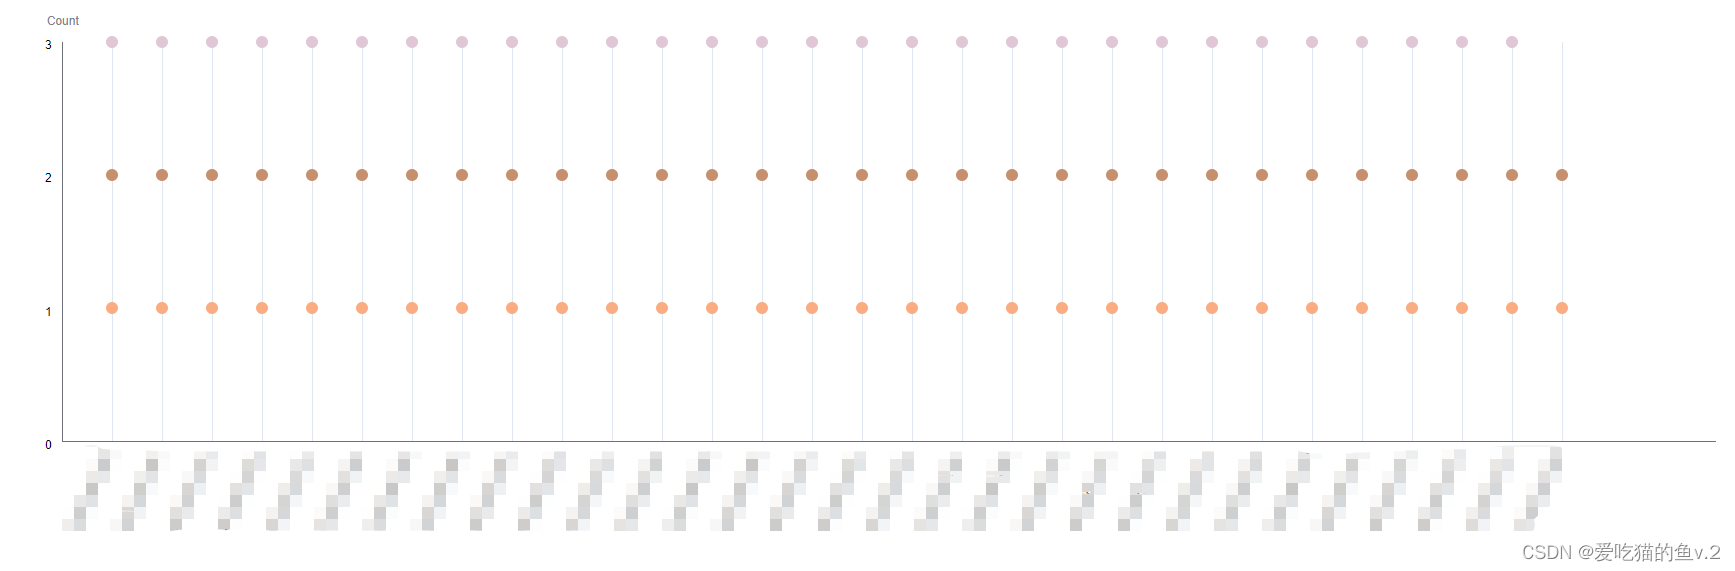
举例:echarts散点图如果数据较少,echarts会均匀分布,如图1
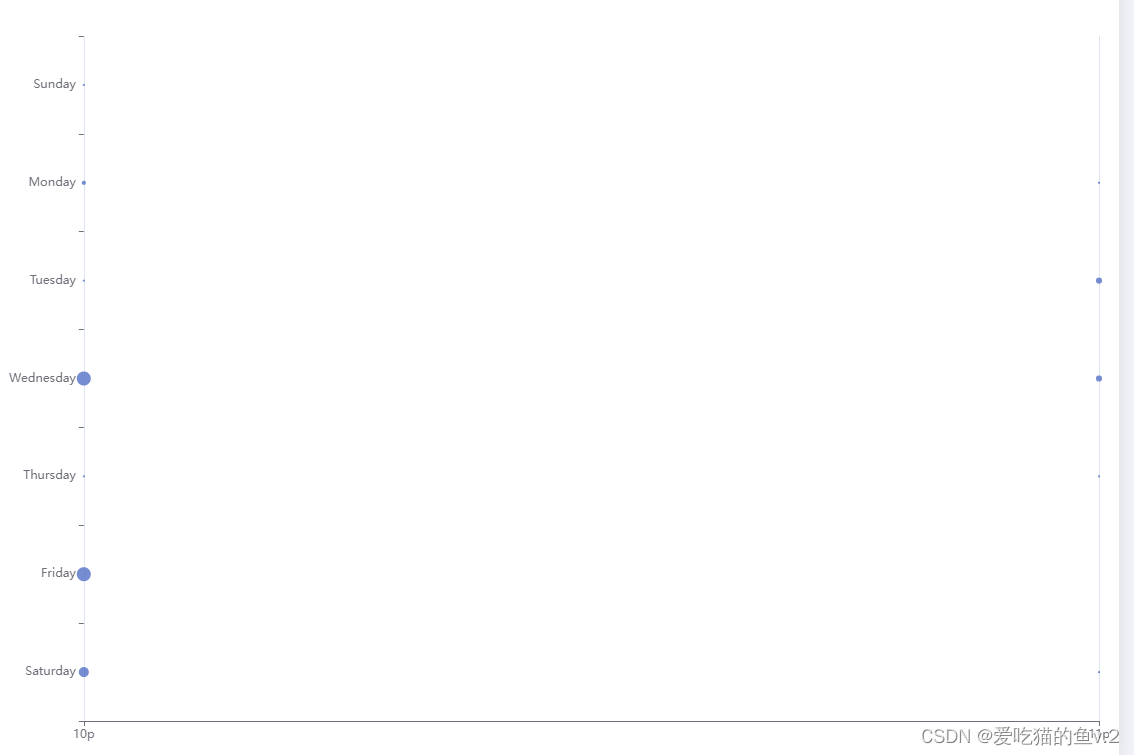
对于产品或者老板对页面的要求,认为中间空的太多,要求如果x轴的数据较少时,依次排开,如果用echarts的xAxis.max,只要数据中的 X 值超过了它,那么图表会自动扩展 X 轴范围,不能固定范围
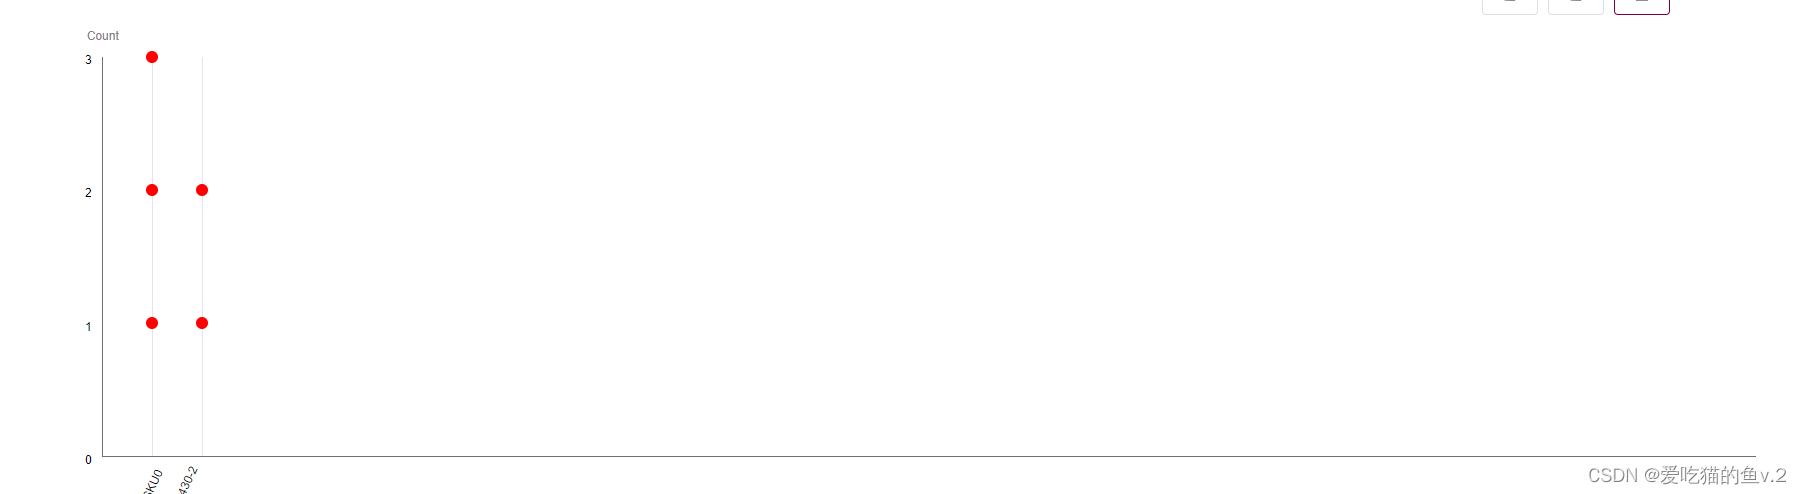
直接看效果图
前端用的vue,数据结构仅供参考,可以自行修改
<div class="sku-supplier-chart">
        <div class="chart-count">Count</div>
        <div class="chart-yAxias">
          <div
            class="y-item"
            v-for="(item, index) in maxSupllierCount + 1"
            :key="index"
            :style="{
              bottom: `calc(${(index * 100) / maxSupllierCount}% - 12px)`,
            }"
          >
            {{ index }}
          </div>
        </div>
        <div class="chart-content">
          <div
            class="item-line"
            :style="{ width: itemLineWidth + 'px' }"
            v-for="(item, index) in skuList"
            :key="index"
          >
            <template v-for="(dropItem, dropIndex) in item.supplierList">
              <el-popover
                :key="dropIndex"
                placement="top-start"
                :title="item.productNo"
                width="230"
                trigger="hover"
                content=""
              >
                <p>
                  <span style="font-weight: bold"
                    >{{ currentDropItem.companyName }}: </span
                  ><span>{{ currentDropItem.unitPrice }} </span>
                  <span>{{ currentDropItem.unitPriceLov }}</span>
                </p>
                <div
                  slot="reference"
                  class="item-drop"
                  :key="dropIndex"
                  :style="{
                    bottom: `calc(${
                      (100 / maxSupllierCount) * (dropIndex + 1)
                    }% - 6px)`,
                    backgroundColor: dropItem.hexColor,
                  }"
                  @mouseover="mouseoverDropItem(dropItem)"
                  @mouseout="mouseoutDropItem(dropItem)"
                ></div>
              </el-popover>
            </template>

            <div class="sku-title">
              <span>{{ item.productNo }}</span>
            </div>
          </div>
        </div>
      </div>
data(){
    return{
      skuList: [
          {
            rfqNo: "Test2304040004",
            productNo: "Test0430SKU0430SKU0",
            productName: "Mutton",
            rfqProQty: 1,
            supplierList: [
              {
                severalRound: 1,
                companyName: "test01",
                companyCode: "SCNGD230003",
                unitPrice: 5.6,
                unitPriceLov: "USD",
                quoteQty: 50,
                hexColor: "red",
              },
              {
                severalRound: 1,
                companyName: "test02",
                companyCode: "SCNGD230003",
                unitPrice: 5.6,
                unitPriceLov: "USD",
                quoteQty: 50,
                hexColor: "red",
              },
              {
                severalRound: 1,
                companyName: "test03",
                companyCode: "SCNGD230003",
                unitPrice: 5.6,
                unitPriceLov: "USD",
                quoteQty: 50,
                hexColor: "red",
              },
            ],
          },
          {
            rfqNo: "Test2304040003",
            productNo: "Test2",
            productName: "Mutton",
            rfqProQty: 1,
            supplierList: [
              {
                severalRound: 1,
                companyName: "test02",
                companyCode: "SCNGD230003",
                unitPrice: 5.6,
                unitPriceLov: "USD",
                quoteQty: 50,
                hexColor: "red",
              },
              {
                severalRound: 1,
                companyName: "test03",
                companyCode: "SCNGD230003",
                unitPrice: 5.6,
                unitPriceLov: "USD",
                quoteQty: 50,
                hexColor: "red",
              },
            ],
          },
        ],
      itemLineWidth: 50,
      maxSupllierCount: skuList?.[0]?.supplierList?.length || 0,
    }
}
.sku-supplier-chart {
  height: 550px;
  width: 100%;
  margin-top: 42px;
  display: flex;
  position: relative;
  .chart-count {
    position: absolute;
    top: -30px;
    left: 15px;
    color: #7f8189;
  }
  .chart-yAxias {
    width: 30px;
    height: 400px;
    position: relative;
    .y-item {
      position: absolute;
      right: 10px;
      .y-span {
        color: red;
      }
    }
  }
  .chart-content {
    height: 400px;
    flex: 1;
    border-left: 1px solid #6e7079;
    border-bottom: 1px solid #6e7079;
    display: flex;

    .item-line {
      width: 40px;
      height: 100%;
      border-right: 1px solid #e0e6f1;
      position: relative;
      .item-drop {
        width: 12px;
        height: 12px;
        border-radius: 50%;
        position: absolute;
        left: 43px;
        cursor: pointer;
        z-index: 99;
        transition: all 0.5s;
        &:hover {
          transform: scale(1.4);
        }
      }

      .sku-title {
        position: absolute;
        bottom: -102%;
        left: 19px;
        writing-mode: vertical-lr;
        display: flex;
        height: 100%;
        //   transform: rotate(325deg);
        //   width: 120px;
        //   bottom: -4%;
        //   left: -18%;
        span {
          transform: rotate(205deg);
        }
      }
    }
  }
}
该手绘散点图只添加了鼠标移入某个点展示对应的数据与样式优化,如有其它好用的方法欢迎评论~