Numpy入门[2]——Matplotlib 基础
参考:
https://ailearning.apachecn.org/
Python直接使用plot()函数画图
使用Jupyter进行练习
在使用Numpy之前,需要了解一些画图的基础。
Matplotlib是一个类似Matlab的工具包,主页地址为
http://matplotlib.org
导入 matplotlib 和 numpy:
import numpy as np
import matplotlib.pyplot as plt
plot二维图
plot(y)
plot(x, y)
plot(x, y, format_string)
只给定 y 值,默认以下标为 x 轴:
# 等距分
x = np.linspace(0, 2*np.pi,50)
plt.plot(np.sin(x))
[<matplotlib.lines.Line2D at 0x25593113dc0>]
![[外链图片转存失败,源站可能有防盗链机制,建议将图片保存下来直接上传(img-8GBhphPF-1669946179150)(https://note-image-1307786938.cos.ap-beijing.myqcloud.com/typora/02Matlpotlib%E5%9F%BA%E7%A1%80_4_1.png)]](https://img-blog.csdnimg.cn/6cbf8e5aaff44f9db88d5852b5a36b47.png)
给定 x 和 y 值:
plt.plot(x,np.sin(x))
[<matplotlib.lines.Line2D at 0x2559318d040>]
![[外链图片转存失败,源站可能有防盗链机制,建议将图片保存下来直接上传(img-vonmLHTi-1669946179152)(https://note-image-1307786938.cos.ap-beijing.myqcloud.com/typora/02Matlpotlib%E5%9F%BA%E7%A1%80_6_1.png)]](https://img-blog.csdnimg.cn/7d012f61126c468c9abad36e3d00c442.png)
多条数据线:
plt.plot(x, np.sin(x), x, np.sin(2*x))
[<matplotlib.lines.Line2D at 0x25593231d60>,
 <matplotlib.lines.Line2D at 0x25593231d90>]
![[外链图片转存失败,源站可能有防盗链机制,建议将图片保存下来直接上传(img-yUWXaRyq-1669946179153)(https://note-image-1307786938.cos.ap-beijing.myqcloud.com/typora/02Matlpotlib%E5%9F%BA%E7%A1%80_8_1.png)]](https://img-blog.csdnimg.cn/eb95fd762cb94c51ac84333b64e2c41e.png)
使用字符串,给定线条参数:
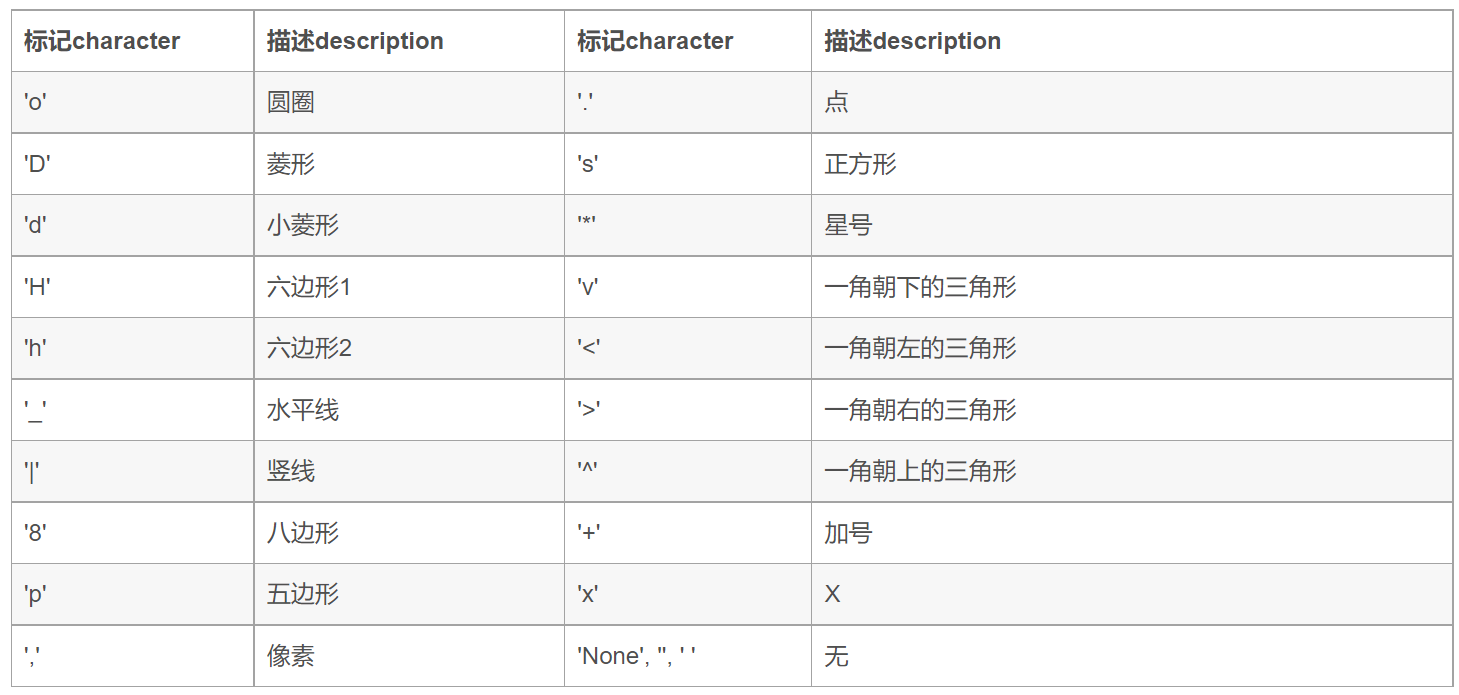
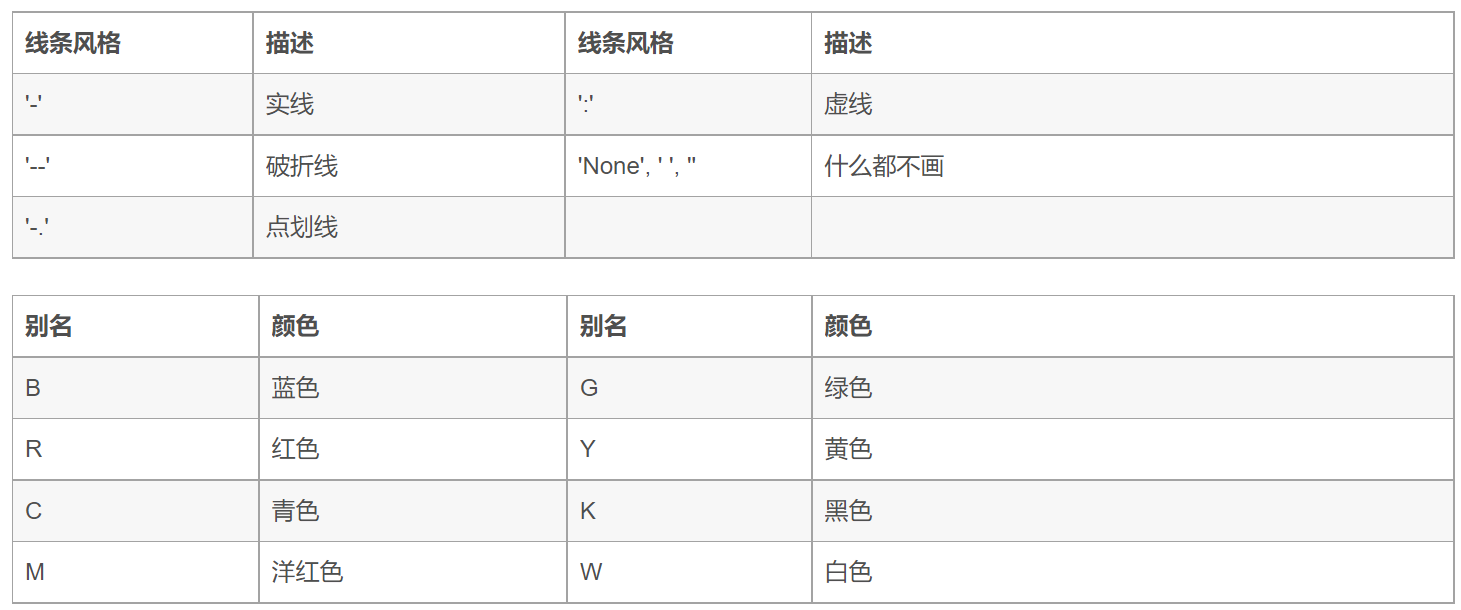
plt.plot(x,np.sin(x),'r-^')
[<matplotlib.lines.Line2D at 0x255933e4b80>]
![[外链图片转存失败,源站可能有防盗链机制,建议将图片保存下来直接上传(img-ge4jhnKO-1669946179156)(https://note-image-1307786938.cos.ap-beijing.myqcloud.com/typora/02Matlpotlib%E5%9F%BA%E7%A1%80_10_1.png)]](https://img-blog.csdnimg.cn/9caab51fa08d4ad4a045998166adf06f.png)
多线条:
plt.plot(x, np.sin(x), "b-o",x, np.sin(2*x),"r-^")
[<matplotlib.lines.Line2D at 0x255932d87f0>,
 <matplotlib.lines.Line2D at 0x255932d88b0>]
![[外链图片转存失败,源站可能有防盗链机制,建议将图片保存下来直接上传(img-ZfzxppL0-1669946179159)(https://note-image-1307786938.cos.ap-beijing.myqcloud.com/typora/02Matlpotlib%E5%9F%BA%E7%A1%80_12_1.png)]](https://img-blog.csdnimg.cn/f6507c992c2e47588b5a9a5e1c0211f8.png)
scatter 散点图
scatter(x, y)
scatter(x, y, size)
scatter(x, y, size, color)
画二维散点图
plt.plot(x,np.sin(x),"bo")
[<matplotlib.lines.Line2D at 0x25592028ca0>]
![[外链图片转存失败,源站可能有防盗链机制,建议将图片保存下来直接上传(img-BYnNX7L1-1669946179160)(https://note-image-1307786938.cos.ap-beijing.myqcloud.com/typora/02Matlpotlib%E5%9F%BA%E7%A1%80_15_1.png)]](https://img-blog.csdnimg.cn/e3963f43de9749098050991cf58ba95b.png)
可以使用 scatter 达到同样的效果:
plt.scatter(x, np.sin(x))
<matplotlib.collections.PathCollection at 0x25591e62940>
![[外链图片转存失败,源站可能有防盗链机制,建议将图片保存下来直接上传(img-20UYQcLE-1669946179161)(https://note-image-1307786938.cos.ap-beijing.myqcloud.com/typora/02Matlpotlib%E5%9F%BA%E7%A1%80_17_1.png)]](https://img-blog.csdnimg.cn/f41430330bc143b890739dbf92713b83.png)
scatter函数与Matlab的用法相同,还可以指定它的大小,颜色等参数:
from numpy import random
# 产生随机数组
x = random.rand(200)
y = random.rand(200)
size = random.rand(200) * 30
color = random.rand(200)
plt.scatter(x, y, size, color)
# 显示颜色条
plt.colorbar()
<matplotlib.colorbar.Colorbar at 0x2558f559af0>
![[外链图片转存失败,源站可能有防盗链机制,建议将图片保存下来直接上传(img-EOBWPnOa-1669946179161)(https://note-image-1307786938.cos.ap-beijing.myqcloud.com/typora/02Matlpotlib%E5%9F%BA%E7%A1%80_19_1.png)]](https://img-blog.csdnimg.cn/609e26512016499390206bf7384fd403.png)
多图
使用figure()命令产生新的图像:
t = np.linspace(0, 2 * np.pi, 50)
x = np.sin(t)
y = np.cos(t)
plt.figure()
plt.plot(x)
plt.figure()
plt.plot(y)
[<matplotlib.lines.Line2D at 0x2559333b970>]
![[外链图片转存失败,源站可能有防盗链机制,建议将图片保存下来直接上传(img-giRvyABB-1669946179162)(https://note-image-1307786938.cos.ap-beijing.myqcloud.com/typora/02Matlpotlib%E5%9F%BA%E7%A1%80_21_1.png)]](https://img-blog.csdnimg.cn/66f12ad4e8d5417fba15729161730eee.png)
![[外链图片转存失败,源站可能有防盗链机制,建议将图片保存下来直接上传(img-fpCfz158-1669946179162)(02Matlpotlib%E5%9F%BA%E7%A1%80_files/02Matlpotlib%E5%9F%BA%E7%A1%80_21_2.png)]](https://img-blog.csdnimg.cn/a3dacc744fa848f8adf7173dcb13d397.png)
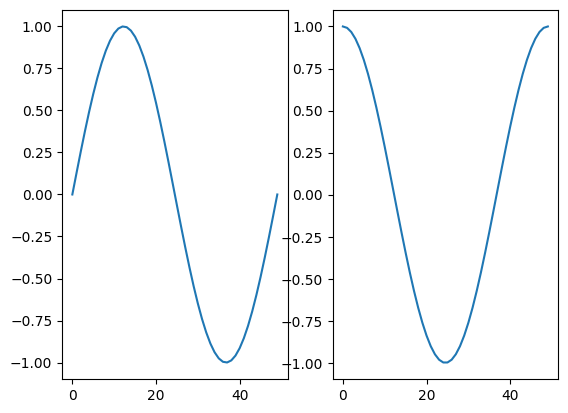
或者使用 subplot 在一幅图中画多幅子图:
subplot(row, column, index)
plt.subplot(1,2,1)
plt.plot(x)
plt.subplot(1,2,2)
plt.plot(y)
[<matplotlib.lines.Line2D at 0x2559344e4f0>]
标签
可以在 plot 中加入 label ,使用 legend 加上图例:
plt.plot(x, label='sin')
plt.plot(y, label='cos')
plt.legend()
<matplotlib.legend.Legend at 0x255946fd430>
![[外链图片转存失败,源站可能有防盗链机制,建议将图片保存下来直接上传(img-LblOKyhR-1669946179163)(https://note-image-1307786938.cos.ap-beijing.myqcloud.com/typora/02Matlpotlib%E5%9F%BA%E7%A1%80_25_1.png)]
](https://img-blog.csdnimg.cn/dbd652a4292a47caacfd9db39bf9a308.png)
或者直接在 legend中加入:
plt.plot(x)
plt.plot(y)
plt.legend(['sin','cos'])
<matplotlib.legend.Legend at 0x255948c3640>
![![[外链图片转存失败,源站可能有防盗链机制,建议将图片保存下来直接上传(img-y1LecGzc-1669946179164)(https://note-image-1307786938.cos.ap-beijing.myqcloud.com/typora/02Matlpotlib%E5%9F%BA%E7%A1%80_27_1.png)]
](https://img-blog.csdnimg.cn/14fd110533b64ad2b81d8cb882db403a.png)](https://img-blog.csdnimg.cn/5765501ba20440d8ac4f6f0a69f5e4f3.png)
坐标轴,标题,网格
可以设置坐标轴的标签和标题:
plt.plot(x,np.sin(x))
plt.xlabel("radians")
plt.ylabel("amplitude",fontsize="large")
plt.title('Sin(x)')
# 设置网格
plt.grid()
![[外链图片转存失败,源站可能有防盗链机制,建议将图片保存下来直接上传(img-ueZUo7sY-1669946179164)(https://note-image-1307786938.cos.ap-beijing.myqcloud.com/typora/02Matlpotlib%E5%9F%BA%E7%A1%80_30_0.png)]](https://img-blog.csdnimg.cn/f87679e32e71443cae49c138f7565627.png)
清除、关闭图像
- 清除已有图像使用:
clf() - 关闭当前图像:
close() - 关闭所有图像:
close('all')
从脚本中运行
在脚本中使用 plot 时,通常图像是不会直接显示的,需要增加 show() 选项,只有在遇到 show() 命令之后,图像才会显示。
直方图
从高斯分布随机生成1000个点得到的直方图:
plt.hist(np.random.randn(1000))
(array([  2.,   5.,  33., 147., 266., 298., 171.,  68.,   9.,   1.]),
 array([-4.06787487, -3.28558599, -2.50329712, -1.72100825, -0.93871938,
        -0.15643051,  0.62585836,  1.40814724,  2.19043611,  2.97272498,
         3.75501385]),
 <BarContainer object of 10 artists>)
![[外链图片转存失败,源站可能有防盗链机制,建议将图片保存下来直接上传(img-nhQ2tHyV-1669946179165)(https://note-image-1307786938.cos.ap-beijing.myqcloud.com/typora/02Matlpotlib%E5%9F%BA%E7%A1%80_34_1.png)]](https://img-blog.csdnimg.cn/568e77dcd45b45d89aca71d035259064.png)


![[附源码]计算机毕业设计springboot校园订餐系统](https://img-blog.csdnimg.cn/f3ab27f87e744862b7ffb9597fcba1ea.png)

![[附源码]计算机毕业设计游戏论坛网站Springboot程序](https://img-blog.csdnimg.cn/7c37ed6dc0404455a7ec0d871165713c.png)