Pandas处理分析网站原始访问日志
目标:真实项目的实战,探索Pandas的数据处理与分析
实例:
数据来源:我自己的wordpress博客蚂蚁学Python – 你有没有为写代码拼过命?那你知不知道 人生苦短,我用Python? 的访问日志
实现步骤:
1、读取数据、清理、格式化
2、统计爬虫spider的访问比例,输出柱状图
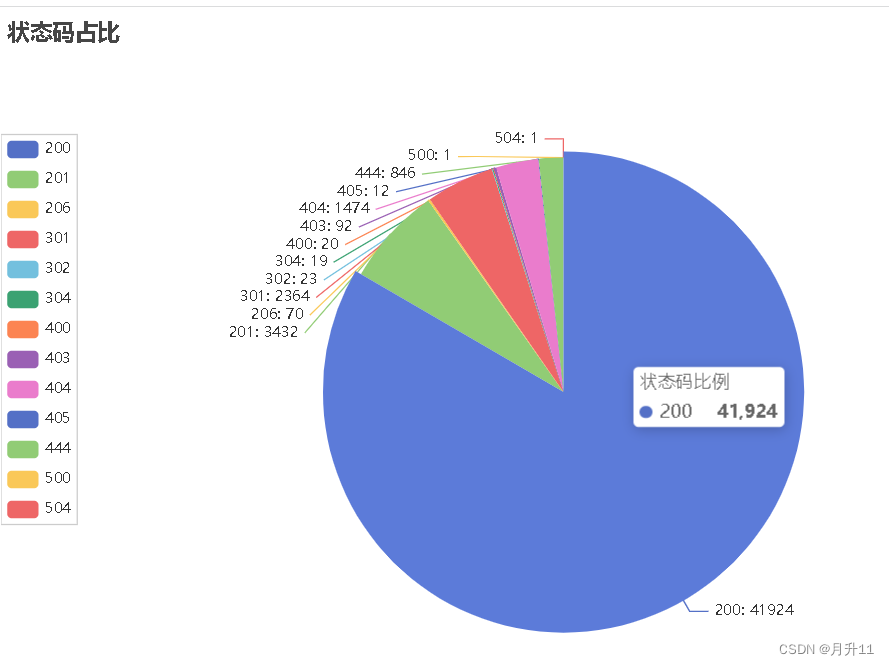
3、统计http状态码的访问占比,输出饼图
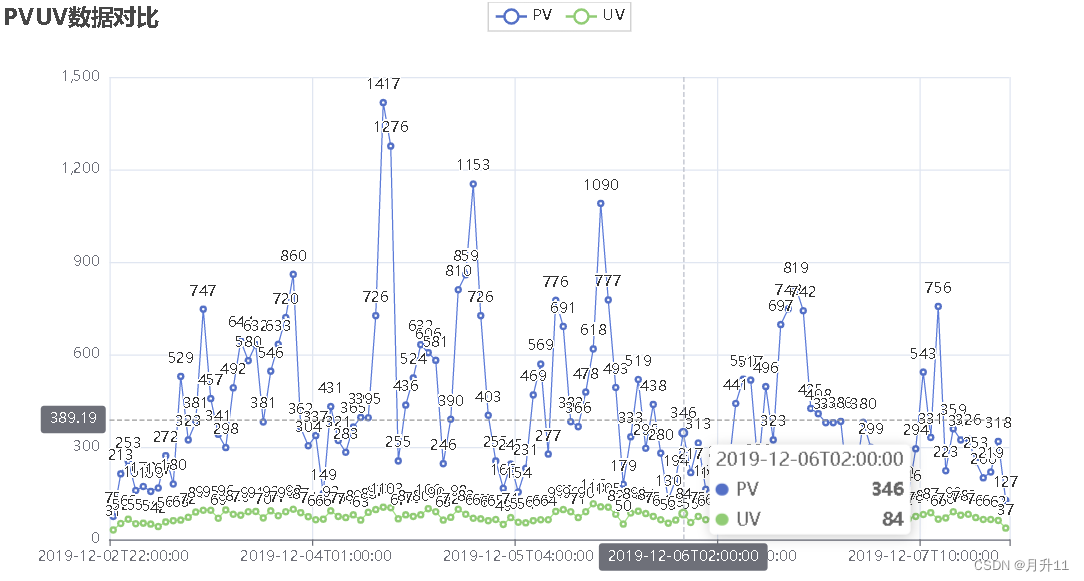
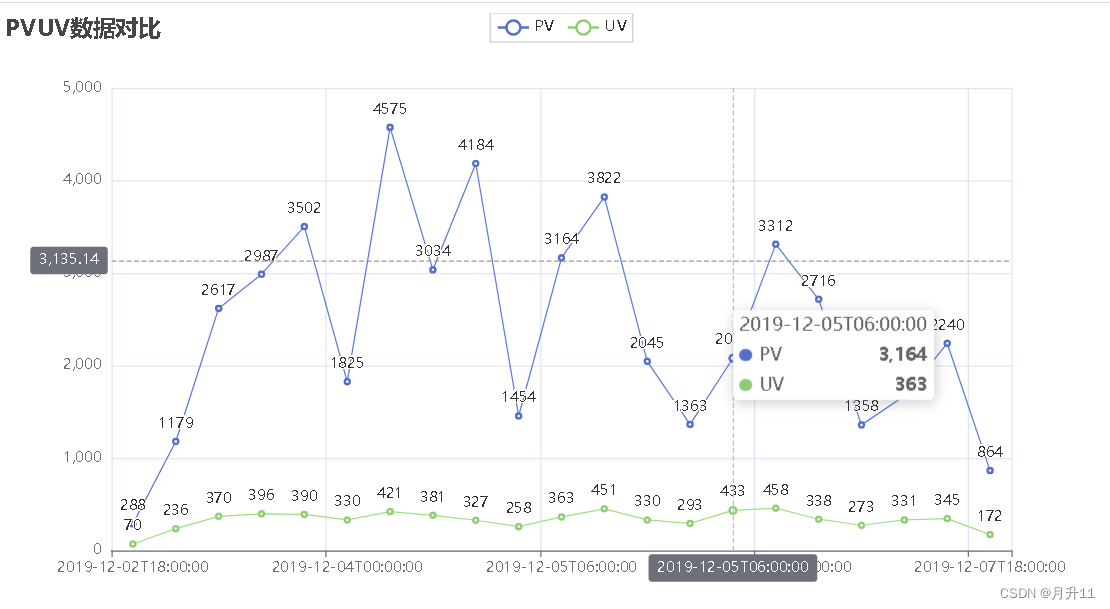
4、统计按小时、按天的PV/UV流量趋势,输出折线图
1、读取数据并清理格式化
In [1]:
import pandas as pd
import numpy as np
pd.set_option('display.max_colwidth', -1)
from pyecharts import options as opts
from pyecharts.charts import Bar,Pie,Line
In [2]:
# 读取整个目录,将所有的文件合并到一个dataframe
data_dir = "./datas/crazyant/blog_access_log"
df_list = []
import os
for fname in os.listdir(f"{data_dir}"):
df_list.append(pd.read_csv(f"{data_dir}/{fname}", sep=" ", header=None, error_bad_lines=False))
df = pd.concat(df_list)
b'Skipping line 2245: expected 10 fields, saw 16\nSkipping line 2889: expected 10 fields, saw 14\nSkipping line 2890: expected 10 fields, saw 14\nSkipping line 2891: expected 10 fields, saw 13\nSkipping line 2892: expected 10 fields, saw 13\nSkipping line 2900: expected 10 fields, saw 11\nSkipping line 2902: expected 10 fields, saw 11\nSkipping line 3790: expected 10 fields, saw 14\nSkipping line 3791: expected 10 fields, saw 14\nSkipping line 3792: expected 10 fields, saw 13\nSkipping line 3793: expected 10 fields, saw 13\nSkipping line 3833: expected 10 fields, saw 11\nSkipping line 3835: expected 10 fields, saw 11\nSkipping line 9936: expected 10 fields, saw 16\n'
b'Skipping line 11748: expected 10 fields, saw 11\nSkipping line 11750: expected 10 fields, saw 11\n'
In [3]:
df.head()
Out[3]:
| 0 | 1 | 2 | 3 | 4 | 5 | 6 | 7 | 8 | 9 | |
|---|---|---|---|---|---|---|---|---|---|---|
| 0 | 106.11.153.226 | - | - | [02/Dec/2019:22:40:18 | +0800] | GET /740.html?replytocom=1194 HTTP/1.0 | 200 | 13446 | - | YisouSpider |
| 1 | 42.156.254.60 | - | - | [02/Dec/2019:22:40:23 | +0800] | POST /wp-json/wordpress-popular-posts/v1/popular-posts HTTP/1.0 | 201 | 55 | http://www.crazyant.net/740.html?replytocom=1194 | Mozilla/5.0 (Windows NT 6.1; Win64; x64) AppleWebKit/537.36 (KHTML, like Gecko) Chrome/69.0.3497.81 YisouSpider/5.0 Safari/537.36 |
| 2 | 106.11.159.254 | - | - | [02/Dec/2019:22:40:27 | +0800] | GET /576.html HTTP/1.0 | 200 | 13461 | - | YisouSpider |
| 3 | 106.11.157.254 | - | - | [02/Dec/2019:22:40:28 | +0800] | GET /?lwfcdw=t9n2d3&oqzohc=m5e7j1&oubyvq=iab6a3&oudmbg=6osqd3 HTTP/1.0 | 200 | 10485 | - | YisouSpider |
| 4 | 42.156.137.109 | - | - | [02/Dec/2019:22:40:30 | +0800] | POST /wp-json/wordpress-popular-posts/v1/popular-posts HTTP/1.0 | 201 | 55 | http://www.crazyant.net/576.html | Mozilla/5.0 (Windows NT 6.1; Win64; x64) AppleWebKit/537.36 (KHTML, like Gecko) Chrome/69.0.3497.81 YisouSpider/5.0 Safari/537.36 |
In [4]:
df = df[[0, 3, 6, 9]].copy()
df.head()
Out[4]:
| 0 | 3 | 6 | 9 | |
|---|---|---|---|---|
| 0 | 106.11.153.226 | [02/Dec/2019:22:40:18 | 200 | YisouSpider |
| 1 | 42.156.254.60 | [02/Dec/2019:22:40:23 | 201 | Mozilla/5.0 (Windows NT 6.1; Win64; x64) AppleWebKit/537.36 (KHTML, like Gecko) Chrome/69.0.3497.81 YisouSpider/5.0 Safari/537.36 |
| 2 | 106.11.159.254 | [02/Dec/2019:22:40:27 | 200 | YisouSpider |
| 3 | 106.11.157.254 | [02/Dec/2019:22:40:28 | 200 | YisouSpider |
| 4 | 42.156.137.109 | [02/Dec/2019:22:40:30 | 201 | Mozilla/5.0 (Windows NT 6.1; Win64; x64) AppleWebKit/537.36 (KHTML, like Gecko) Chrome/69.0.3497.81 YisouSpider/5.0 Safari/537.36 |
In [5]:
df.columns = ["ip", "stime", "status", "client"]
df.head()
Out[5]:
| ip | stime | status | client | |
|---|---|---|---|---|
| 0 | 106.11.153.226 | [02/Dec/2019:22:40:18 | 200 | YisouSpider |
| 1 | 42.156.254.60 | [02/Dec/2019:22:40:23 | 201 | Mozilla/5.0 (Windows NT 6.1; Win64; x64) AppleWebKit/537.36 (KHTML, like Gecko) Chrome/69.0.3497.81 YisouSpider/5.0 Safari/537.36 |
| 2 | 106.11.159.254 | [02/Dec/2019:22:40:27 | 200 | YisouSpider |
| 3 | 106.11.157.254 | [02/Dec/2019:22:40:28 | 200 | YisouSpider |
| 4 | 42.156.137.109 | [02/Dec/2019:22:40:30 | 201 | Mozilla/5.0 (Windows NT 6.1; Win64; x64) AppleWebKit/537.36 (KHTML, like Gecko) Chrome/69.0.3497.81 YisouSpider/5.0 Safari/537.36 |
In [6]:
df.dtypes
Out[6]:
ip        object
stime     object
status    int64
client    object
dtype: object
2、统计spider的比例
In [7]:
df["is_spider"] = df["client"].str.lower().str.contains("spider")
df.head()
Out[7]:
| ip | stime | status | client | is_spider | |
|---|---|---|---|---|---|
| 0 | 106.11.153.226 | [02/Dec/2019:22:40:18 | 200 | YisouSpider | True |
| 1 | 42.156.254.60 | [02/Dec/2019:22:40:23 | 201 | Mozilla/5.0 (Windows NT 6.1; Win64; x64) AppleWebKit/537.36 (KHTML, like Gecko) Chrome/69.0.3497.81 YisouSpider/5.0 Safari/537.36 | True |
| 2 | 106.11.159.254 | [02/Dec/2019:22:40:27 | 200 | YisouSpider | True |
| 3 | 106.11.157.254 | [02/Dec/2019:22:40:28 | 200 | YisouSpider | True |
| 4 | 42.156.137.109 | [02/Dec/2019:22:40:30 | 201 | Mozilla/5.0 (Windows NT 6.1; Win64; x64) AppleWebKit/537.36 (KHTML, like Gecko) Chrome/69.0.3497.81 YisouSpider/5.0 Safari/537.36 | True |
In [8]:
df_spider = df["is_spider"].value_counts()
df_spider
Out[8]:
False    46641
True     3637
Name: is_spider, dtype: int64
In [9]:
bar = (
Bar()
.add_xaxis([str(x) for x in df_spider.index])
.add_yaxis("是否Spider", df_spider.values.tolist())
.set_global_opts(title_opts=opts.TitleOpts(title="爬虫访问量占比"))
)
bar.render_notebook()
Out[9]:
3、访问状态码的数量对比
In [10]:
)
df_status
Out[10]:
status
200    41924
201    3432
206    70
301    2364
302    23
304    19
400    20
403    92
404    1474
405    12
444    846
500    1
504    1
dtype: int64
In [11]:
list(zip(df_status.index, df_status))
Out[11]:
[(200, 41924),
 (201, 3432),
 (206, 70),
 (301, 2364),
 (302, 23),
 (304, 19),
 (400, 20),
 (403, 92),
 (404, 1474),
 (405, 12),
 (444, 846),
 (500, 1),
 (504, 1)]
In [12]:
pie = (
Pie()
.add("状态码比例", list(zip(df_status.index, df_status)))
.set_series_opts(label_opts=opts.LabelOpts(formatter="{b}: {c}"))
)
pie.render_notebook()
Out[12]:
4、实现按小时、按天粒度的流量统计
In [13]:
df.head()
Out[13]:
| ip | stime | status | client | is_spider | |
|---|---|---|---|---|---|
| 0 | 106.11.153.226 | [02/Dec/2019:22:40:18 | 200 | YisouSpider | True |
| 1 | 42.156.254.60 | [02/Dec/2019:22:40:23 | 201 | Mozilla/5.0 (Windows NT 6.1; Win64; x64) AppleWebKit/537.36 (KHTML, like Gecko) Chrome/69.0.3497.81 YisouSpider/5.0 Safari/537.36 | True |
| 2 | 106.11.159.254 | [02/Dec/2019:22:40:27 | 200 | YisouSpider | True |
| 3 | 106.11.157.254 | [02/Dec/2019:22:40:28 | 200 | YisouSpider | True |
| 4 | 42.156.137.109 | [02/Dec/2019:22:40:30 | 201 | Mozilla/5.0 (Windows NT 6.1; Win64; x64) AppleWebKit/537.36 (KHTML, like Gecko) Chrome/69.0.3497.81 YisouSpider/5.0 Safari/537.36 | True |
In [14]:
df["stime"] = pd.to_datetime(df["stime"].str[1:], format="%d/%b/%Y:%H:%M:%S")
df.head()
Out[14]:
| ip | stime | status | client | is_spider | |
|---|---|---|---|---|---|
| 0 | 106.11.153.226 | 2019-12-02 22:40:18 | 200 | YisouSpider | True |
| 1 | 42.156.254.60 | 2019-12-02 22:40:23 | 201 | Mozilla/5.0 (Windows NT 6.1; Win64; x64) AppleWebKit/537.36 (KHTML, like Gecko) Chrome/69.0.3497.81 YisouSpider/5.0 Safari/537.36 | True |
| 2 | 106.11.159.254 | 2019-12-02 22:40:27 | 200 | YisouSpider | True |
| 3 | 106.11.157.254 | 2019-12-02 22:40:28 | 200 | YisouSpider | True |
| 4 | 42.156.137.109 | 2019-12-02 22:40:30 | 201 | Mozilla/5.0 (Windows NT 6.1; Win64; x64) AppleWebKit/537.36 (KHTML, like Gecko) Chrome/69.0.3497.81 YisouSpider/5.0 Safari/537.36 | True |
In [15]:
df.set_index("stime", inplace=True)
df.sort_index(inplace=True)
df.head()
Out[15]:
| ip | status | client | is_spider | |
|---|---|---|---|---|
| stime | ||||
| 2019-12-02 22:40:18 | 106.11.153.226 | 200 | YisouSpider | True |
| 2019-12-02 22:40:23 | 42.156.254.60 | 201 | Mozilla/5.0 (Windows NT 6.1; Win64; x64) AppleWebKit/537.36 (KHTML, like Gecko) Chrome/69.0.3497.81 YisouSpider/5.0 Safari/537.36 | True |
| 2019-12-02 22:40:27 | 106.11.159.254 | 200 | YisouSpider | True |
| 2019-12-02 22:40:28 | 106.11.157.254 | 200 | YisouSpider | True |
| 2019-12-02 22:40:30 | 42.156.137.109 | 201 | Mozilla/5.0 (Windows NT 6.1; Win64; x64) AppleWebKit/537.36 (KHTML, like Gecko) Chrome/69.0.3497.81 YisouSpider/5.0 Safari/537.36 | True |
In [16]:
df.index
Out[16]:
DatetimeIndex(['2019-12-02 22:40:18', '2019-12-02 22:40:23',
               '2019-12-02 22:40:27', '2019-12-02 22:40:28',
               '2019-12-02 22:40:30', '2019-12-02 22:40:46',
               '2019-12-02 22:41:52', '2019-12-02 22:41:52',
               '2019-12-02 22:41:55', '2019-12-02 22:42:16',
               ...
               '2019-12-07 21:30:16', '2019-12-07 21:30:17',
               '2019-12-07 21:30:19', '2019-12-07 21:30:20',
               '2019-12-07 21:30:21', '2019-12-07 21:30:22',
               '2019-12-07 21:30:23', '2019-12-07 21:30:56',
               '2019-12-07 21:30:58', '2019-12-07 21:31:02'],
              dtype='datetime64[ns]', name='stime', length=50278, freq=None)
In [21]:
# 按小时统计
#df_pvuv = df.resample("H")["ip"].agg(pv=np.size, uv=pd.Series.nunique)
# 按每6个小时统计
#df_pvuv = df.resample("6H")["ip"].agg(pv=np.size, uv=pd.Series.nunique)
# 按天统计
df_pvuv = df.resample("D")["ip"].agg(pv=np.size, uv=pd.Series.nunique)
df_pvuv.head()
Out[21]:
| pv | uv | |
|---|---|---|
| stime | ||
| 2019-12-02 | 288 | 70 |
| 2019-12-03 | 10285 | 1180 |
| 2019-12-04 | 13618 | 1197 |
| 2019-12-05 | 10485 | 1152 |
| 2019-12-06 | 9469 | 1261 |
In [22]:
line = (
Line()
.add_xaxis(df_pvuv.index.to_list())
.add_yaxis("PV", df_pvuv["pv"].to_list())
.add_yaxis("UV", df_pvuv["uv"].to_list())
.set_global_opts(
title_opts=opts.TitleOpts(title="PVUV数据对比"),
tooltip_opts=opts.TooltipOpts(trigger="axis", axis_pointer_type="cross")
)
)
line.render_notebook()
import pandas as pd
import numpy as np
import os

# max_colwidth参数设置10就是10列
pd.set_option('display.max_colwidth', 10)

from pyecharts import options as opts
from pyecharts.charts import Bar, Pie, Line

# 读取整个目录,将所有的文件合并到一个dataframe
data_dir = './crazyant/blog_access_log'

df_list = []
for fname in os.listdir(f'{data_dir}'):
    # 用read_csv读取文件并加入列表
    df_list.append(pd.read_csv(f'{data_dir}/{fname}', sep=" ", header=None, on_bad_lines='skip'))

df = pd.concat(df_list)
print(df.head())

df = df[[0, 3, 6, 9]].copy()
print(df.head())
#重命名
df.columns = ['ip', 'stime', 'status', 'client']
print(df.head())
print(df.dtypes)
#判断是否为爬虫
df['is_spider'] = df['client'].str.lower().str.contains('spider')
print(df.head())
#获取爬虫与非爬虫数量并做成柱状图
df_spider = df['is_spider'].value_counts()
print(df_spider)
#bar柱状图类和opts(选项)类
bar = (
    Bar()
    .add_xaxis([str(x) for x in df_spider.index])
    .add_yaxis('是否Spider', df_spider.values.tolist())
    #set_global_opts() 方法用于设置全局选项
    .set_global_opts(title_opts=opts.TitleOpts(title="爬虫访问量占比"))
)

bar.render('./crazyant/cbar.html')

# 3.访问状态马的数量对比
df_status = df.groupby("status").size()#以status列进行分组,并统计每组中的数量
print(df_status)

print(list(zip(df_status.index, df_status)))
#利用饼图将状态码比例可视化
# Pie()表示饼图,.add()表示添加数据,.set_series_opts()表示设置系列配置
# 这个是横版 但是调了一些想加标题但是奇奇怪怪的
pie = (
    Pie()
    .add("状态码比例", list(zip(df_status.index.map(str), df_status)))# 添加数据,横坐标为df_status中的索引,纵坐标为df_status中的索引值大小
    .set_series_opts(label_opts=opts.LabelOpts(formatter="{b}: {c}")) # 设置系列配置,显示文字格式为“{b}: {c}”

)
pie.render('./crazyant/piebar1.html')

# 这个是竖着的
pie = (
    Pie()
    .add(
        "状态码比例",
        list(zip(df_status.index.map(str), df_status)),
        center=["50%", "60%"]  # 设置饼图的中心位置
    )
    .set_series_opts(
        label_opts=opts.LabelOpts(formatter="{b}: {c}"),
        center=["50%", "60%"]  # 设置饼图的中心位置
    )
    .set_global_opts(
        title_opts=opts.TitleOpts(title="状态码占比"),
        legend_opts=opts.LegendOpts(
            orient='vertical',# 设置图例的排列方向为垂直方向
            pos_top='center',# 设置图例的上边距为“center”,即垂直方向上居中
            pos_left='left'# 设置图例的左边距为“left”
        )
    )
)
pie.render('./crazyant/piebar2.html')

# 实现按小时、按天粒度的流量统计
print(df.head())
# 将日期按格式转换成时间戳的形式
df['stime'] = pd.to_datetime(df['stime'].str[1:], format='%d/%b/%Y:%H:%M:%S')
print(df.head())
#stime变为索引列,inplace原地改
df.set_index('stime', inplace=True)
df.sort_index(inplace=True)
print(df.head())
print(df.index)

# 按照小时统计
df_pvuv1 = df.resample('H')['ip'].agg(pv=np.size, uv=pd.Series.nunique)
# # 按照每六小时统计
df_pvuv2 = df.resample('6H')['ip'].agg(pv=np.size, uv=pd.Series.nunique)
# 按天统计
df_pvuv3 = df.resample('D')['ip'].agg(pv=np.size, uv=pd.Series.nunique)
#折线图line
#tooltip_opts=opts.TooltipOpts(trigger='axis',axis_pointer_type='cross')
# 表示设置悬浮提示框,在鼠标移动到数据点时会自动显示数据信息,并且横轴和纵轴的提示线都同时显示
line1=(
    Line()
    .add_xaxis(df_pvuv1.index.to_list())
    .add_yaxis('PV',df_pvuv1['pv'].to_list())
    #df_pvuv1.index.to_list() 表示将 df_pvuv1 的索引转换为列表,并作为 x 轴标签
    .add_yaxis('UV',df_pvuv1['uv'].to_list())
    .set_global_opts(
        title_opts=opts.TitleOpts(title='PVUV数据对比'),
        tooltip_opts=opts.TooltipOpts(trigger='axis',axis_pointer_type='cross')
    )
)
line2=(
    Line()
    .add_xaxis(df_pvuv2.index.to_list())
    .add_yaxis('PV',df_pvuv2['pv'].to_list())
    .add_yaxis('UV',df_pvuv2['uv'].to_list())
    .set_global_opts(
        title_opts=opts.TitleOpts(title='PVUV数据对比'),
        tooltip_opts=opts.TooltipOpts(trigger='axis',axis_pointer_type='cross')
    )
)
line3=(
    Line()
    .add_xaxis(df_pvuv3.index.to_list())
    .add_yaxis('PV',df_pvuv3['pv'].to_list())
    .add_yaxis('UV',df_pvuv3['uv'].to_list())
    .set_global_opts(
        title_opts=opts.TitleOpts(title='PVUV数据对比'),
        tooltip_opts=opts.TooltipOpts(trigger='axis',axis_pointer_type='cross')
    )
)

line1.render('./crazyant/pvuv1.html')
line2.render('./crazyant/pvuv2.html')
line3.render('./crazyant/pvuv3.html')