系列文章
- Grafana 系列文章
Explore Jaeger
你可以通过Explore查询和显示 Jaeger 的 trace。有 3 种方法:
- Query by search
- Query by trace ID
- Upload a JSON trace file
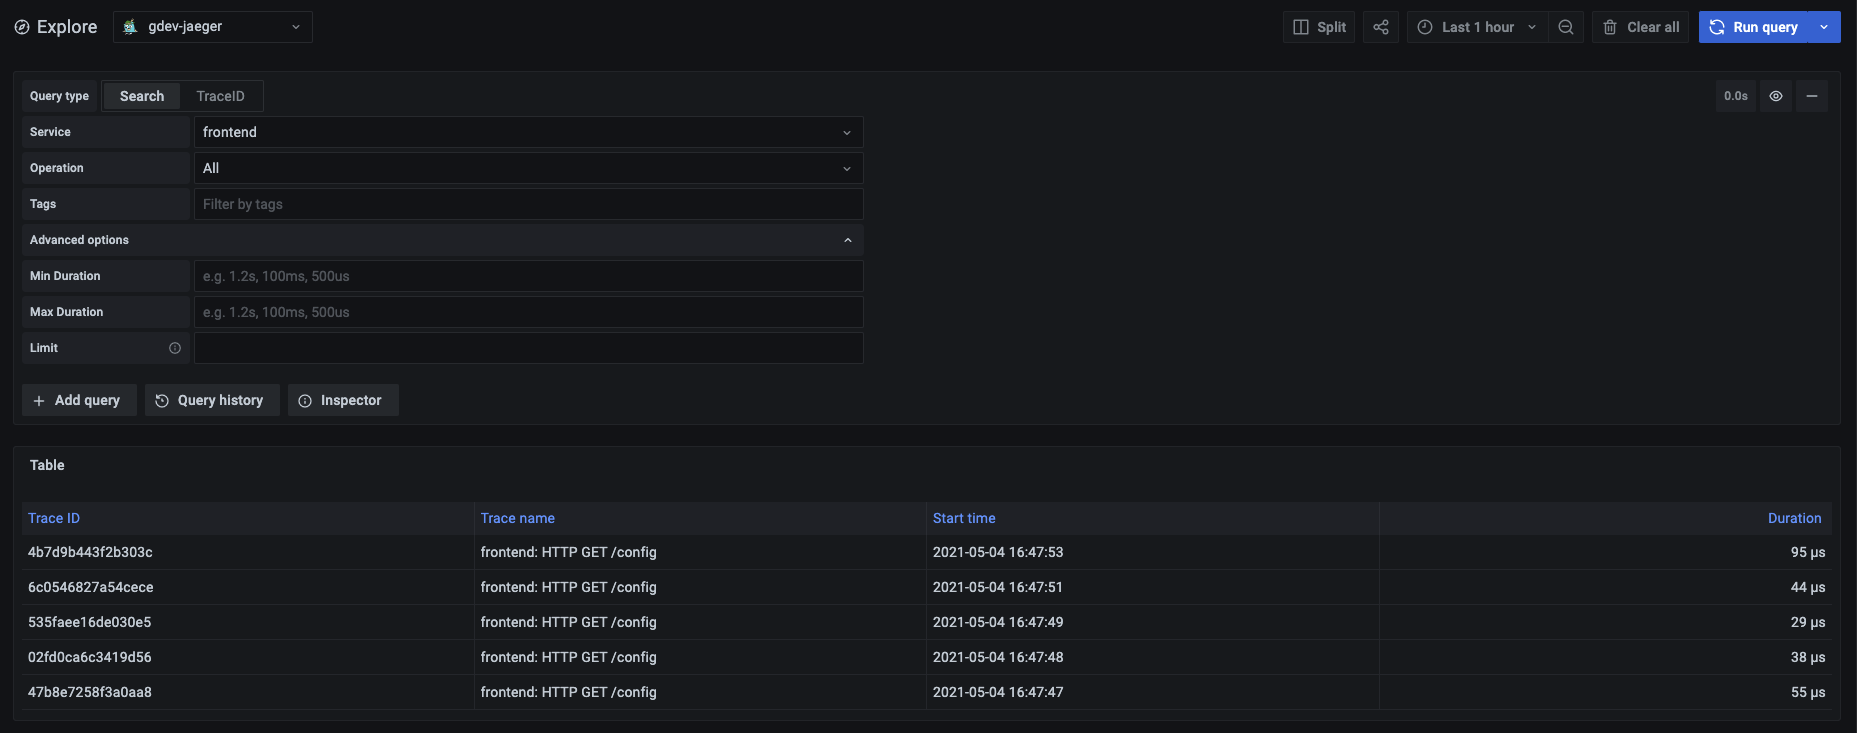
Query by search
要使用该方法:
- 从 Query 类型选择器中选择 Search。
- 填写搜索表格:(和 Jaeger UI 基本一样)
| Name | Description |
|---|---|
| Service | 返回 services 列表 |
| Operation | 当你选择一个有相关操作的 service 时,会弹出。选择 all 以查询所有操作。 |
| Tags | 设置具有logfmt格式值的标签,例如error=true db.statement="select * from User"。 |
| Min Duration | 过滤所有持续时间高于设定值的 traces。可能的值是1.2s, 100ms, 500us。 |
| Max Duration | 过滤所有持续时间低于设定值的 traces。可能的值是1.2s, 100ms, 500us。 |
| Limit | 限制返回的 traces 的数量。 |
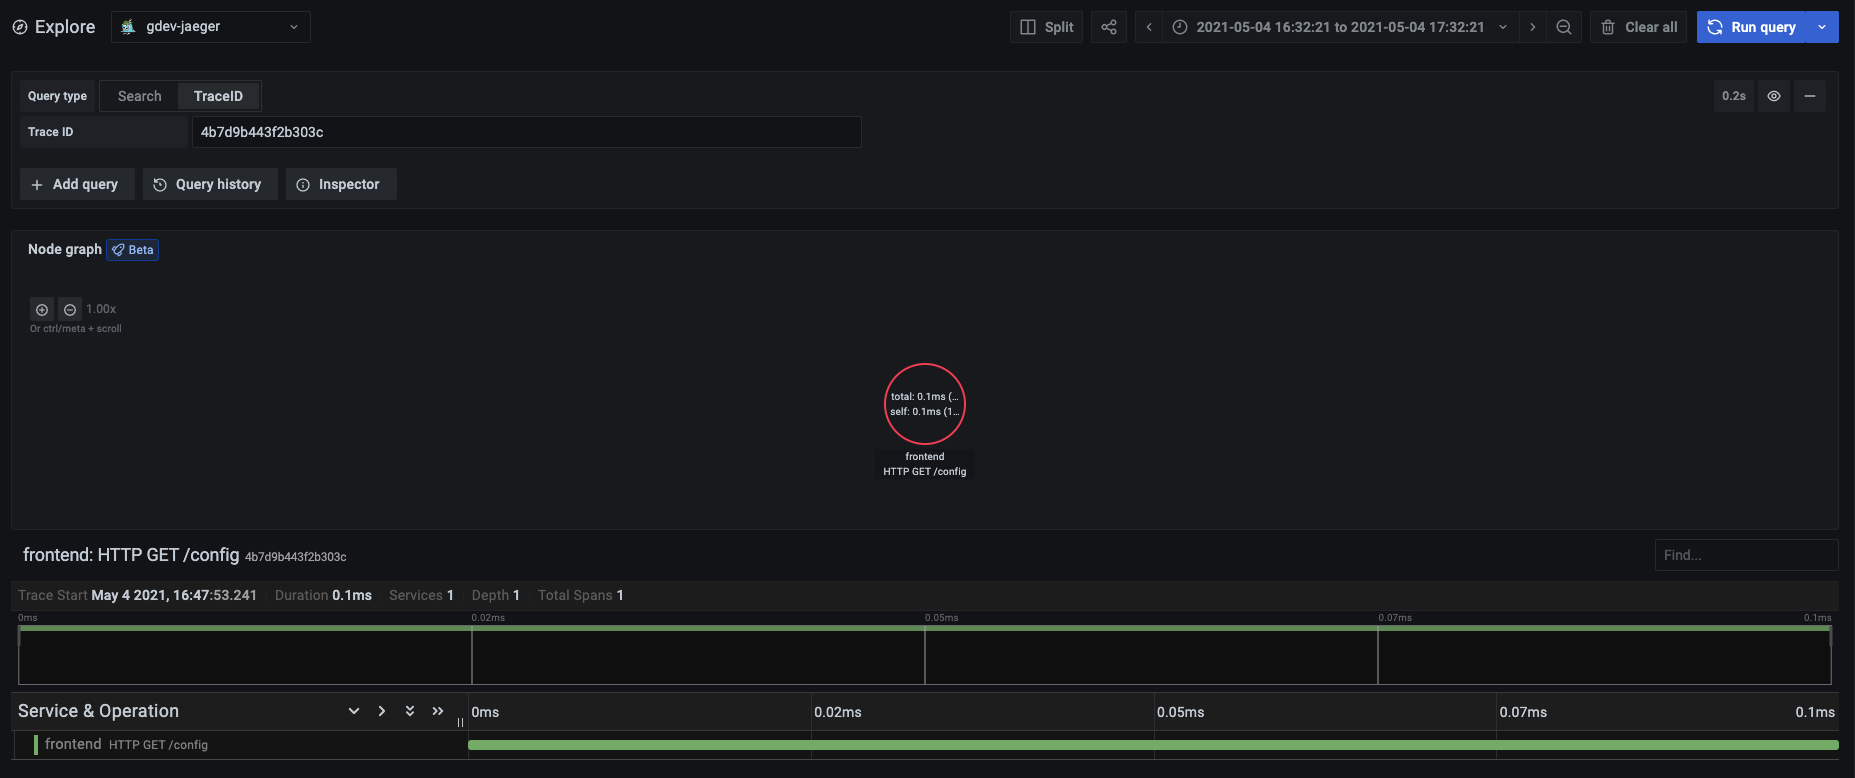
Query by trace ID
要查询一个特定的 trace:
- 选择 TraceID 查询类型。
- 在 Trace ID 字段中输入该 trace 的ID。
Upload a JSON trace file
JSON trace file 示例:
{
  "data": [
    {
      "traceID": "2ee9739529395e31",
      "spans": [
        {
          "traceID": "2ee9739529395e31",
          "spanID": "2ee9739529395e31",
          "flags": 1,
          "operationName": "CAS",
          "references": [],
          "startTime": 1616095319593196,
          "duration": 1004,
          "tags": [
            {
              "key": "sampler.type",
              "type": "string",
              "value": "const"
            }
          ],
          "logs": [],
          "processID": "p1",
          "warnings": null
        }
      ],
      "processes": {
        "p1": {
          "serviceName": "loki-all",
          "tags": [
            {
              "key": "jaeger.version",
              "type": "string",
              "value": "Go-2.25.0"
            }
          ]
        }
      },
      "warnings": null
    }
  ],
  "total": 0,
  "limit": 0,
  "offset": 0,
  "errors": null
}
是否有 Jaeger 的 Dashboard?
目前(2023/5/8)在 Grafana Dashboards registry, 还没有 Trace 相关的 Dashboard, Grafana Tempo 没有, Jaeger 也没有.
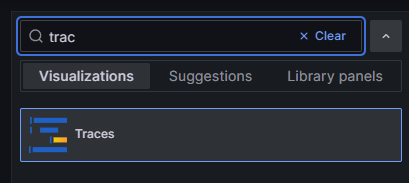
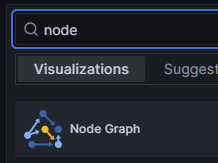
但是我关注到有一部分 panel 是适合用作 Trace Dashboard 展示的, 如:
- Traces
- Node Graph
应该在不远的将来就会有 Trace 相关的 Dashboards. 期待~
三人行, 必有我师; 知识共享, 天下为公. 本文由东风微鸣技术博客 EWhisper.cn 编写.