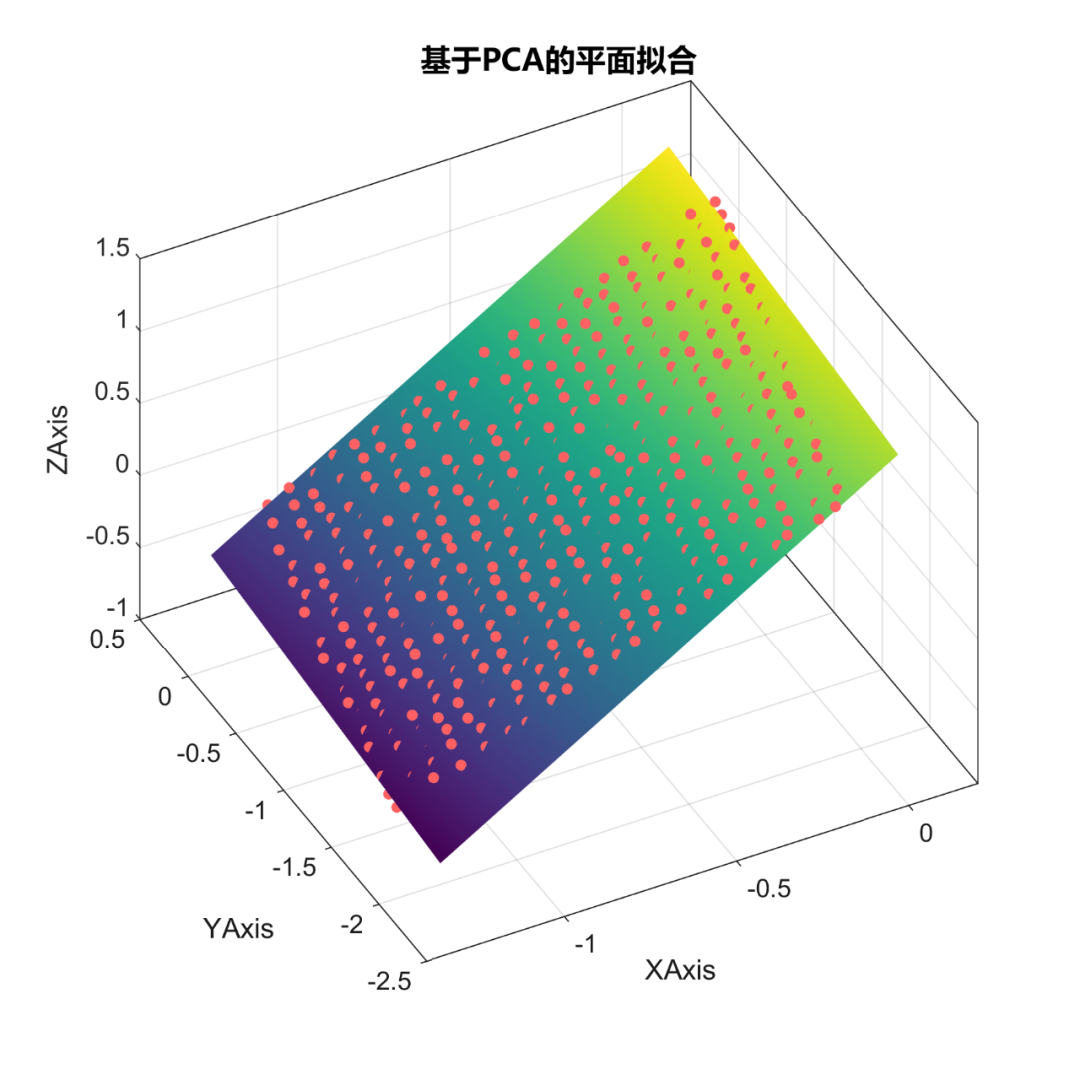
在之前的文章中,分享了Matlab基于PCA的平面拟合方法:
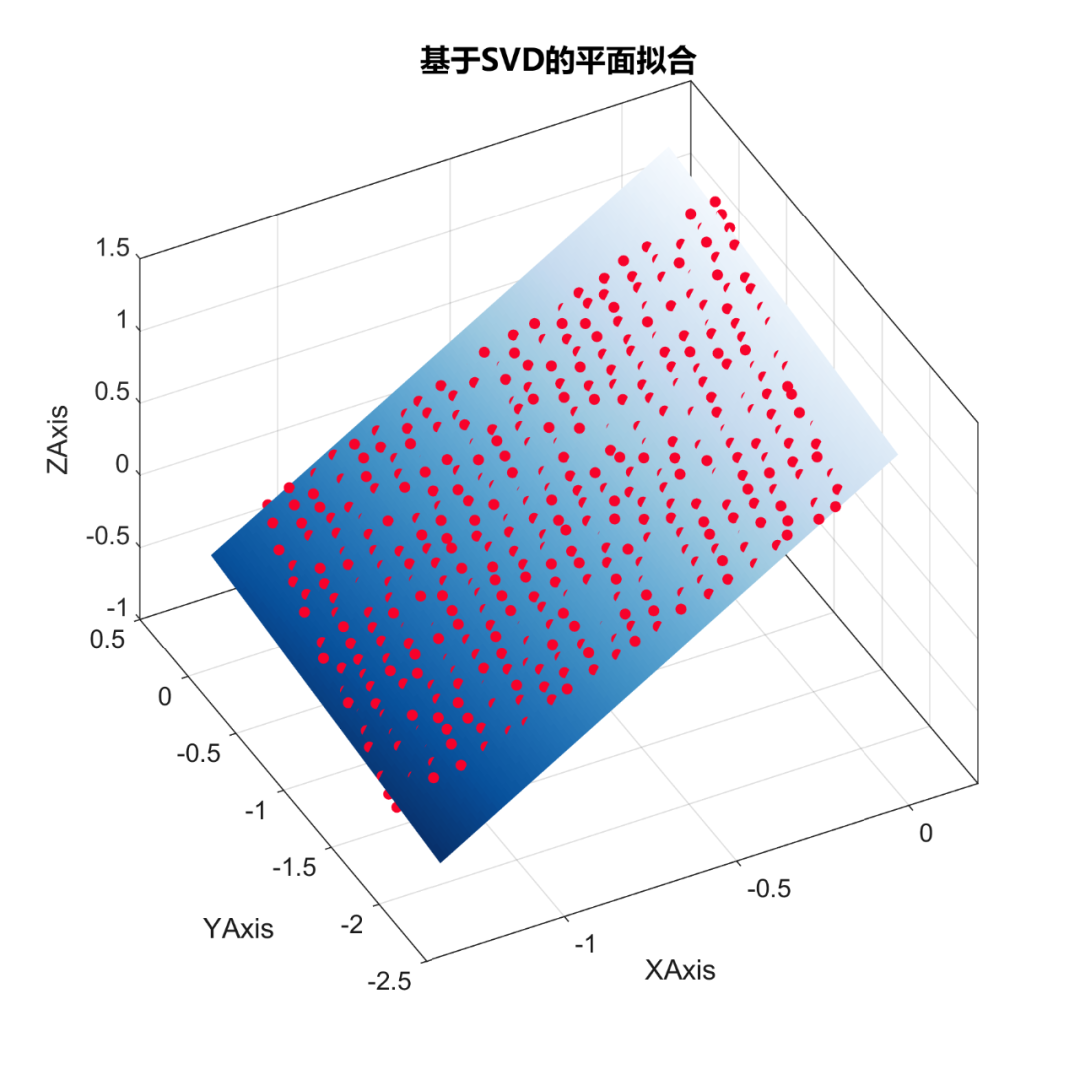
这一次,再来分享一下基于奇异值分解(Singular Value Decomposition, SVD)的平面拟合。
先来看一下成品效果:
特别提示:《Matlab点云处理及可视化》系列文章整理自作者博士期间的部分成果,旨在为初入点云处理领域的朋友提供一份较为权威、可直接用于论文写作的Matlab点云数据处理教程。如果觉得有用可以分享给更多的人。
1 概述
奇异值分解是线性代数中一种重要的矩阵分解,是特征分解在任意矩阵上的推广。
基于奇异值分解的平面拟合方法通过对去质心后的待拟合点坐标矩阵进行奇异值分解,将最小奇异值对应的特征向量作为拟合平面法向量,进而得到平面参数。
2 代码实现
function planes = fitPlane_SVD(data)% 功能:利用SVD拟合平面% 输入:data - 原始数据(m*3)% 输出:planes - 拟合所得平面参数points = data(:,1:3);% 去质心M = points - repmat(mean(points),size(points,1),1);% 奇异值分解[~,~,V] = svd(M,0);% 最小特征值对应的特征向量为法向量normal = V(:,3)';% 平面参数标准化dtmp = mean(points*normal');planes(1:3) = normal'*sign(dtmp);planes(4) = -dtmp*sign(dtmp);end
3 可视化验证
为了检测平面拟合的效果,采用仿真数据进行验证:
%% 数据准备% 读取数据data = load('data.txt');%% SVD平面拟合% 平面:Ax+By+Cz+D=0planes = fitPlane_SVD(data);A = planes(1);B = planes(2);C = planes(3);D = planes(4);%% 可视化验证% 窗口尺寸设置(单位:厘米)figureUnits = 'centimeters';figureWidth = 15;figureHeight = 15;figureHandle = figure;set(gcf, 'Units', figureUnits, 'Position', [0 0 figureWidth figureHeight]);% 原始点云可视化l = scatter3(data(:,1),data(:,2),data(:,3),15);% 原始点云hold on% 拟合平面绘制xfit = min(data(:,1)):0.01:max(data(:,1));yfit = min(data(:,2)):0.01:max(data(:,2));[XFit,YFit]= meshgrid (xfit,yfit);ZFit = -(D + A * XFit + B * YFit)/C;s = surf(XFit,YFit,ZFit,'EdgeColor','none');hTitle = title('基于SVD的平面拟合');hXLabel = xlabel('XAxis');hYLabel = ylabel('YAxis');hZLabel = zlabel('ZAxis');% 细节优化colormap(map)set(l,'Marker','o','MarkerFaceColor',CR,'MarkerEdgeColor',CR)view(-27.5,46.9);% 视角set(gca, 'Box', 'on', ... % 边框'XGrid','on','YGrid','on','ZGrid','on', ... % 网格'TickDir', 'out', 'TickLength', [0.01 0.01], ... % 刻度'XMinorTick', 'off', 'YMinorTick', 'off', ... % 小刻度'XColor', [.1 .1 .1], 'YColor', [.1 .1 .1],... % 坐标轴颜色'XLim',[-1.4 0.2])% 字体和字号set(gca, 'FontName', 'Arial', 'FontSize', 10)set([hXLabel, hYLabel, hZLabel], 'FontName', 'Arial','FontSize', 11)set(hTitle, 'FontName', '微软雅黑', 'FontSize', 12, 'FontWeight' , 'bold')% 背景颜色set(gcf,'Color',[1 1 1])% 图片输出print('test0.png','-r300','-dpng')
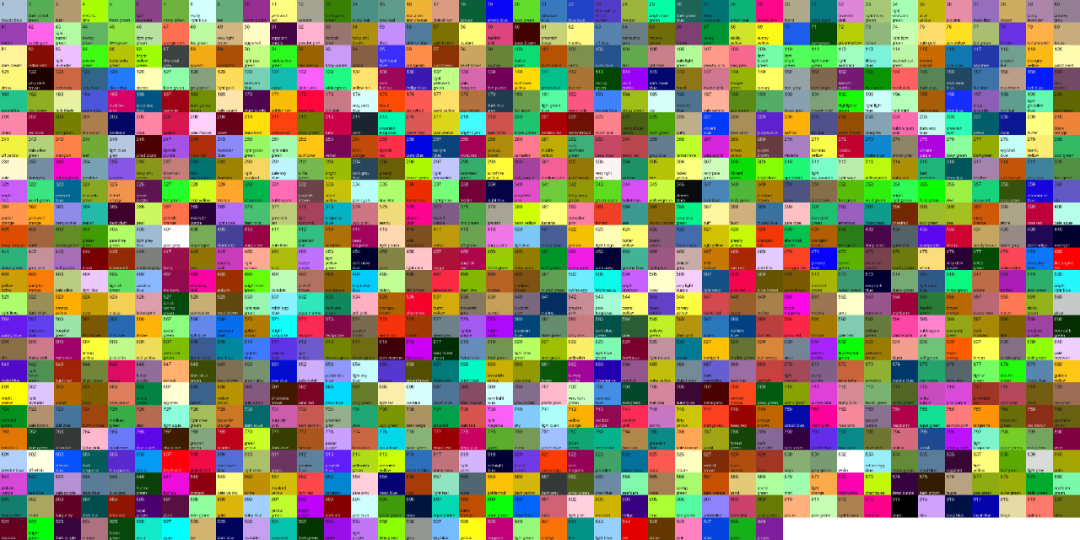
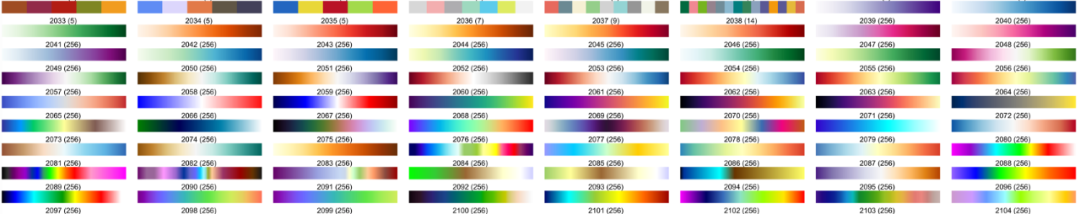
其中,为了区分不同对象,从Matlab配色神器TheColor的XKCD和SCI颜色库中选择对比色及渐变色:
% 颜色定义CR = TheColor('xkcd',536);map = TheColor('sci',2040);
最终结果如下:
以上。
获取方式:
Matlab基于SCD的平面拟合


![[附源码]Python计算机毕业设计Django的中点游戏分享网站](https://img-blog.csdnimg.cn/36a3bc58350c46de92774c4cd3487ee0.png)
