Prometheus Exporter开发
Exporter数据格式介绍
Exporter徒手开发
Exporter4种指标类型演示
Exporter自定义注册表
Exporter 基于Collector的模块开发
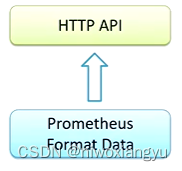
Exporter介绍

数据格式
通讯协议
HTTP协议服务端实现了gzip
数据格式
text/plain:文本协议
数据格式
prometheus是拉取数据的监控模型它对客户端暴露的数据格式要求如下

Exporter徒手开发
package main

import (
	"fmt"
	"net/http"
)

func HelloHandler(w http.ResponseWriter, r *http.Request) {
	fmt.Fprintf(w, "lexporter_request_count{user=\"admin\"} 1000")
}

func main() {
	http.HandleFunc("/metrics", HelloHandler)
	http.ListenAndServe(":8050", nil)
}
SDK 软件开发套件(Software development kit)
Prometheus 提供了专门的Handler
package main

import (
	"net/http"

	"github.com/prometheus/client_golang/prometheus/promhttp"
)

func main() {
	// Serve the default Prometheus metrics registry over HTTP on /metrics
	http.Handle("/metrics", promhttp.Handler())
	http.ListenAndServe(":8050", nil)
}

指标类型
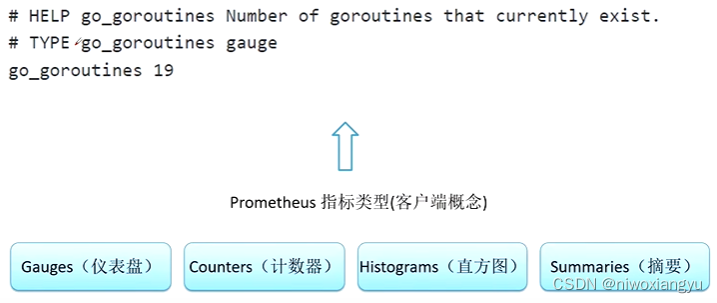
Exporter 4种指标类型演示
Gauges
是最常见的Metric类型,也就是我们说的实时指标,值是什么就返回什么,并不会进行加工处理
SDK提供了该指标的构造函数: NewGauge
	queueLength := prometheus.NewGauge(prometheus.GaugeOpts{
		// Namespace,Subsystem,Name 会拼接成指标的名称: wu123_mcube_demo_queue _length
        // 其中Name是必填参数
		Namespace: "wu123",
		Subsystem: "mcube_demo",
		Name:      "queue_length",
		// 指标的描述信息
		Help: "The number of items in the queue.",
		// 指标的标签
		ConstLabels: map[string]string{
			"module": "http-server",
		},
	})
Set: 设置指定的值
Inc: +1.
Dec:-1
Add: +n
Sub:-n
# HELP wu123_mcube_demo_queue_length The number of items in the queue.
# TYPE wu123_mcube_demo_queue_length gauge
wu123_mcube_demo_queue_length{module="http-server"} 100

// 测试用例
func TestGauge(t *test.T) {
	queueLength := prometheus.NewGauge(prometheus.GaugeOpts{
		// Namespace,Subsystem,Name 会拼接成指标的名称: magedu _mcube_demo_queue _length// 其中Name是必填参数
		Namespace: "magedu",
		Subsystem: "mcube_demo",
		Name:      "queue_length",
		// 指标的描述信息
		Help: "The number of items in the queue.",
		// 指标的标签
		ConstLabels: map[string]string{
			"module": "http-server",
		},
	})

	queueLength.Set(100)
...
}
Counter
Counters是计算器指标 用于统计次数使用通过 prometheus.NewCounter0 函数来初始化指标对象
	totalRequests := prometheus.NewCounter(prometheus.CounterOpts{
		Name: "http_requests_total",
		Help: "The total number of handled HTTP requests.",
	})
lnc: +1:计数器增加1
Add: +n:计数器增加23.
# HELP http_requests_total The total number of handled HTTP requests.
# TYPE http_requests_total counter
http_requests_total 10
![]()
func TestCounter(t *testing.T) {
	totalRequests := prometheus.NewCounter(prometheus.CounterOpts{
		Name: "http_requests_total",
		Help: "The total number of handled HTTP requests.",
	})

	for i := 0; i < 10; i++ {
		totalRequests .Inc()
	}
...
}
Histogram概念
Histograms 被叫主直方图或者柱状图,主要用于统计指标值的一个分布情况
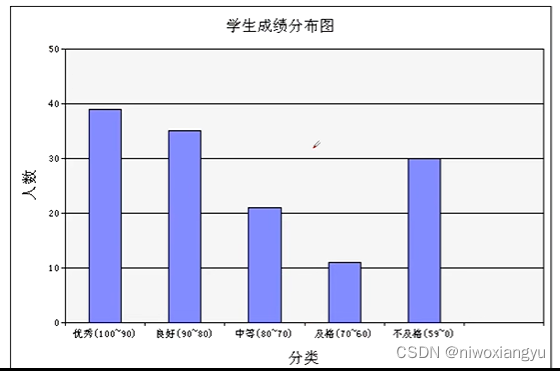
Bucket: 设置横轴区间只设置上限 不设下限
0~100
0~90
0~80
0~70
0~60
在监控里面,Histograms 典型的应用场景 就是统计 请求耗时分布,比如
0~100ms 请求个数
0~500ms 请求个数
0~5000ms 请求个数
为什么不用平均值来进行统计? 不合适
Histograms用法
我们使用NewHistogram初始化一个直方图类型的指标:
	requestDurations := prometheus.NewHistogram(prometheus.HistogramOpts{
		Name: "http reguest duration seconds",
		Help: "A histogram of the HTTP request durations in seconds.",
		// Bucket 配置:第一个 bucket 包括所有在 0.05s 内完成的请求,最后一个包括所有在10s内完成的请求。
		Buckets: []float64{0.05, 0.1, 0.25, 0.5, 1, 2.5, 5, 10},
	})
observe: 加入样板进行统计
Histograms演示
le="+Inf",表示小于正无穷,也就是统计所有的含义
后缀_sum,参加统计的值的求和
后缀_count 参加统计的值得总数
# HELP http_request_duration seconds A histogram of the HTTP request durations in seconds.
# TYPE http_request_duration seconds histogram
http_request_duration_seconds_bucket{le="0.05"} 2
http_request_duration_seconds_bucket{le="0.1"} 2
http_request_duration_seconds_bucket{le="0.25"} 2
http_request_duration_seconds_bucket{le="0.5"} 4
http_request_duration_seconds_bucket{le="1"} 6
http_request_duration_seconds_bucket{le="2.5"} 6
http_request_duration_seconds_bucket{le="5"} 6
http_request_duration_seconds_bucket{le="10"} 7
http_request_duration_seconds_bucket{le="+Inf"} 8
http_request_duration_seconds_sum 18.53
http_request_duration_seconds_count 8
func TestHistogram(t *testing.T) {
	requestDurations := prometheus.NewHistogram(prometheus.HistogramOpts{
		Name: "http_request_duration _seconds",
		Help: "A histogram of the HTTP request durations in seconds.",
		// Bucket 配置:第一个 bucket 包括所有在 0.05 内完成的请求,最后一个包括所有在10s内完成的请求
		Buckets: []float64(0.05, 0.1, 0.25, 0.5, 1, 2.5, 5, 10),
	})
	//添加值
	for _, v := range []float64(0.01, 0.02, 0.3, 0.4, 0.6, 0.7, 5.5, 11){
		requestDurations.Observe(v)
...
}
Histograms与分位数

Summaries
Observe,用于统计数据
用NewSummary来构建该类指标
这种类型的指标 就是用于计算分位数(quantile)的,因此他需要配置一个核心参:你需要统计那个(百)分位的数据
	requestDurations := prometheus.NewSummary(prometheus.SummaryOpts{
		Name : "http_request_duration_seconds",
		Help: "A summary of the HTTP request durations in seconds .",
		Objectives: map[float64]float64{
			0.5: 0.05, // 第50个百分位数,最大绝对误差为0.05。
			0.9: 0.01, // 第90个百分位数,最大绝对误差为0.01。
			0.99: 0.001, // 第99个百分位数,最大绝对误差为0.001。
		},
	}