Echarts 常用各类图表模板配置
注意: 这里主要就是基于各类图表,更多的使用 Echarts 的各类配置项;
以下代码都可以复制到 Echarts 官网,直接预览;
图标模板目录
- Echarts 常用各类图表模板配置
- 一、简洁折线图
- 二、环形图
- 三、k 线图
- 四、折线图
- 五、横向柱状图
- 六、折线图 + 柱状图
- 七、3D 柱状图
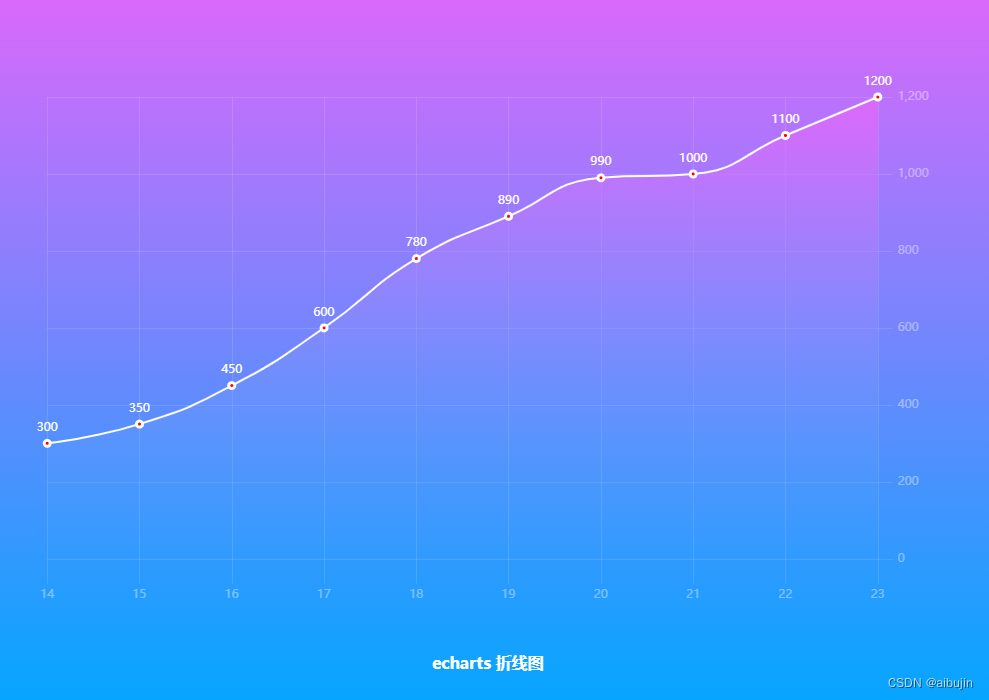
一、简洁折线图
option = {
  backgroundColor: new echarts.graphic.LinearGradient(
    0,
    0,
    0,
    1,
    [
      {
        offset: 0,
        color: '#eb64fb'
      },
      {
        offset: 1,
        color: '#00a7ff'
      }
    ],
    false
  ),
  title: {
    text: 'echarts 折线图',
    left: 'center',
    bottom: '5%',
    textStyle: {
      color: '#fff',
      fontSize: 16
    }
  },
  tooltip: {
    trigger: 'axis'
  },
  grid: {
    top: '20%',
    left: '10%',
    right: '10%',
    bottom: '15%',
    containLabel: true
  },
  xAxis: {
    type: 'category',
    boundaryGap: false,
    data: ['14', '15', '16', '17', '18', '19', '20', '21', '22', '23'],
    axisLabel: {
      margin: 30,
      color: '#ffffff63'
    },
    axisLine: {
      show: false
    },
    axisTick: {
      show: true,
      length: 25,
      lineStyle: {
        color: '#ffffff1f'
      }
    },
    splitLine: {
      show: true,
      lineStyle: {
        color: '#ffffff1f'
      }
    }
  },
  yAxis: [
    {
      type: 'value',
      position: 'right',
      axisLabel: {
        margin: 20,
        color: '#ffffff63'
      },

      axisTick: {
        show: true,
        length: 15,
        lineStyle: {
          color: '#ffffff1f'
        }
      },
      splitLine: {
        show: true,
        lineStyle: {
          color: '#ffffff1f'
        }
      },
      axisLine: {
        lineStyle: {
          color: '#fff',
          width: 2
        }
      }
    }
  ],
  series: [
    {
      name: 'echarts',
      type: 'line',
      smooth: true, //是否平滑曲线显示
      showAllSymbol: true,
      symbol: 'circle',
      symbolSize: 6,
      lineStyle: {
        normal: {
          color: '#fff' // 线条颜色
        }
      },
      label: {
        show: true,
        position: 'top',
        textStyle: {
          color: '#fff'
        }
      },
      itemStyle: {
        color: 'red',
        borderColor: '#fff',
        borderWidth: 3
      },
      tooltip: {
        show: true
      },
      areaStyle: {
        normal: {
          color: new echarts.graphic.LinearGradient(
            0,
            0,
            0,
            1,
            [
              {
                offset: 0,
                color: '#eb64fb'
              },
              {
                offset: 1,
                color: '#3fbbff0d'
              }
            ],
            false
          )
        }
      },
      data: [300, 350, 450, 600, 780, 890, 990, 1000, 1100, 1200]
    }
  ]
};
二、环形图
echarts 环形图:多层嵌套,自定义 legend 位置、颜色,中间插入数据及文字,颜色渐变;
文字链接: https://blog.csdn.net/aibujin/article/details/124796709?spm=1001.2014.3001.5501
三、k 线图
文章链接: https://blog.csdn.net/aibujin/article/details/124797924?spm=1001.2014.3001.5501
四、折线图
echarts 折线图,横纵坐标轴线颜色、文字颜色,网格线,坐标轴两侧留白,数据渐变,刻度线等;
文章链接: https://blog.csdn.net/aibujin/article/details/124802512?spm=1001.2014.3001.5501
五、横向柱状图
echarts 横向柱状图,坐标轴隐藏,网格线颜色渐变,网格默认背景,柱状图边框宽度/颜色,数据渐变,刻度线隐藏等;
文章链接: https://blog.csdn.net/aibujin/article/details/124802889?spm=1001.2014.3001.5501
六、折线图 + 柱状图
echarts 折线图 + 柱状图,左右两侧y轴线,横纵坐标轴线颜色、文字颜色,网格线,坐标轴两侧留白,数据渐变,刻度线等;
文章链接: https://blog.csdn.net/aibujin/article/details/124803493?spm=1001.2014.3001.5501
七、3D 柱状图
echarts 3D 柱状图,多个柱状图叠加,y轴内刻度线、隐藏横坐标,文字颜色,网格线,坐标轴两侧留白,数据渐变,刻度线等;
文章链接: https://blog.csdn.net/aibujin/article/details/124879825?spm=1001.2014.3001.5501