echarts实现3d柱状图的两种方式
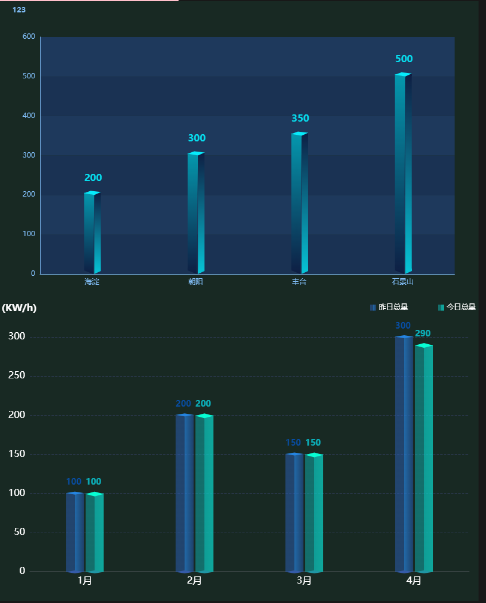
看了不少关于3d柱状图的案例,发现做3d柱状图 常用的两种方式就是 自定义图形和象型柱图, 两种实现方式效果如下:
方法1: echarts.graphic.extendShape 自定义图形
echarts自定义图形的详细用法点这里, 官网点这里, 图中第一个3d柱状图我参考的案例在这里, 看了很多 echarts这种3d案例, 自定义图形做3d柱状图,貌似只能有个柱子(可能 能做双柱,但是 我真的不会)
封装成组件的完整代码如下:
<template></template>
<script setup lang="ts">
import { nextTick, watch } from 'vue';
import echarts from '@/assets/ts/echarts';
import useResizeChart from '@/hooks/useResizeChart';
function mergeConfig(defaultConfig: object, config: object) {
return Object.assign(defaultConfig, config);
}
function initOption(): echarts.EChartsCoreOption {
// 绘制左侧面
const CubeLeft = echarts.graphic.extendShape({
shape: {
x: 0,
y: 0,
},
buildPath: function (ctx, shape) {
// 会canvas的应该都能看得懂,shape是从custom传入的
const xAxisPoint = shape.xAxisPoint;
const c0 = [shape.x + 3.5, shape.y];
const c1 = [shape.x - 11.5, shape.y - 3];
const c2 = [xAxisPoint[0] - 11.5, xAxisPoint[1] - 6.5];
const c3 = [xAxisPoint[0] + 3.5, xAxisPoint[1]];
ctx.moveTo(c0[0], c0[1])
// @ts-ignore
.lineTo(c1[0], c1[1])
.lineTo(c2[0], c2[1])
.lineTo(c3[0], c3[1])
.closePath();
},
});
// 绘制右侧面
const CubeRight = echarts.graphic.extendShape({
shape: {
x: 0,
y: 0,
},
buildPath: function (ctx, shape) {
const xAxisPoint = shape.xAxisPoint;
const c1 = [shape.x + 3, shape.y];
const c2 = [xAxisPoint[0] + 3, xAxisPoint[1]];
const c3 = [xAxisPoint[0] + 12, xAxisPoint[1] - 7];
const c4 = [shape.x + 12, shape.y - 7];
ctx.moveTo(c1[0], c1[1])
// @ts-ignore
.lineTo(c2[0], c2[1])
.lineTo(c3[0], c3[1])
.lineTo(c4[0], c4[1])
.closePath();
},
});
// 绘制顶面
const CubeTop = echarts.graphic.extendShape({
shape: {
x: 0,
y: 0,
},
buildPath: function (ctx, shape) {
const c1 = [shape.x + 3.5, shape.y];
const c2 = [shape.x + 12.5, shape.y - 7.5]; //右点
const c3 = [shape.x - 2.5, shape.y - 10];
const c4 = [shape.x - 11.5, shape.y - 3];
ctx.moveTo(c1[0], c1[1])
// @ts-ignore
.lineTo(c2[0], c2[1])
.lineTo(c3[0], c3[1])
.lineTo(c4[0], c4[1])
.closePath();
},
});
// 注册三个面图形
echarts.graphic.registerShape('CubeLeft', CubeLeft);
echarts.graphic.registerShape('CubeRight', CubeRight);
echarts.graphic.registerShape('CubeTop', CubeTop);
const VALUE = props.value;
const series = [
{
type: 'custom',
renderItem: (params: any, api: any) => {
let cubeLeftStyle = new echarts.graphic.LinearGradient(0, 0, 0, 1, [
{
offset: 0,
// @ts-ignore
color: props.color[0],
},
{
offset: 1,
color: 'rgba(7, 20, 52,0.7)',
},
]);
let cubeRightStyle = new echarts.graphic.LinearGradient(0, 0, 0, 1, [
{
offset: 0,
color: 'rgba(7, 20, 52,1)',
},
{
offset: 1,
// @ts-ignore
color: props.color[0],
},
]);
let cubeTopStyle = new echarts.graphic.LinearGradient(0, 0, 0, 1, [
{
offset: 0,
// @ts-ignore
color: props.color[1] || props.color[0],
},
]);
const location = api.coord([api.value(0), api.value(1)]);
return {
type: 'group',
children: [
{
type: 'CubeLeft',
shape: {
api,
xValue: api.value(0),
yValue: api.value(1),
x: location[0],
y: location[1],
xAxisPoint: api.coord([api.value(0), 0]),
},
style: {
fill: cubeLeftStyle,
},
},
{
type: 'CubeRight',
shape: {
api,
xValue: api.value(0),
yValue: api.value(1),
x: location[0],
y: location[1],
xAxisPoint: api.coord([api.value(0), 0]),
},
style: {
fill: cubeRightStyle,
},
},
{
type: 'CubeTop',
shape: {
api,
xValue: api.value(0),
yValue: api.value(1),
x: location[0],
y: location[1],
xAxisPoint: api.coord([api.value(0), 0]),
},
style: {
fill: cubeTopStyle,
},
},
],
};
},
data: VALUE,
},
{
type: 'bar',
label: {
show: true,
position: 'top',
fontSize: 14,
color: props.color[0],
offset: [2, -10],
},
itemStyle: {
color: 'transparent',
},
tooltip: {},
data: VALUE,
},
];
const title = mergeConfig(
{
text: '',
textStyle: {
color: props.color[0],
fontWeight: '800',
fontSize: 12,
},
left: '18px',
top: '1%',
},
props.title,
);
const XAxisLine = mergeConfig(
{
show: false,
lineStyle: {
type: 'solid',
width: 1,
color: '#2c3954',
},
},
props.XAxisLine,
);
const YAxisLine = mergeConfig(
{
show: false,
lineStyle: {
show: true,
lineStyle: {
type: 'solid',
width: 1,
},
},
},
props.YAxisLine,
);
const legend = mergeConfig(
{
show: true,
left: 'center',
top: '95%',
icon: 'circle',
textStyle: {
color: '#fff',
},
},
props.legend,
);
const grid = mergeConfig(
{
left: '5%',
right: '5%',
top: '12%',
bottom: '0%',
containLabel: true,
},
props.grid,
);
const XSplitLine = mergeConfig(
{
show: false,
lineStyle: {
type: 'dashed',
width: 1,
},
},
props.XSplitLine,
);
// 纵坐标分割线配置
const YSplitLine = mergeConfig(
{
// 是否显示
// show: false,
show: true,
// 样式
lineStyle: {
color: '#13263e',
type: 'solid',
width: 1,
},
},
props.YSplitLine,
);
const XAxisTick = mergeConfig(
{
show: false,
length: 5,
inside: true,
alignWithLabel: true,
lineStyle: {
type: 'solid',
width: 1,
},
},
props.XAxisTick,
);
const YAxisTick = mergeConfig(
{
show: true,
length: 5,
inside: true,
alignWithLabel: true,
lineStyle: {
color: '#13263e',
type: 'solid',
width: 1,
},
},
props.YAxisTick,
);
let option: echarts.EChartsCoreOption = {
title,
tooltip: {
show: false,
// 指示器提示的坐标轴
trigger: 'axis',
// 阴影提示器
axisPointer: {
type: 'shadow',
shadowStyle: {
shadowColor: '#2e3e51', // 设置阴影的颜色
},
},
formatter: function (params: any) {
const item = params[1];
return item.name + ' : ' + item.value;
},
// 提示框背景颜色
backgroundColor: '#122843',
// 提示框边框颜色
borderColor: '#42D1F1',
// 提示框文本样式
textStyle: {
color: '#fff',
},
},
legend: legend,
grid: grid,
xAxis: {
type: 'category',
// boundaryGap: false,
data: props.xAxisData,
axisLine: XAxisLine,
splitLine: XSplitLine,
axisTick: XAxisTick,
axisLabel: {
//x轴文字的配置
show: true,
color: '#fff',
fontSize: 12,
rotate: 30,
},
},
yAxis: {
type: 'value',
name: props.yUnit,
nameTextStyle: {
color: '#fff',
fontSize: 16,
},
axisLine: YAxisLine,
splitLine: YSplitLine,
axisTick: YAxisTick,
axisLabel: {
//y轴文字的配置
color: '#fff',
fontSize: 12,
},
},
series,
};
option = Object.assign(option, props.config);
return option;
}
const props = defineProps({
pid: {
type: String,
required: true,
},
title: {
type: Object,
default: {},
},
xAxisData: {
type: Array,
required: true,
},
legend: {
type: Object,
default: {},
},
grid: {
type: Object,
default: {},
},
XAxisLine: {
type: Object,
default: {},
},
YAxisLine: {
type: Object,
default: {},
},
yUnit: {
type: String,
default: '',
},
XSplitLine: {
type: Object,
default: {},
},
YSplitLine: {
type: Object,
default: {},
},
XAxisTick: {
type: Object,
default: {},
},
YAxisTick: {
type: Object,
default: {},
},
config: {
type: Object as () => echarts.EChartsCoreOption,
default: {},
},
value: {
type: Array,
required: true,
},
// 柱子的颜色
color: {
type: Array,
default: ['rgba(29, 230, 235,1)', 'rgba(7, 235, 251,1)'],
},
});
let option = initOption();
let container: HTMLElement | null = null;
let myChart: echarts.ECharts | null = null;
const renderChart = (notMerge: boolean = false) => {
if (!myChart) myChart = echarts.init(container as HTMLElement);
myChart.setOption(option, {
notMerge,
});
};
nextTick(() => {
container = document.querySelector('#' + props.pid) as HTMLElement;
renderChart();
useResizeChart(container, myChart as echarts.ECharts);
});
watch(
() => props,
(newVal, oldVal) => {
let notMerge = true;
option = initOption();
renderChart(notMerge);
},
{
deep: true,
},
);
function exportImg() {
const src = (myChart as echarts.ECharts).getDataURL({
pixelRatio: 2,
backgroundColor: '#08172A',
});
const a = document.createElement('a');
a.href = src;
a.download = (option.title as { text: string }).text || 'chart-img';
a.click();
}
defineExpose({
exportImg,
});
</script>
<style lang="scss" scoped></style>
方式2: 象型柱图(type: “pictorialBar”)
echarts象型柱图的官网配置项点这里, 参考的案例在这里, 象型柱图可以单柱可以双柱
封装成组件的完整代码如下:
<template></template>

<script setup lang="ts">
import { nextTick, watch } from "vue";
import echarts from "@/assets/ts/echarts";
import { LegendComponent } from "echarts/components";
echarts.use([LegendComponent]);
// 合并配置方法
function mergeConfig(defaultConfig: object, config: object) {
  return Object.assign(defaultConfig, config);
}

function initOption(): echarts.EChartsCoreOption {
  // 此时 使用组件只需要要将  zzx1的数据和 wgx1 的数据传递到子组件
  // 第一个柱子的值
  const zzx1 = props.series[0].data; // 实际值

  // 第二个柱子的值
  const wgx1 = props.series[1].data;


  // 变量: 改变每个柱子的大小, 后期可将其设置为动态的?
  const barWidth = 30;
  const series = [
    // (0)第一个柱子 中间的正方形
    {
      type: "pictorialBar", // 象型柱状
      symbol: "diamond",

      symbolSize: [barWidth, 5], // 调整大小
      // symbolOffset: [-13, -3], // 图形相对于原本位置的偏移
      symbolOffset: ["-55%", -3], // 图形相对于原本位置的偏移
      symbolPosition: "end",
      z: 12,
      color: "#2584e0",
      data: zzx1,
    },
    // (1)第二个柱子中间的正方形
    {
      type: "pictorialBar",
      symbol: "diamond",
      symbolSize: [barWidth, 8],
      // symbolOffset: [13, -3],
      symbolOffset: ["55%", -3],
      symbolPosition: "end",
      z: 12,
      color: "#07fdd3",
      data: wgx1,
    },
    //  (2)第一个柱子 底部的正方形
    {
      type: "pictorialBar",
      symbol: "diamond",
      symbolSize: [barWidth, 5],
      // symbolOffset: [-13, 3],
      symbolOffset: ["-55%", 3],
      z: 12,
      color: "#355ba8",
      data: zzx1,
    },
    // (3)第二个柱子 底部的正方形
    {
      name: "",
      type: "pictorialBar",
      symbol: "diamond",
      symbolSize: [barWidth, 5],
      // symbolOffset: [13, 3],
      symbolOffset: ["55%", 3],
      color: "#2095a3",
      z: 12,
      data: wgx1,
    },
    // (4)一个柱子, 下方有颜色填充的的柱子
    {
      name: props.nameOne,
      type: "bar",
      barWidth: barWidth,
      barGap: "10%",
      // zlevel: 2,
      stack: "1",
      itemStyle: {
        opacity: 0.7,
        color: new echarts.graphic.LinearGradient(0, 0, 1, 0, [
          {
            offset: 0.5,
            color: "rgba(44, 97, 188,0.7)",
            // color: '#2c61bc',
          },
          {
            offset: 0.5,
            color: "#2584e0",
          },
          {
            offset: 1,
            color: "#214a87",
          },
        ]),
        // barBorderRadius: 0,
        borderRadius: 0,
      },
      // 是否在每个柱子显示 相应的值
      label: {
        show: true,

        position: ["0", "-25"],
        color: "#005dd9",
        fontSize: 14,
        fontWeight:'bold'
      },
      data: zzx1,
    },
    // (5)第二个柱子, 下方有颜色填充的的柱子
    {
      name: props.nameTow,
      type: "bar",
      stack: "2",
      barWidth: barWidth,
      itemStyle: {
        opacity: 0.7,
        color: new echarts.graphic.LinearGradient(0, 0, 1, 0, [
          {
            offset: 0.5,
            color: "rgba(15, 182, 182,0.7)",
          },
          {
            offset: 0.5,
            color: "#0ccec7",
          },
          {
            offset: 1,
            color: "#0bddd0",
          },
        ]),
        // barBorderRadius: 0,
        borderRadius: 0,
      },
      // 是否在每个柱子显示 相应的值
      label: {
        show: true,
        position: ["0", "-25"],
        color: "#06e6f6",
        fontSize: 14,
        fontWeight:'bold'
      },
      data: wgx1,
    },
  ];

  // title 配置
  const title = mergeConfig(
    {
      // 是否显示
      show: true,
      // title 文本
      text: "",
      top: 0,
      left: "left",
      // 文字样式
      textStyle: {
        color: "#fff",
        fontSize: 16,
      },
    },
    props.title
  );

  // 横坐标轴线配置
  const XAxisLine = mergeConfig(
    {
      // 是否显示
      show: true,
      // show: false,
      // 样式
      lineStyle: {
        // color: "rgba(46, 60, 87)",
        type: "solid",
        width: 1,
      },
    },
    props.XAxisLine
  );

  // 纵坐标轴线配置
  const YAxisLine = mergeConfig(
    {
      // 是否显示
      // show: true,
      show: false,
      // 样式
      lineStyle: {
        // 是否显示
        show: true,
        // 样式
        lineStyle: {
          color: "#fff",
          type: "solid",
          width: 1,
        },
      },
    },
    props.YAxisLine
  );

  // 横坐标分割线配置
  const XSplitLine = mergeConfig(
    {
      // 是否显示
      show: false,
      // 样式
      lineStyle: {
        color: "#fff",
        type: "dotted",
        width: 1,
      },
    },
    props.XSplitLine
  );

  // 纵坐标分割线配置
  const YSplitLine = mergeConfig(
    {
      // 是否显示
      show: true,
      // 样式
      lineStyle: {
        color: "rgba(46, 59, 86)",
        type: 'dashed',
        // type: "solid",
        width: 1,
      },
    },
    props.YSplitLine
  );

  // 横坐标刻度配置
  const XAxisTick = mergeConfig(
    {
      // 是否显示
      show: false,
      // 刻度长度
      length: 5,
      // 是否朝内
      inside: true,
      // 刻度是否居中
      alignWithLabel: true,
      // 样式
      lineStyle: {
        color: "#fff",
        type: "solid",
        width: 1,
      },
    },
    props.XAxisTick
  );

  // 纵坐标刻度配置
  const YAxisTick = mergeConfig(
    {
      // 是否显示
      show: false,
      // 刻度长度
      length: 5,
      // 是否朝内
      inside: true,
      // 刻度是否居中
      alignWithLabel: true,
      color: "#fff",
      // 样式
      lineStyle: {
        color: "#fff",
        type: "solid",
        width: 1,
      },
    },
    props.YAxisTick
  );

  // 图例标记配置
  const legend = mergeConfig(
    {
      show: true,
      right: "0",
      top: "0",
      icon: "rect",
      itemHeight: 10,
      itemWidth: 10,
      textStyle: {
        color: "#fff",
      },
      // 取消默认点击事件
      selectedMode: false,
      // 距离
      itemGap: 50,
    },
    props.legend
  );

  // 指示器:
  const tooltip = {
    show: false,
    trigger: "axis",
    axisPointer: {
      type: "shadow",
    },
    formatter: function (e: any) {
      // console.log(e);
      var str =
        e[4].axisValue +
        "<br>" +
        "<span style='display:inline-block;margin-right:5px;border-radius:10px;width:10px;height:10px;background-color:" +
        e[4].color.colorStops[0].color +
        ";'></span>" +
        "" +
        e[4].seriesName +
        " : " +
        e[4].value +
        "<br>" +
        "<span style='display:inline-block;margin-right:5px;border-radius:10px;width:10px;height:10px;background-color:" +
        e[5].color.colorStops[0].color +
        ";'></span>" +
        "" +
        e[5].seriesName +
        " : " +
        e[5].value;
      return str;
    },
    // 提示框背景颜色
    backgroundColor: "#122843",
    // 提示框边框颜色
    borderColor: "#42D1F1",
    // 提示框文本样式
    textStyle: {
      color: "#fff",
    },
  };

  // 汇总配置
  let option: echarts.EChartsCoreOption = {
    title,
    tooltip,
    legend,
    grid: {
      top: "12%",
      left: "2%",
      right: "2%",
      bottom: "5%",
      // height: "85%",
      containLabel: true,
    },
    xAxis: {
      type: "category",
      boundaryGap: true,
      data: props.xAxisData,
      axisLine: XAxisLine,
      splitLine: XSplitLine,
      axisTick: XAxisTick,
      axisLabel: {
        // textStyle: {
        color: "#fff",
        fontSize:16
        // },
      },
    },
    yAxis: {
      type: "value",
      // 单位
      name: props.yUnit,
      axisLine: YAxisLine,
      splitLine: YSplitLine,
      axisTick: YAxisTick,
      axisLabel: {
        // textStyle: {
        color: "#fff",
        fontSize:16
        // },
      },

      min: 0,
      // max: props.max,
    },
    series,
  };
  // 合并配置生成最终配置
  option = Object.assign(option, props.config);
  return option;
}

// props
const props = defineProps({
  // 父容器ID
  pid: {
    type: String,
    required: true,
  },
  title: {
    type: Object,
    default: {},
  },
  // 数据
  series: {
    // type: Array as () => Array<BarSeriesOption>,
    type: Array as () => { data: number[] }[],
    required: true,
  },
  // 横坐标
  xAxisData: {
    type: Array,
    required: true,
  },
  // 图例标记
  legend: {
    type: Object,
    default: {},
  },
  // 横坐标轴线
  XAxisLine: {
    type: Object,
    default: {},
  },
  // 纵坐标轴线
  YAxisLine: {
    type: Object,
    default: {},
  },
  // y轴单位
  yUnit: {
    type: String,
    default: "",
  },
  // 横坐标分割线
  XSplitLine: {
    type: Object,
    default: {},
  },
  // 纵坐标分割线
  YSplitLine: {
    type: Object,
    default: {},
  },
  // 横坐标刻度
  XAxisTick: {
    type: Object,
    default: {},
  },
  // 纵坐标刻度
  YAxisTick: {
    type: Object,
    default: {},
  },
  // 总配置,将与默认配置与用户传入的配置合并
  config: {
    type: Object as () => echarts.EChartsCoreOption,
    default: {},
  },
  // 最值
  // max: {
  //     type: Number,
  //     // requird: true,
  //     default: 5000,
  // },
  nameOne: {
    type: String,
    default: "昨日总量",
  },
  nameTow: {
    type: String,
    default: "今日总量",
  },
});

// option
let option = initOption();

// chart 容器
let container: HTMLElement | null = null;
// chart 实例
let myChart: echarts.ECharts | null = null;

// 渲染方法
const renderChart = () => {
  if (!myChart) myChart = echarts.init(container as HTMLElement);
  myChart.setOption(option);
};

// DOM加载后渲染 chart
nextTick(() => {
  // 获取容器
  container = document.querySelector("#" + props.pid) as HTMLElement;
  // 渲染 chart
  renderChart();
  // 自适应 chart
  // useResizeChart(container, myChart as echarts.ECharts);
});

// 监听 props 变化
watch(
  () => props,
  () => {
    // 更新 option
    option = initOption();
    // 重新渲染chart
    renderChart();
  },
  {
    deep: true,
  }
);

// 导出为图片
function exportImg() {
  // 生成 base64 图片
  const src = (myChart as echarts.ECharts).getDataURL({
    pixelRatio: 2,
    backgroundColor: "#08172A",
  });
  // 下载
  const a = document.createElement("a");
  a.href = src;
  a.download = (option.title as { text: string }).text || "chart-img";
  a.click();
}

// 暴露出 chart 图片导出方法,父组件可以通过实例调用
defineExpose({
  exportImg,
});
</script>

<style lang="scss" scoped></style>


![Java Web 项目入门指南(http、Servlet、Request、Response、ServletContext、会话技术[cookie、session]、Filter、Listener)](https://img-blog.csdnimg.cn/9d27cbe217114a8897de53bbacb21993.png#pic_center)