文章目录
- 前言
- 一、zabbix主机发现
- 1.手动添加
- 2.自动发现
- 3.自动注册
- 二、zabbix api
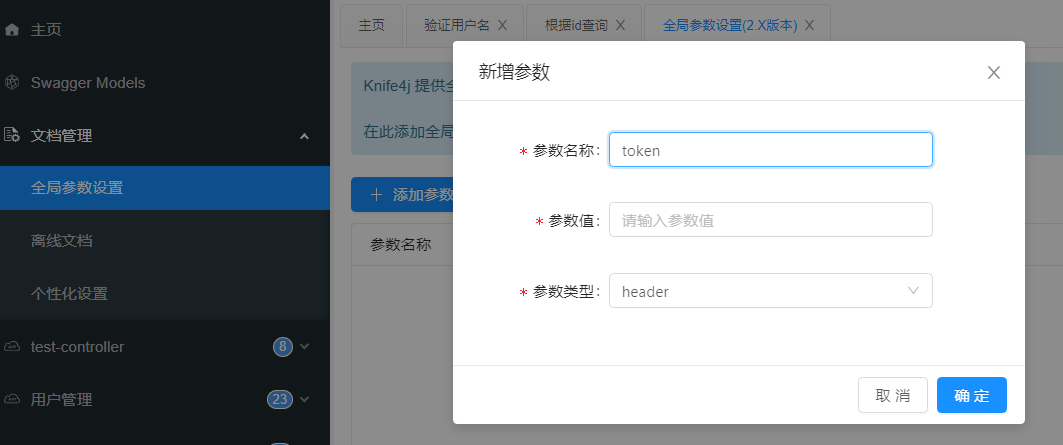
- 1.获取token
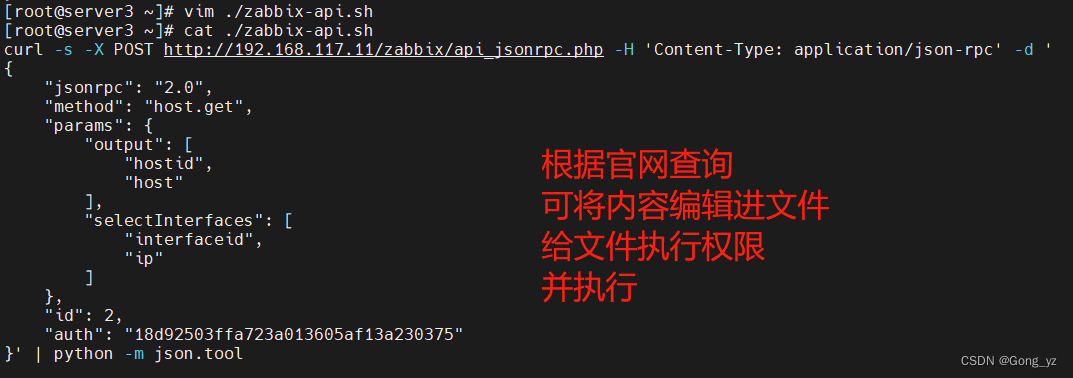
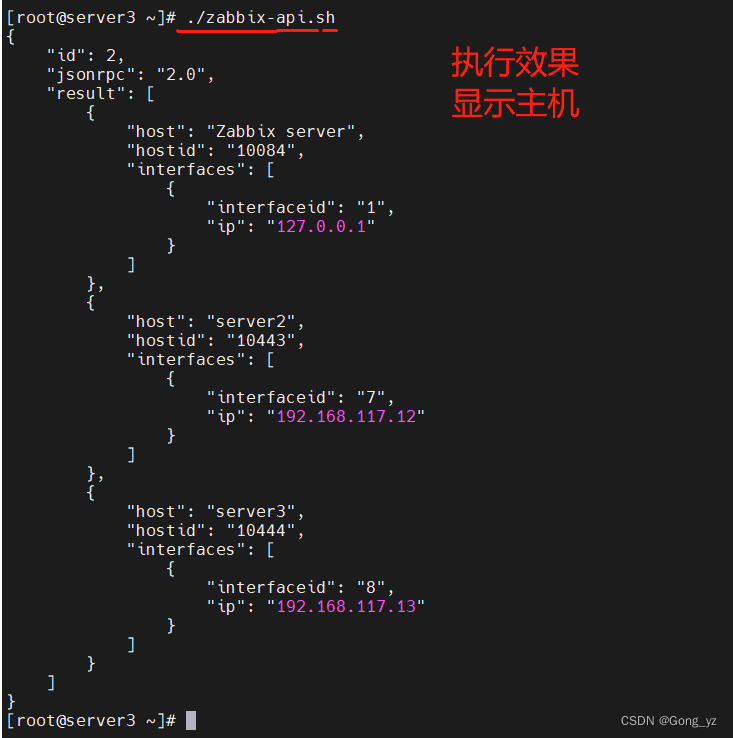
- 2.使用api检索主机
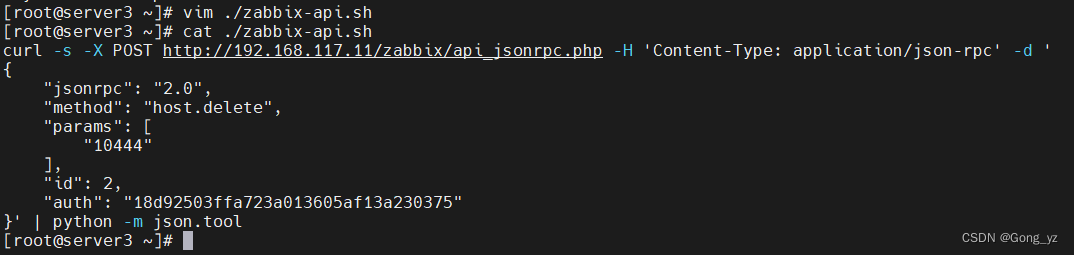
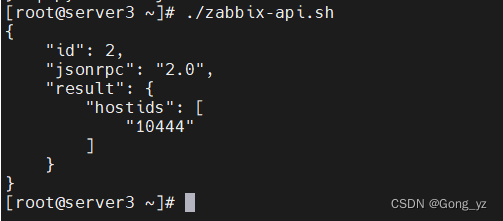
- 3.通过api删除主机
- 4.使用api添加主机
- 5.纯代码过程
- 三、服务监控
- 1.nginx监控
- 2.mysql监控
- (1)zabbix自带mysql模板
- (2)percona数据库模板
前言
Zabbix 由两部分组成:Zabbix Server 与可选组件 Zabbix Agent。
Zabbix Server:通过收集Agent传递过来的数据,写入数据库(MySQL等),最终通过PHP+Apache在web页面进行展示。
Zabbix Agent:通过被监控主机安装Agent的方式来采集数据(需要监控的数据)。
Zabbix API提供两项主要功能:
①远程管理Zabbix配置
②远程检索配置和历史数据
一、zabbix主机发现
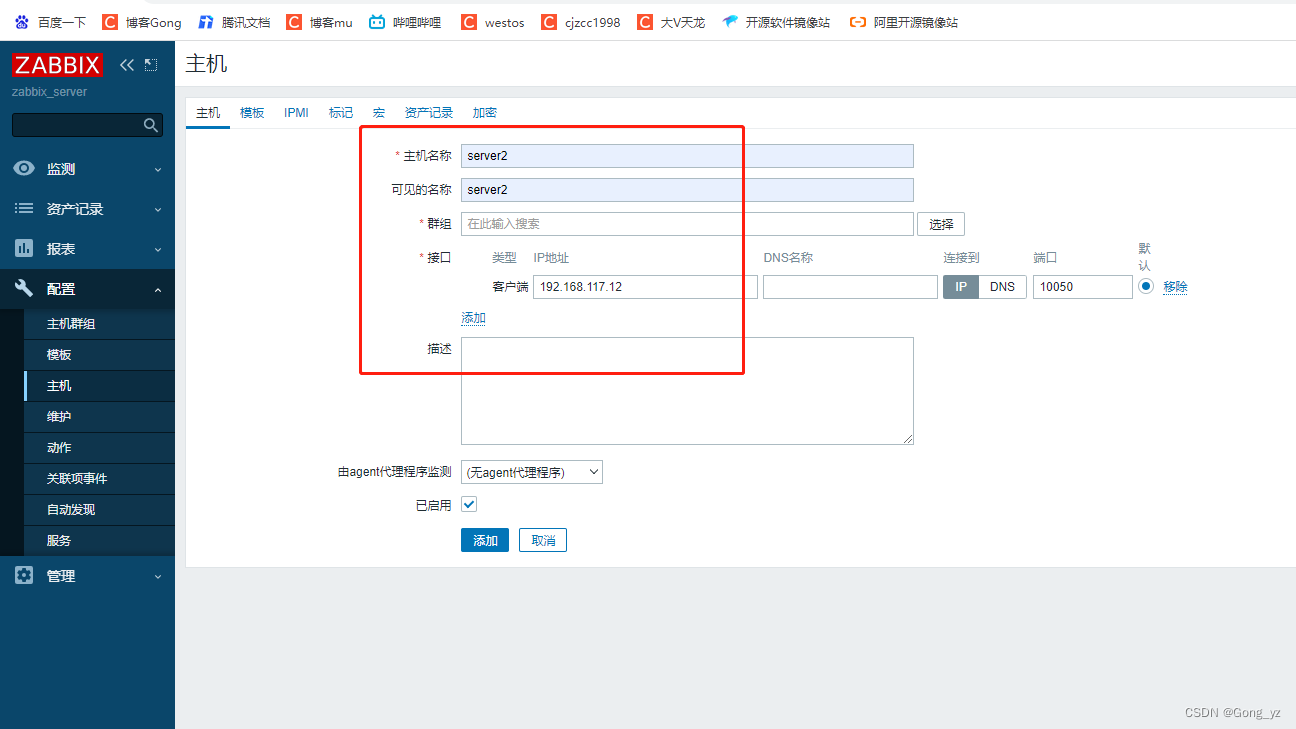
1.手动添加
agent配置
从server1拷贝repo文件
[root@server1 yum.repos.d]# scp zabbix.repo server2:/etc/yum.repos.d/    ##gpgcheck改为0
[root@server2 yum.repos.d]# yum install -y zabbix-agent
[root@server2 ~]# vim /etc/zabbix/zabbix_agentd.conf
...
Server=192.168.56.11
ServerActive=192.168.56.11
Hostname=server2

[root@server2 zabbix]# systemctl  enable --now zabbix-agent.service

[root@server2 ~]# netstat -antlp |grep :10050
tcp        0      0 0.0.0.0:10050           0.0.0.0:*               LISTEN      8336/zabbix_agentd
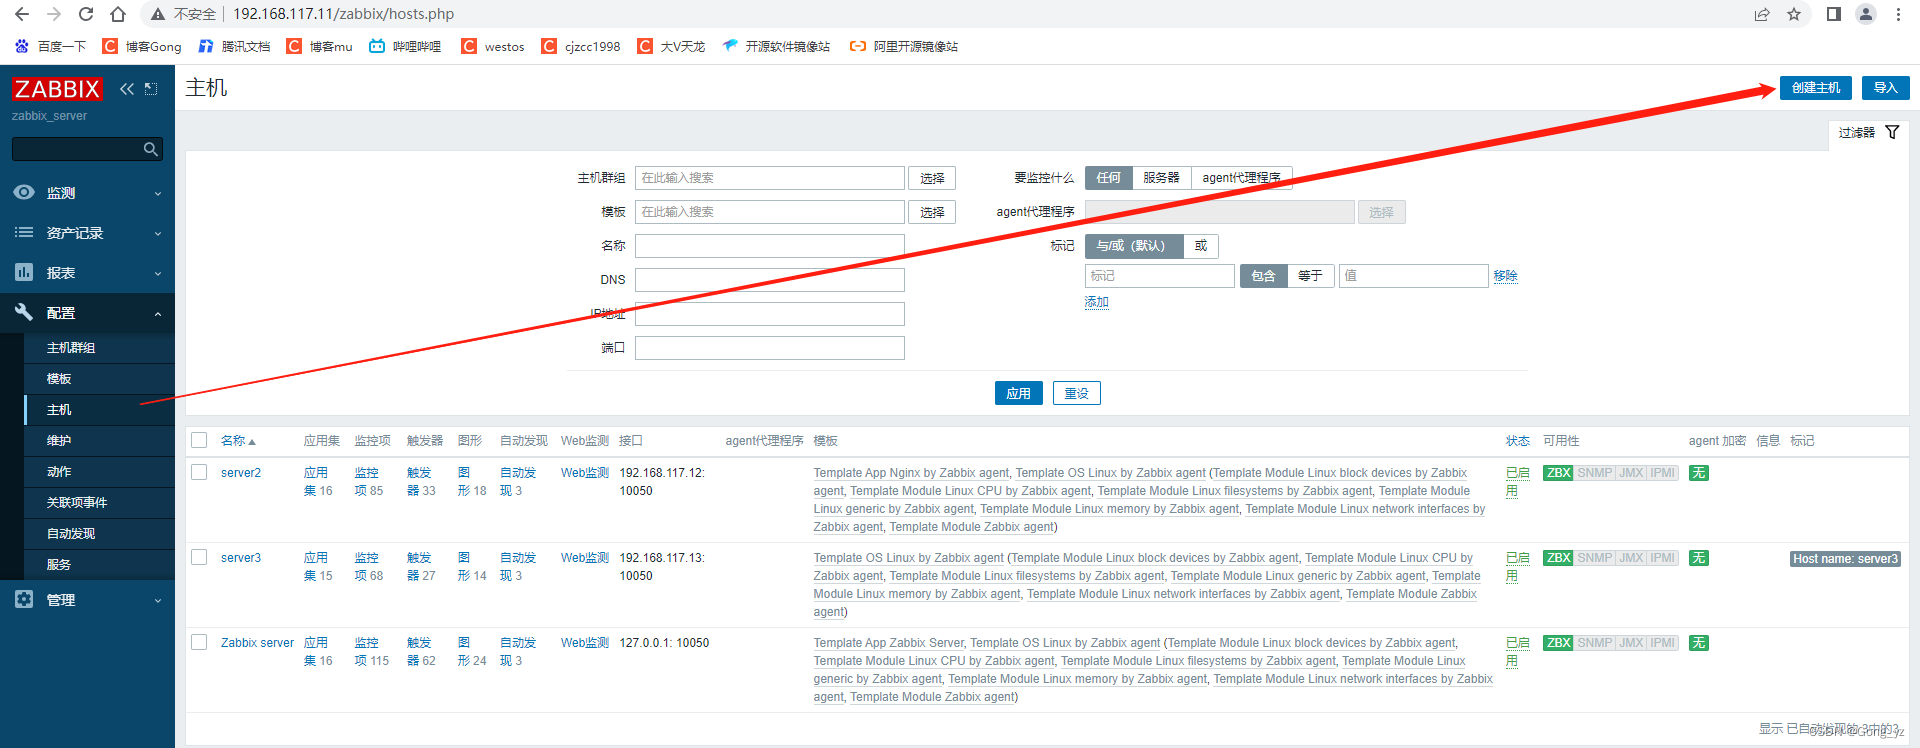
可用性变成绿色表示添加成功

2.自动发现
agent配置
从server1拷贝repo文件
[root@server1 yum.repos.d]# scp zabbix.repo server3:/etc/yum.repos.d/
[root@server3 yum.repos.d]# yum install -y zabbix-agent
[root@server3 ~]# vim /etc/zabbix/zabbix_agentd.conf
...
Server=192.168.56.11
ServerActive=192.168.56.11
Hostname=server3

[root@server3 zabbix]# systemctl  enable --now zabbix-agent.service
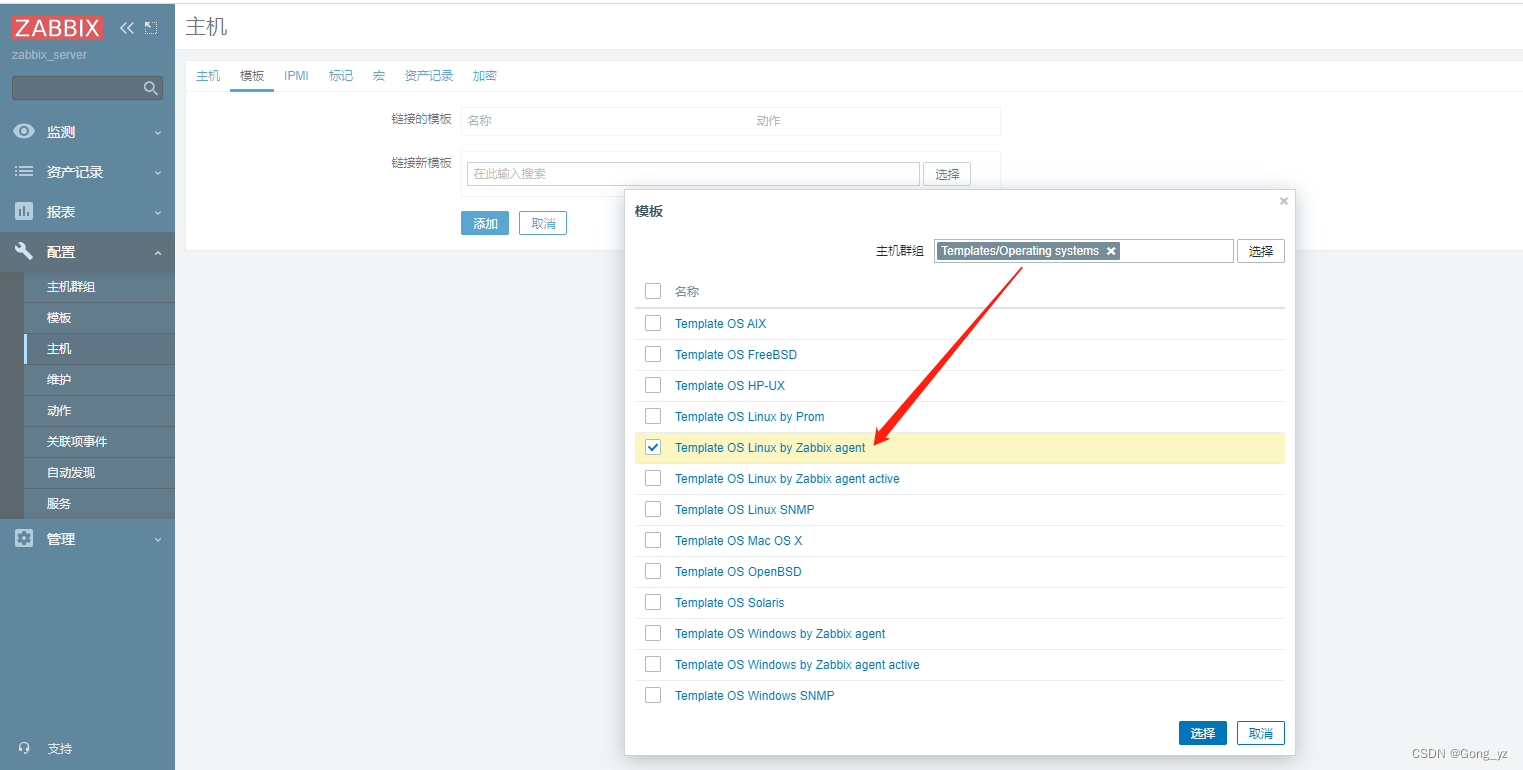
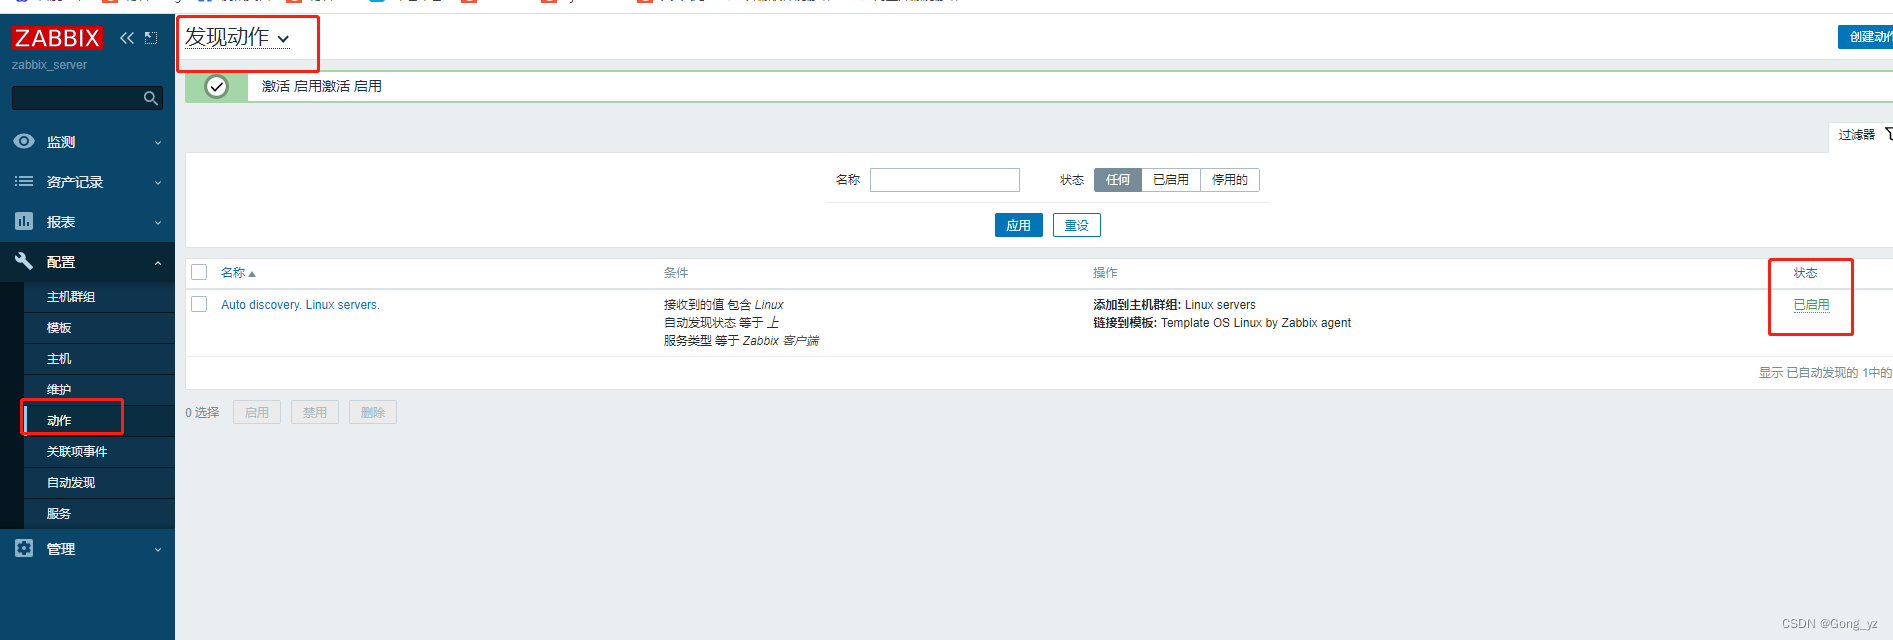
server端配置
选择发现动作,并激活
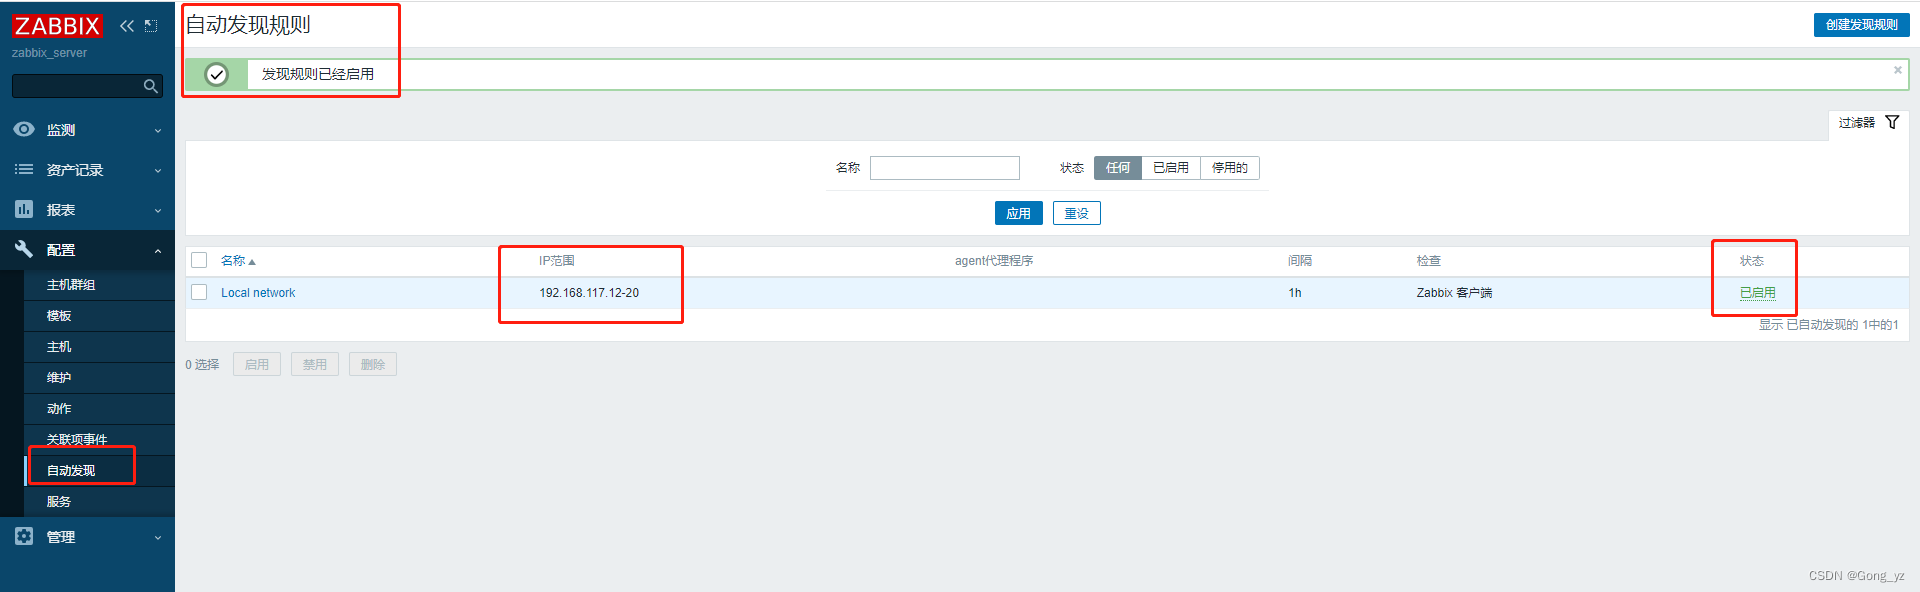
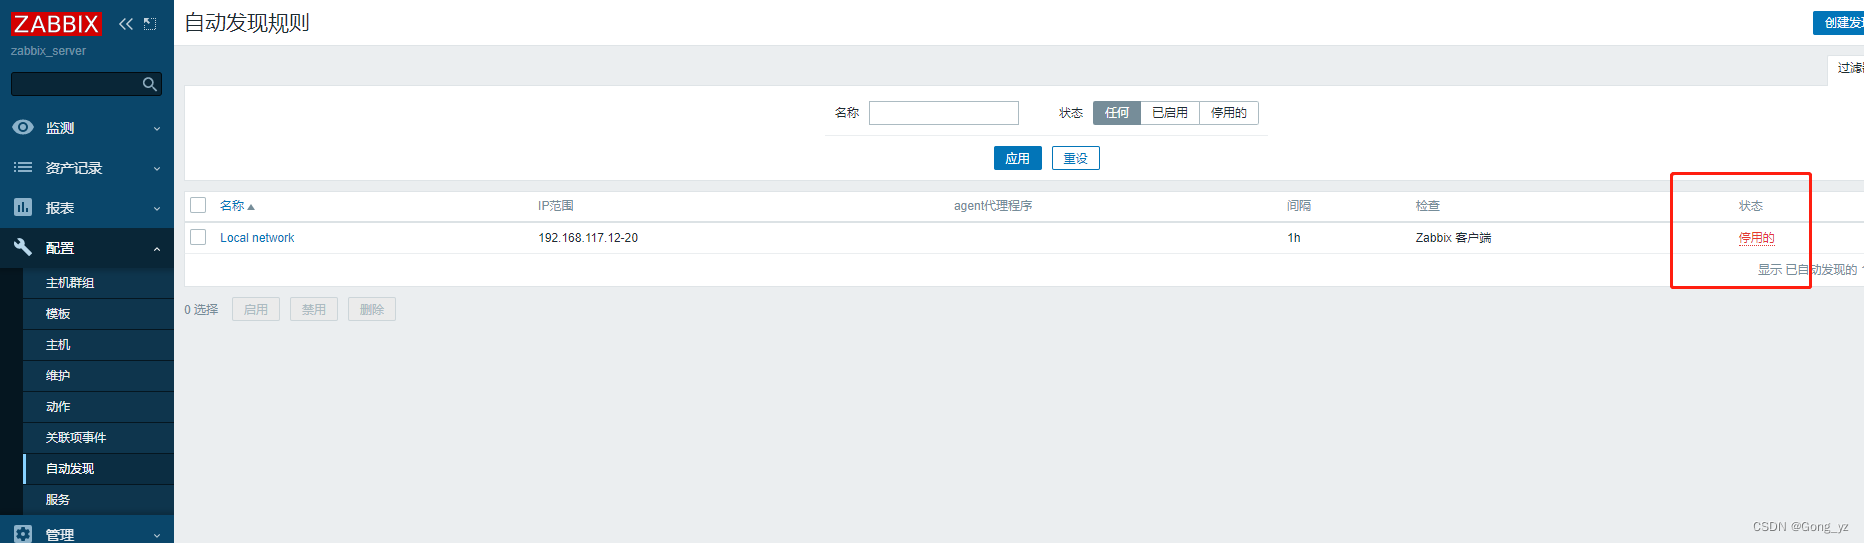
选择自动发现,修改实际的网络地址段,并激活
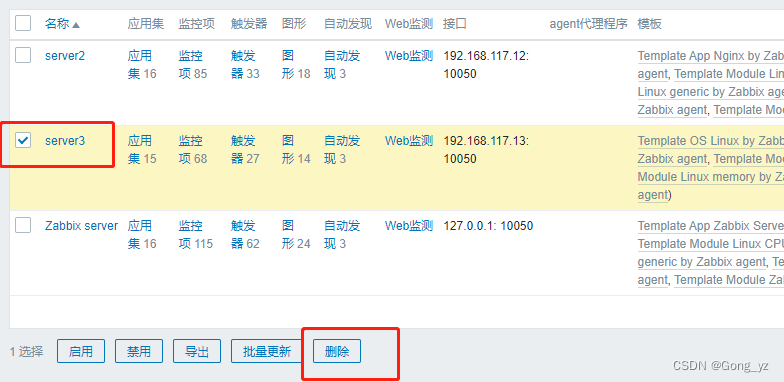
3.自动注册
先删除server3主机
停用自动发现规则
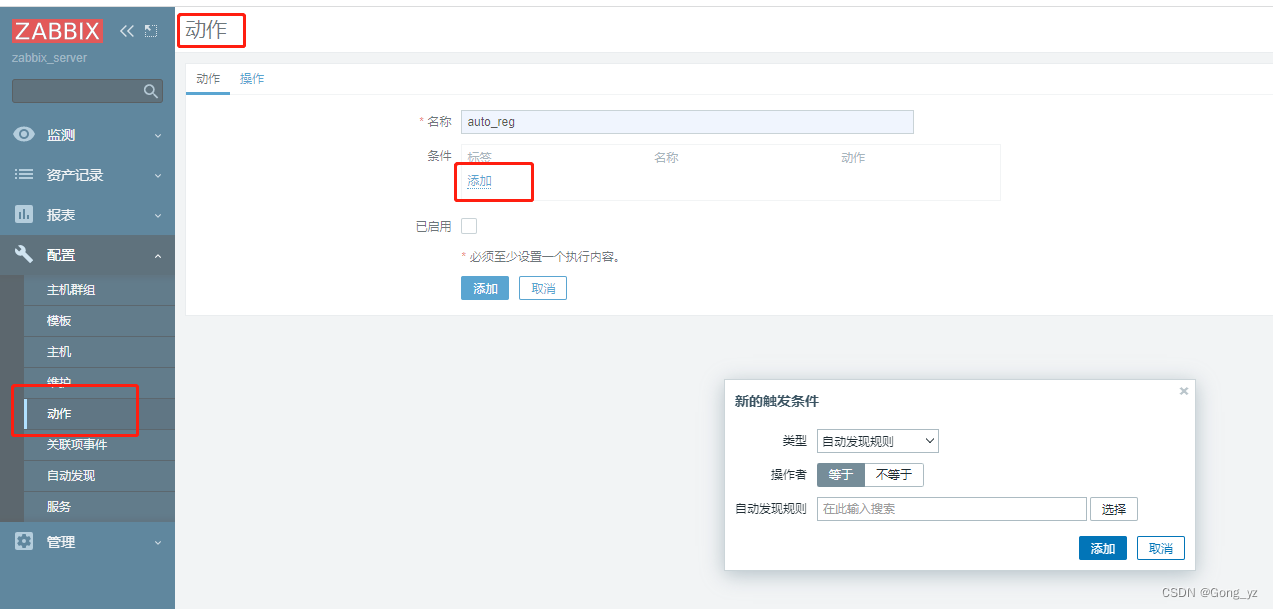
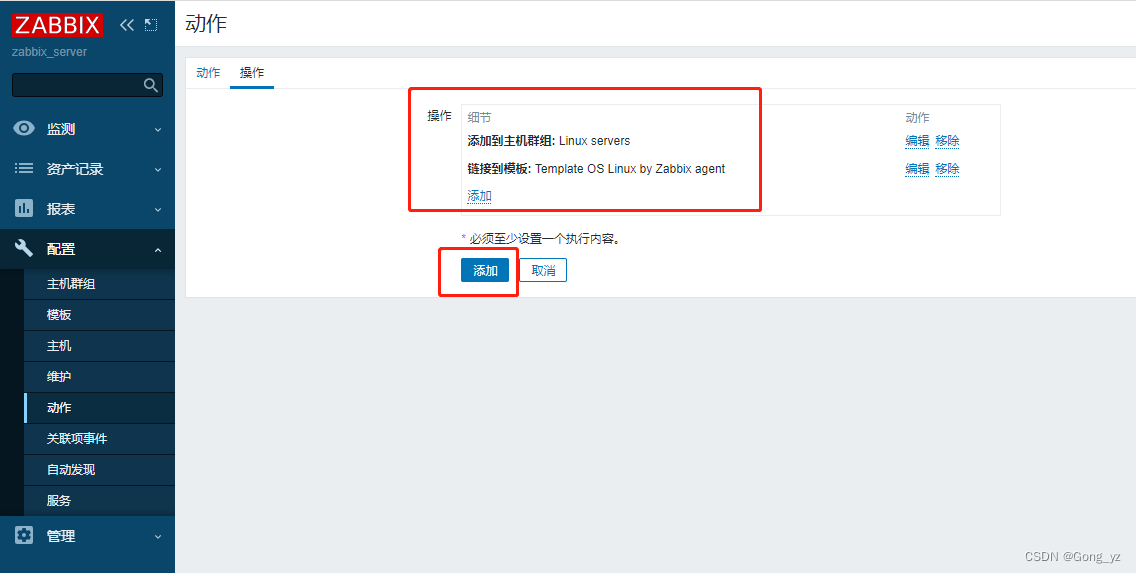
创建自动注册动作
agent端重启服务即可生效
[root@server3 ~]# systemctl restart zabbix-agent.service
二、zabbix api
Zabbix API提供两项主要功能:
①远程管理Zabbix配置
②远程检索配置和历史数据
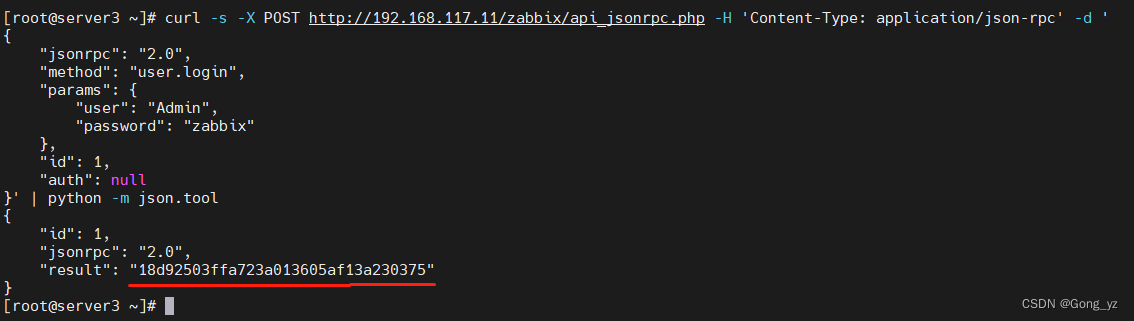
1.获取token
[root@server3 ~]# curl -s -X POST http://192.168.117.11/zabbix/api_jsonrpc.php -H 'Content-Type: application/json-rpc' -d '
{
    "jsonrpc": "2.0",
    "method": "user.login",
    "params": {
        "user": "Admin",
        "password": "zabbix"
    },
    "id": 1,
    "auth": null
}' | python -m json.tool
{
    "id": 1,
    "jsonrpc": "2.0",
    "result": "18d92503ffa723a013605af13a230375"
}
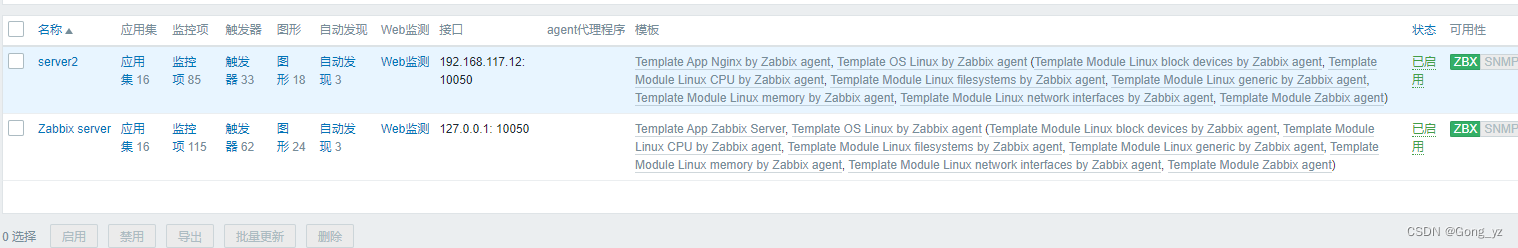
2.使用api检索主机
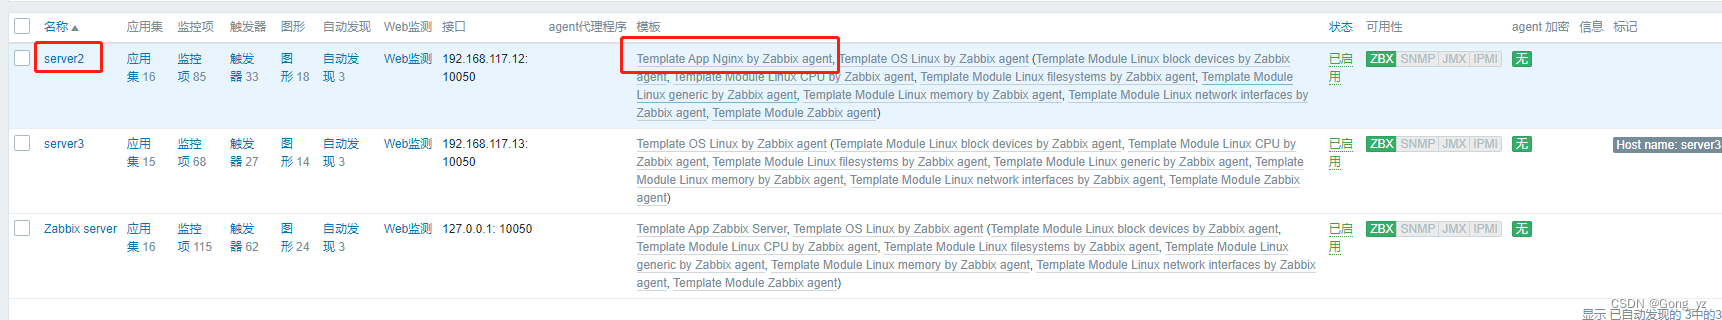
获取的主机列表
3.通过api删除主机
执行效果:server3已删除
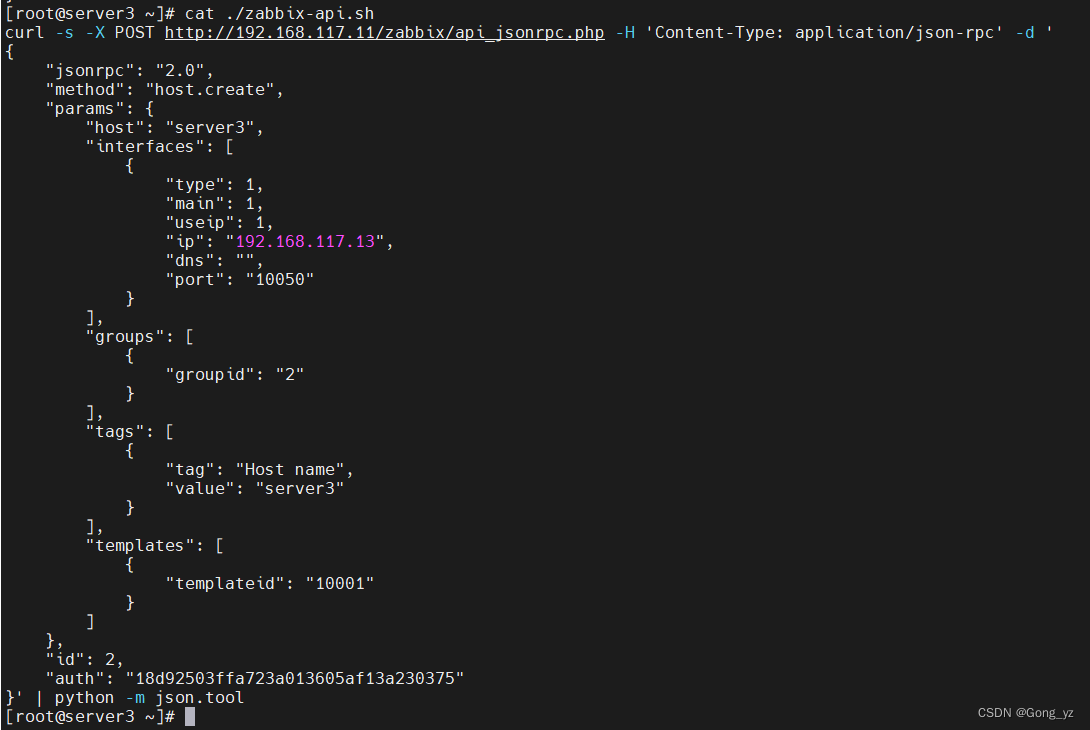
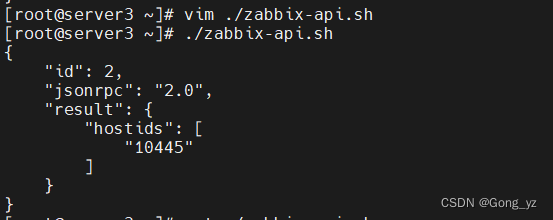
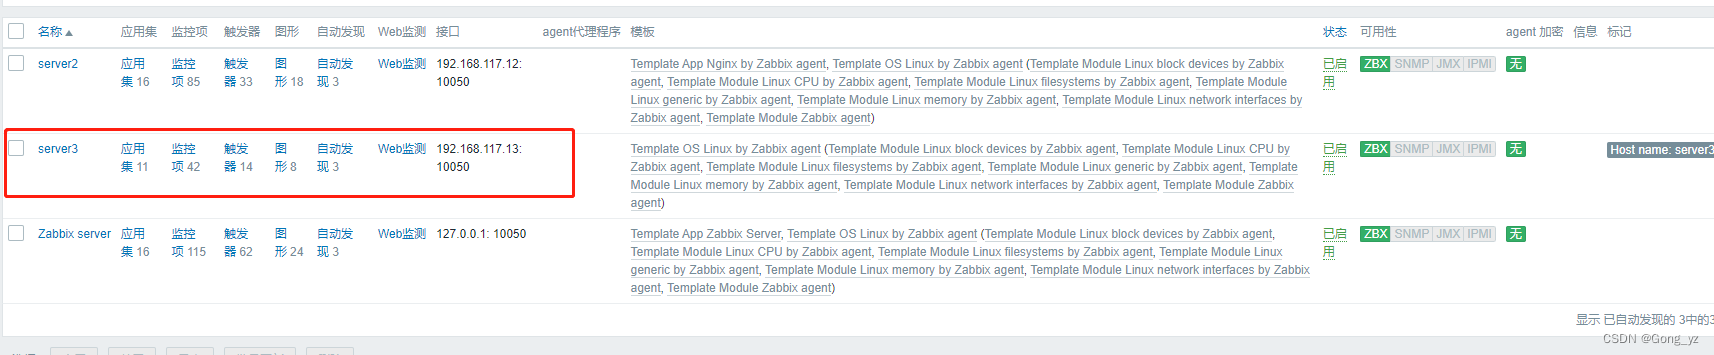
4.使用api添加主机
执行效果:server3已添加
5.纯代码过程
检索主机
curl -s -X POST http://192.168.56.11/zabbix/api_jsonrpc.php -H 'Content-Type: application/json-rpc' -d '
{
    "jsonrpc": "2.0",
    "method": "host.get",
    "params": {
        "output": [
            "hostid",
            "host"
        ],
        "selectInterfaces": [
            "interfaceid",
            "ip"
        ]
    },
    "id": 2,
    "auth": "2a1536963f6ba0eeed3d0c113b16dc50"
}' | python -m json.tool
删除主机
curl -s -X POST http://192.168.56.11/zabbix/api_jsonrpc.php -H 'Content-Type: application/json-rpc' -d '
{
    "jsonrpc": "2.0",
    "method": "host.delete",
    "params": [
        "10440"
    ],
    "id": 2,
    "auth": "2a1536963f6ba0eeed3d0c113b16dc50"
}' | python -m json.tool

创建主机
curl -s -X POST http://192.168.56.11/zabbix/api_jsonrpc.php -H 'Content-Type: application/json-rpc' -d '
{
    "jsonrpc": "2.0",
    "method": "host.create",
    "params": {
        "host": "server3",
        "interfaces": [
            {
                "type": 1,
                "main": 1,
                "useip": 1,
                "ip": "192.168.56.13",
                "dns": "",
                "port": "10050"
            }
        ],
        "groups": [
            {
                "groupid": "2"
            }
        ],
        "tags": [
            {
                "tag": "Host name",
                "value": "server3"
            }
        ],
        "templates": [
            {
                "templateid": "10001"
            }
        ]
    },
    "id": 2,
    "auth": "2a1536963f6ba0eeed3d0c113b16dc50"
}' | python -m json.tool
三、服务监控
1.nginx监控
安装nginx
[root@server2 ~]# tar zxf nginx-1.23.3.tar.gz
[root@server2 ~]# cd nginx-1.23.3/
[root@server2 nginx-1.23.3]# yum install -y gcc make openssl-devel pcre-devel
编译,添加监控模块:
[root@server2 nginx-1.23.3]# ./configure  --with-http_stub_status_module --with-http_ssl_module
[root@server2 nginx-1.23.3]# make && make install

[root@server2 nginx]# ln -s /usr/local/nginx/sbin/nginx  /usr/local/bin/

[root@server2 ~]# vim /usr/local/nginx/conf/nginx.conf     ##加的模板不一定能用,根据点击模板的名字弹出的文档所添加
                                                           ##在 nginx.conf 中添加监控模块:
server {
        listen       80;
        server_name  localhost;
...
        location = /basic_status {
            stub_status;
        }
...

[root@server2 conf]# nginx
[root@server2 conf]# netstat -antlp|grep :80
tcp        0      0 0.0.0.0:80              0.0.0.0:*               LISTEN      23962/nginx: master

[root@server2 conf]# curl  localhost/basic_status
Active connections: 1
server accepts handled requests
 3 3 3
Reading: 0 Writing: 1 Waiting: 0
在server端为主机关联nginx服务监控模板
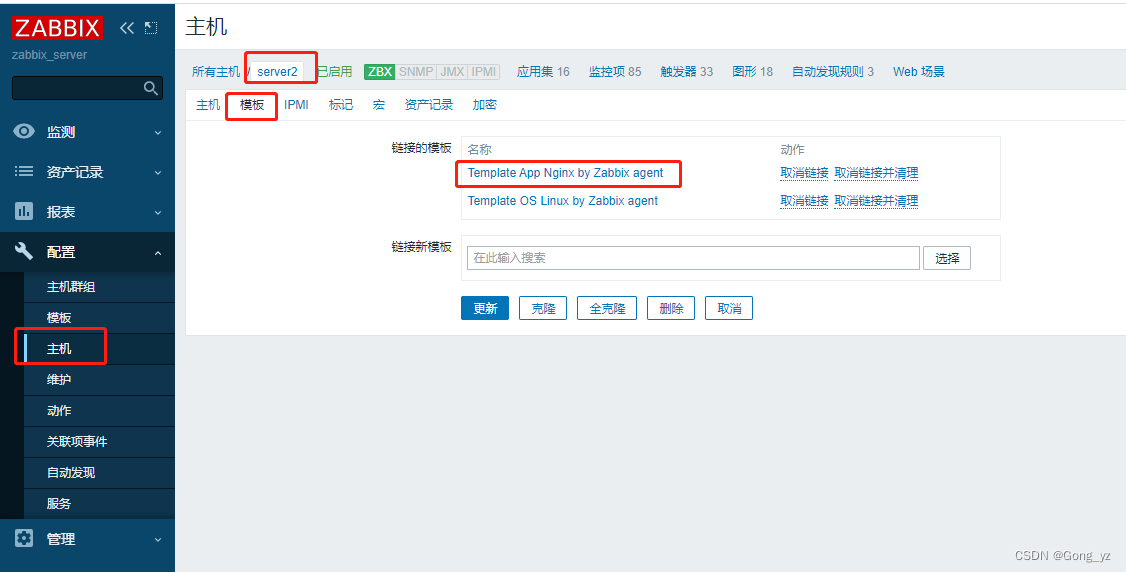
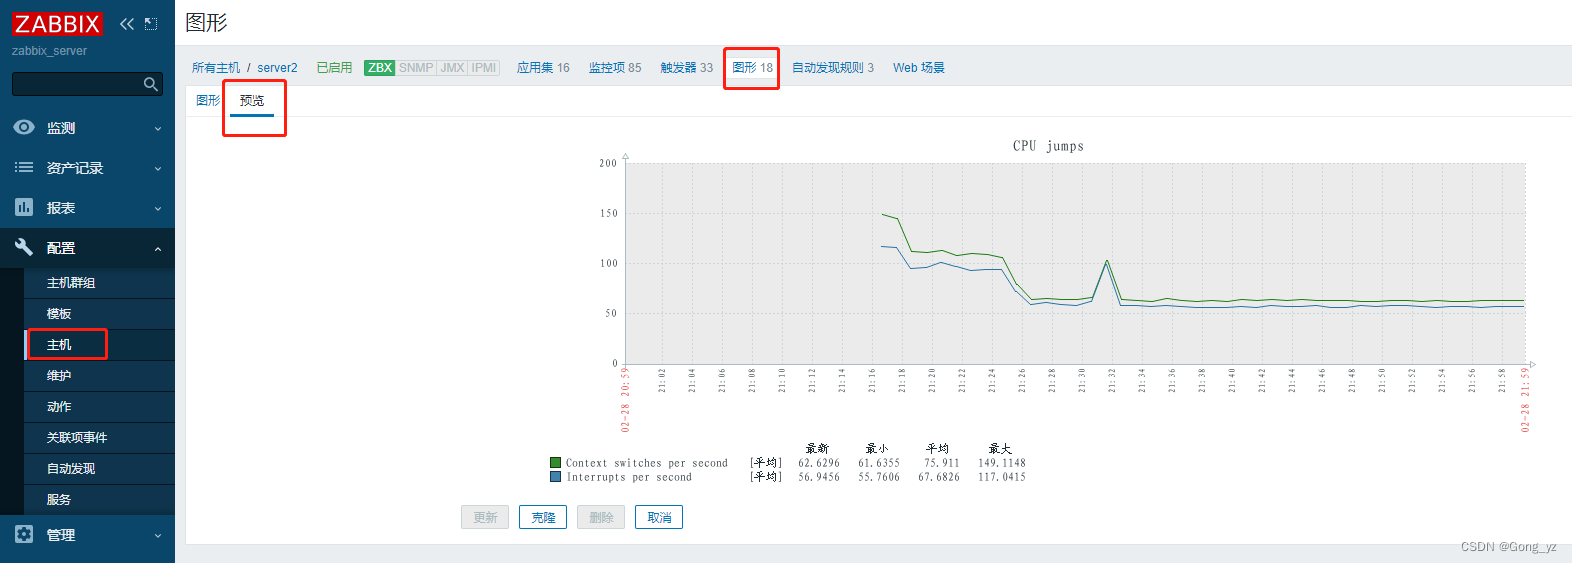
稍作等待,监控数据就会出来:此截图为实验后较长时间,故数据较多
2.mysql监控
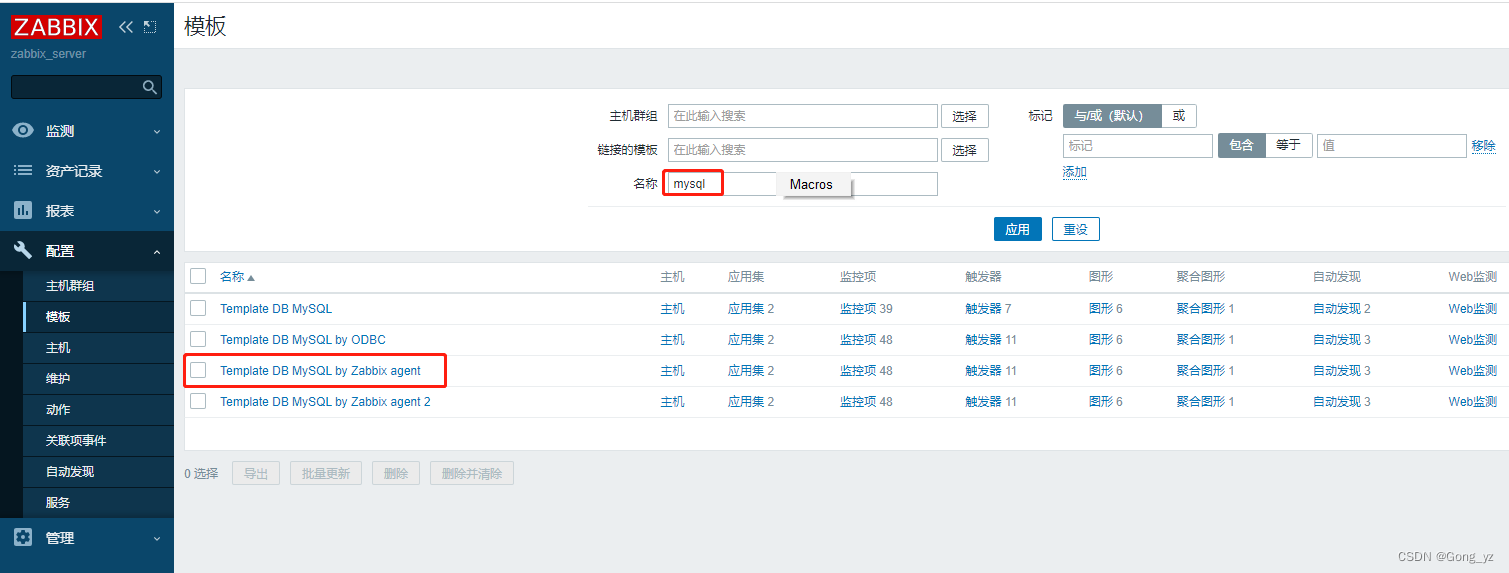
(1)zabbix自带mysql模板
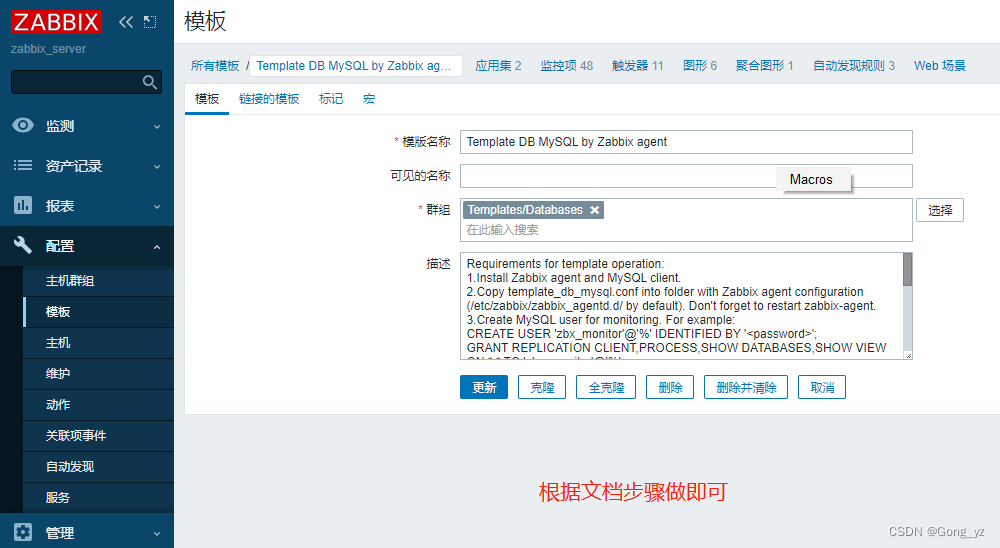
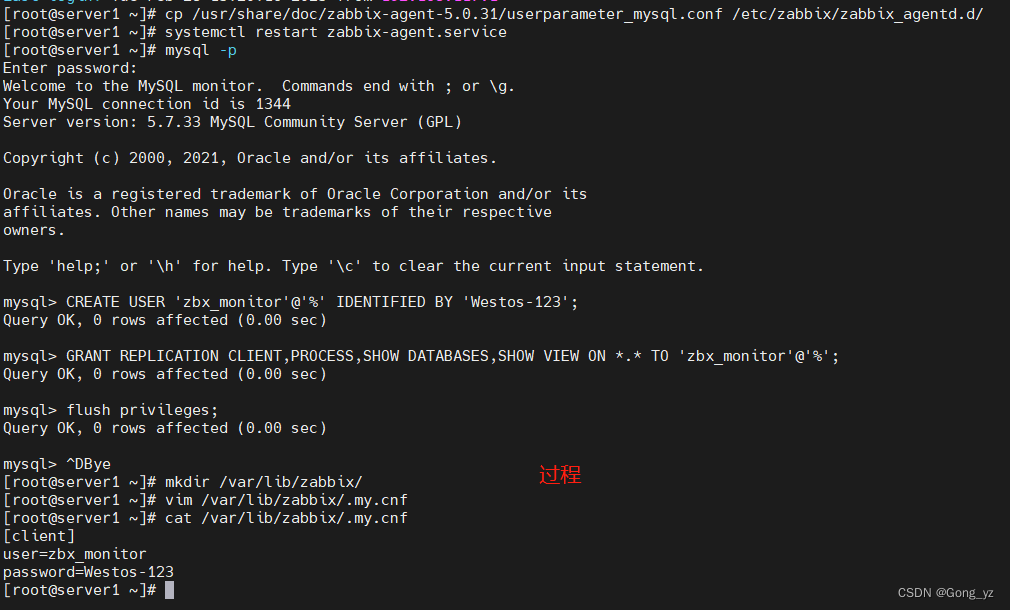
拷贝模板
[root@server1 ~]# cp /usr/share/doc/zabbix-agent-5.0.31/userparameter_mysql.conf /etc/zabbix/zabbix_agentd.d/
重启agent
[root@server1 zabbix_agentd.d]# systemctl  restart zabbix-agent.service

创建数据库连接用户
[root@server1 zabbix_agentd.d]# mysql -p
mysql> CREATE USER 'zbx_monitor'@'%' IDENTIFIED BY 'Yakexi+007';
Query OK, 0 rows affected (0.00 sec)

mysql> GRANT REPLICATION CLIENT,PROCESS,SHOW DATABASES,SHOW VIEW ON *.* TO 'zbx_monitor'@'%';
Query OK, 0 rows affected (0.00 sec)

mysql> flush privileges;
Query OK, 0 rows affected (0.00 sec)

创建数据库连接文件
[root@server1 ~]# mkdir /var/lib/zabbix/
[root@server1 ~]# vim /var/lib/zabbix/.my.cnf
[client]
user=zbx_monitor
password=Yakexi+007
虚拟机过程截图
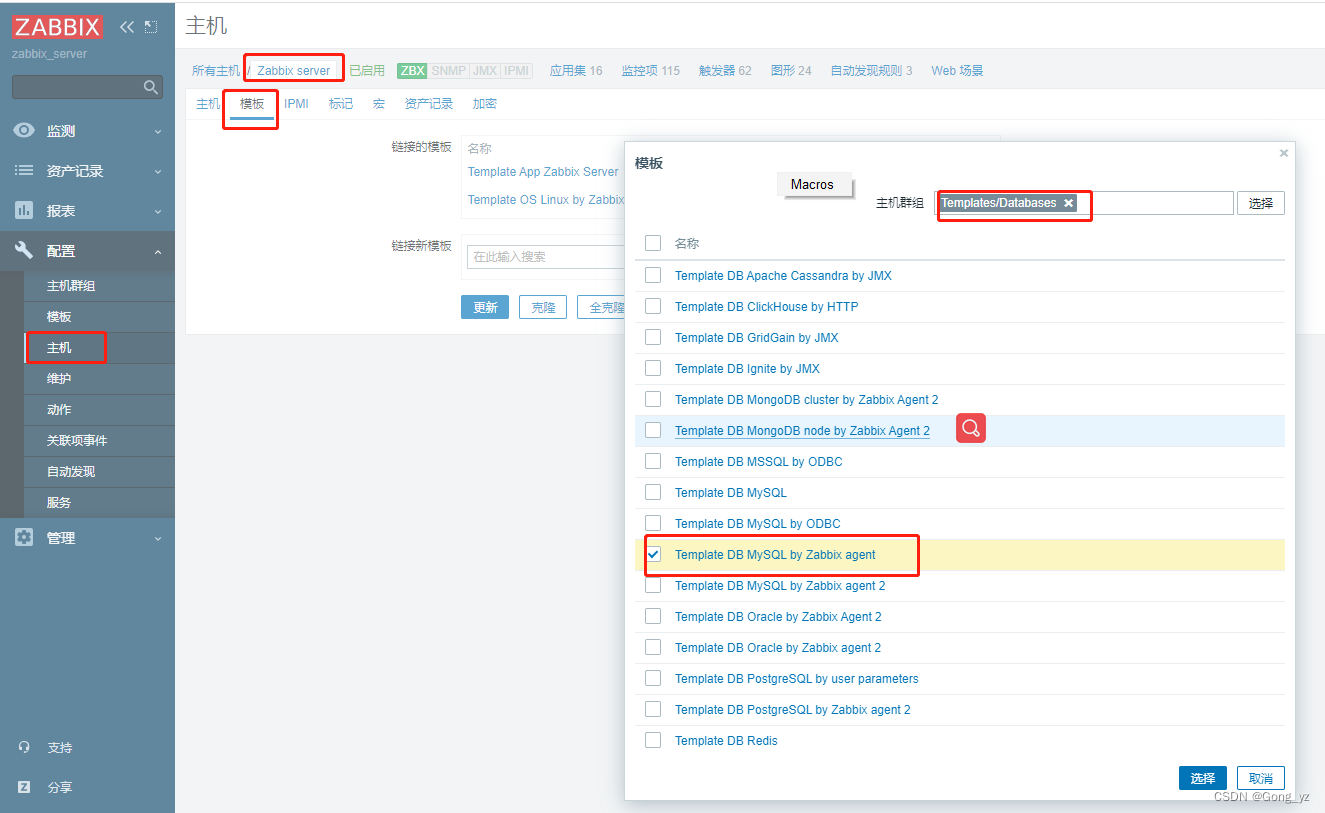
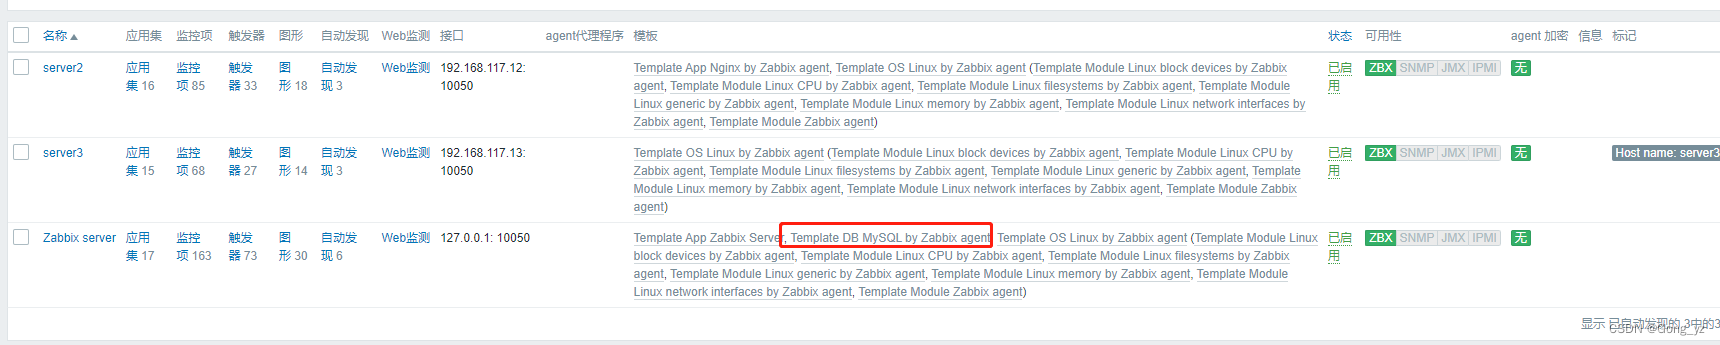
为zabbix server链接mysql监控模板
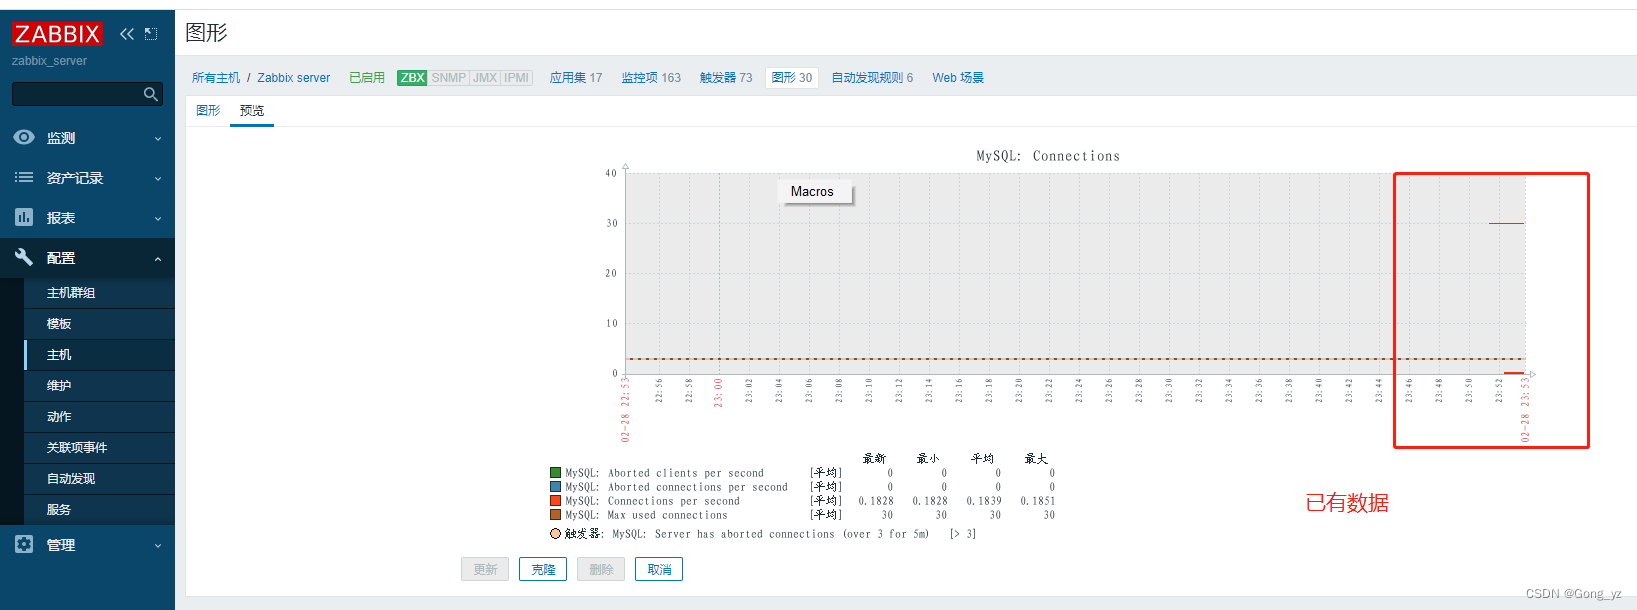
(2)percona数据库模板
先取消mysql模板,添加更好用的percona
zabbix自带的mysql模板比较简单,所以推荐使用percona的数据库模板
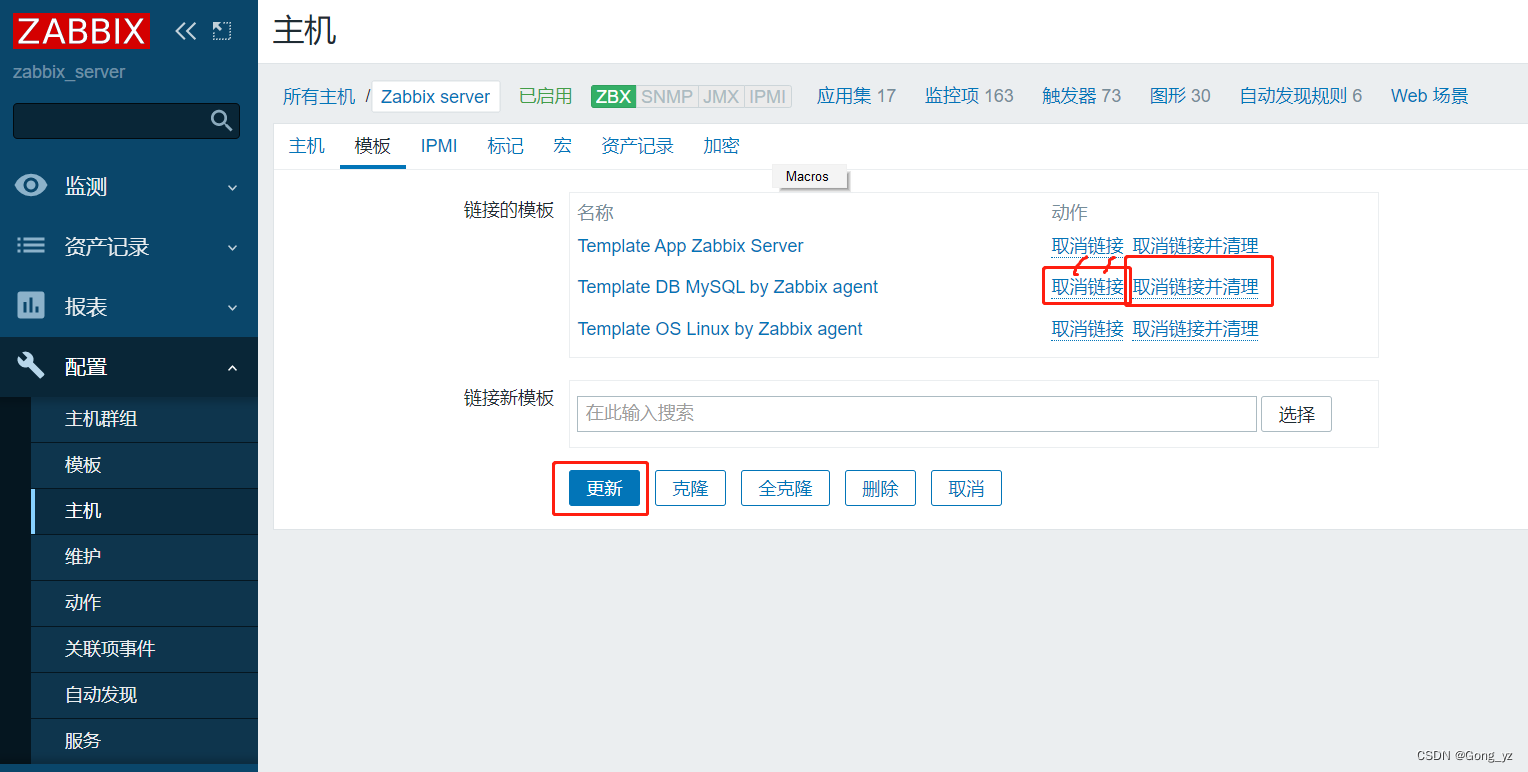
取消链接并清理
[root@server1 ~]# rpm -ivh percona-zabbix-templates-1.1.8-1.noarch.rpm
[root@server1 scripts]# cd /var/lib/zabbix/percona/templates
把190个监控项文件进行copy
[root@server1 templates]# cp userparameter_percona_mysql.conf /etc/zabbix/zabbix_agentd.d/
[root@server1 templates]# systemctl restart zabbix-agent.service
[root@server1 zabbix_agentd.d]# cd /var/lib/zabbix/percona/scripts/
[root@server1 scripts]# vim ss_get_mysql_stats.php
...
$mysql_user = 'root'; ##修改php中的mysql用户和密码使之能访问数据库:
$mysql_pass = 'Yakexi+007';
测试脚本
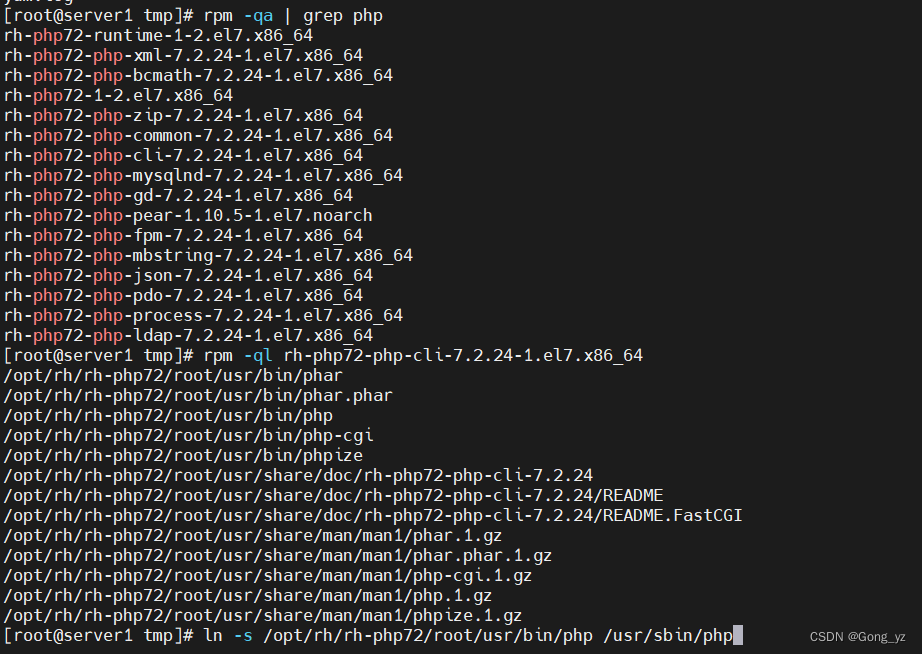
[root@server1 scripts]# ln -s /opt/rh/rh-php72/root/usr/bin/php /usr/bin/php
[root@server1 scripts]# /var/lib/zabbix/percona/scripts/get_mysql_stats_wrapper.sh gg
20
有数据显示就表示正常
删除tmp下的缓存文件
[root@server1 scripts]# cd /tmp/
[root@server1 tmp]# rm -f localhost-mysql_cacti_stats.txt
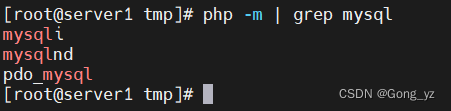
问题:执行脚本后报错找不到php命令
分析:我们之前已经安装了php,但是还是找不到,说明php的命令二进制文件不在默认的脚本路径 /usr/bin/下
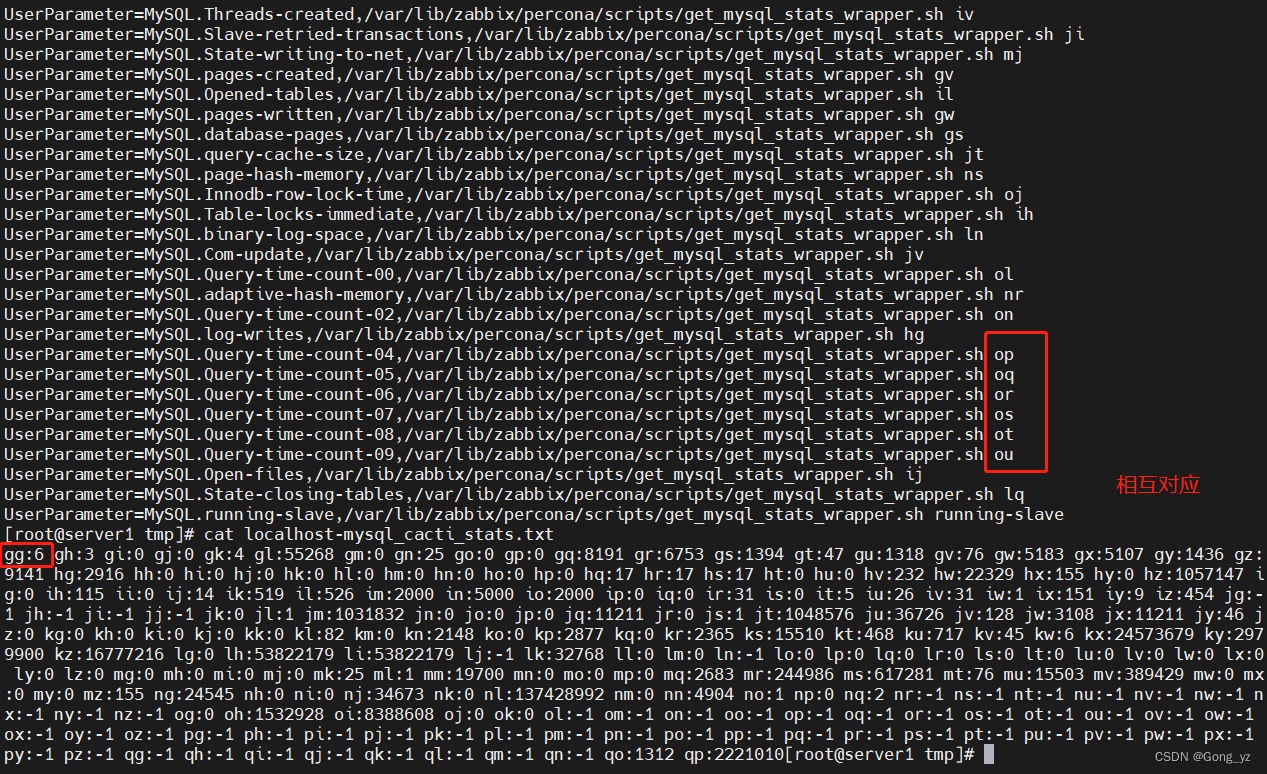
查看文件发现都是以绝对路径调用,我们也以绝对路径调用:
对应190个监控项
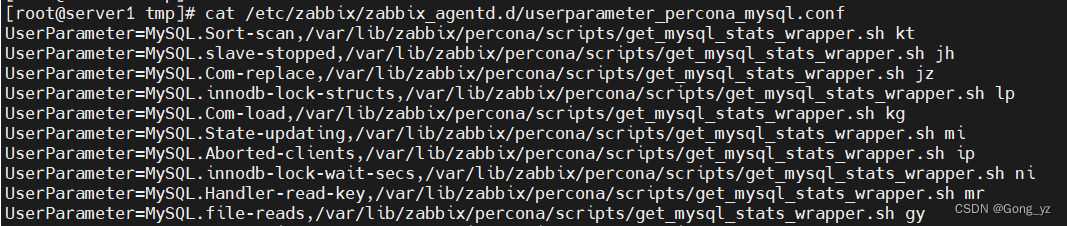

以下数据都是由php代码的mysql模块从数据库中抓出来的,而shell脚本只是从这个缓存文件中把数据取出来: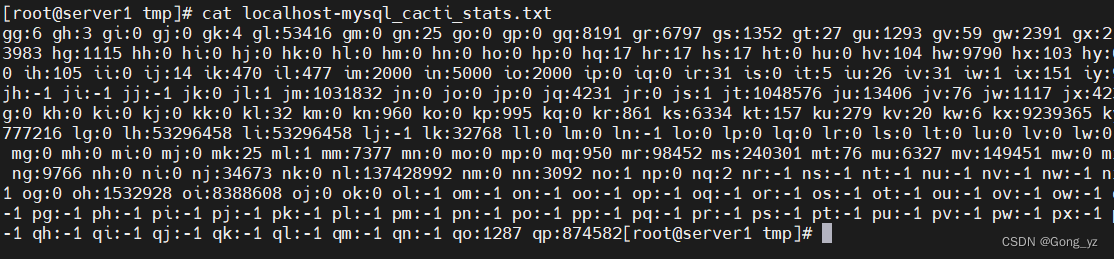
做完实验后我们把这个文件删掉,因为之前我们是通过超户root调用的,正常我们应该用的zabbix用户调用,权限是不一样的: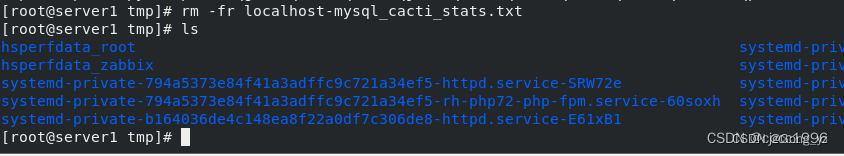
前端操作:
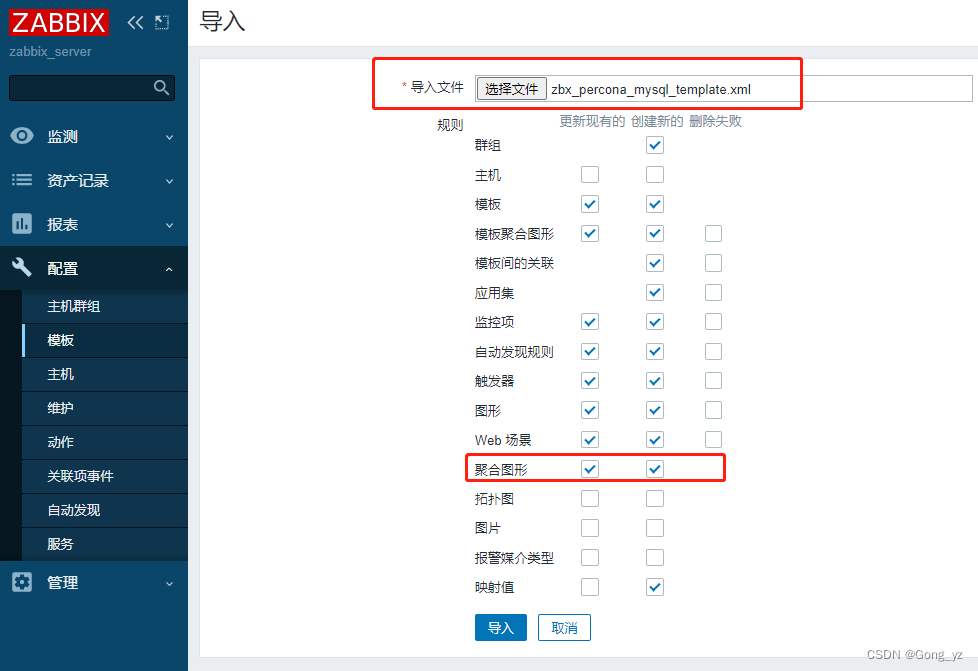
导入模板文件
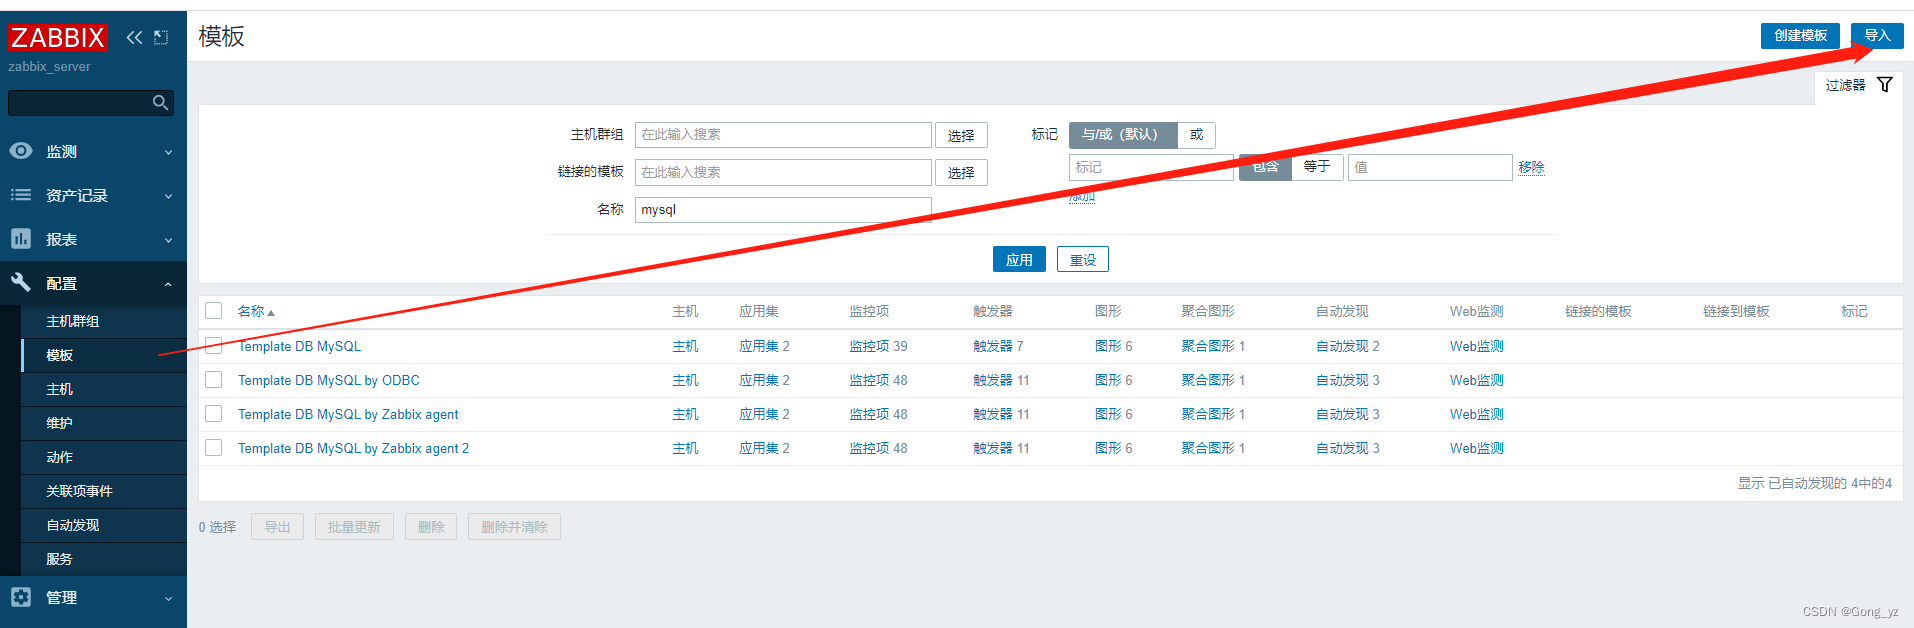
导入
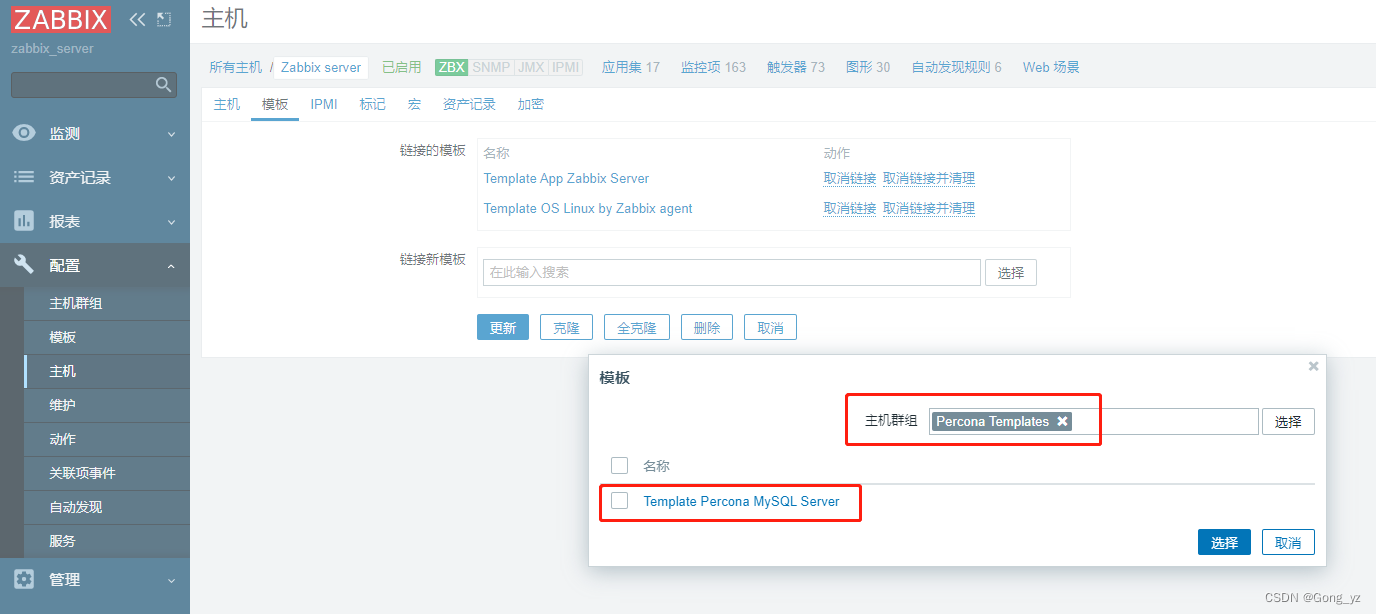
关联模板
等待监控数据出来
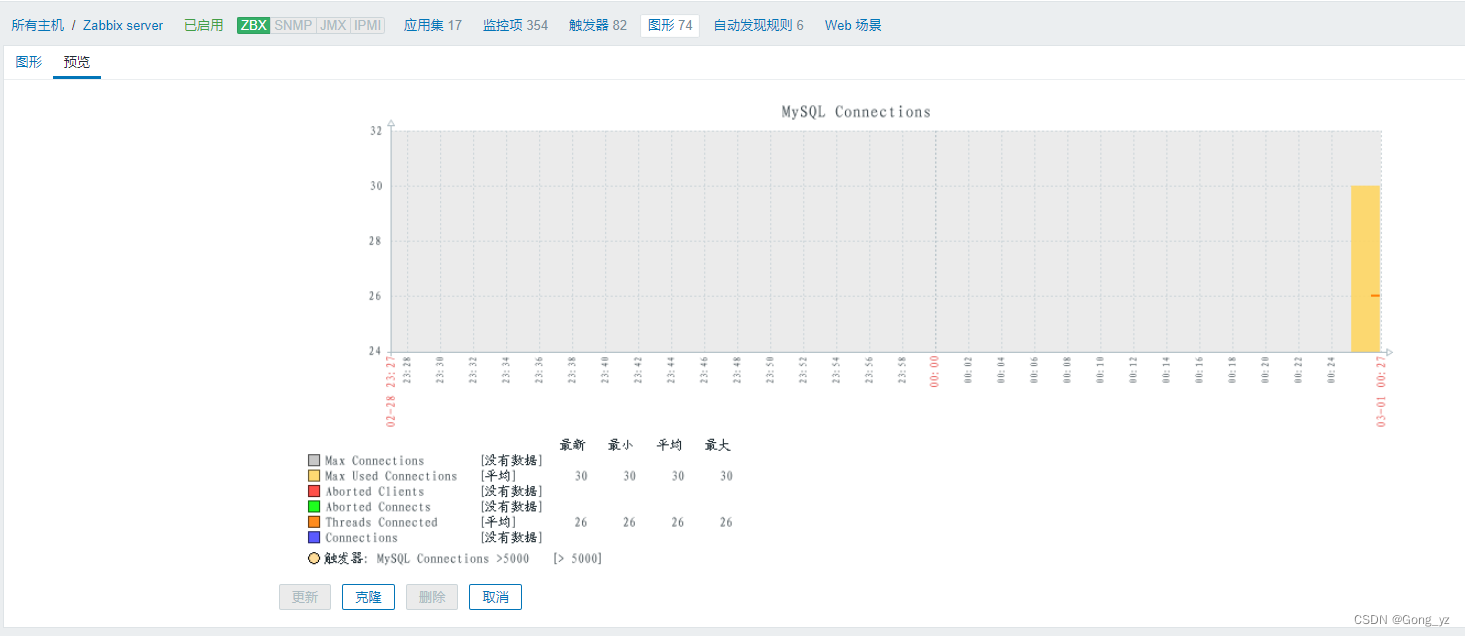
只要/tmp生成缓存文件就表示成功:需要确保zabbix用户的权限
[root@server1 tmp]# ls localhost-mysql_cacti_stats.txt
localhost-mysql_cacti_stats.txt
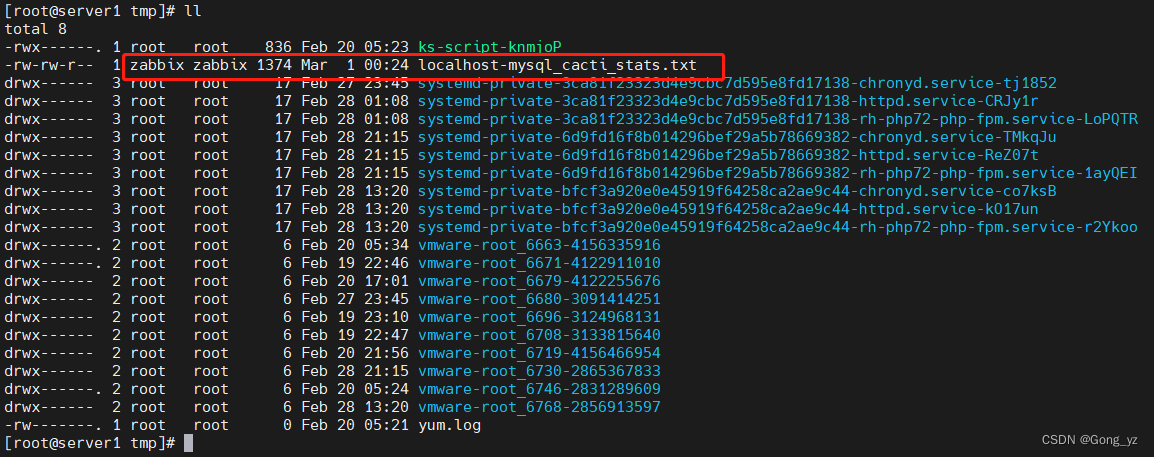
缓存文件是通过PHP代码访问数据库,拿过来的,数据已经做过格式化