目录
- 一、就医提醒
- 1、搭建定时任务模块
- 二、后台管理系统-预约统计功能
- 1、开发每天预约数据接口
- 2、封装远程调用接口
- 3、搭建统计分析模块
- 4、整合统计功能前端
一、就医提醒
我们通过定时任务,每天8点执行,提醒就诊
1、搭建定时任务模块
(1)添加依赖
    <dependencies>
        <dependency>
            <groupId>com.donglin</groupId>
            <artifactId>rabbit_util</artifactId>
            <version>0.0.1-SNAPSHOT</version>
        </dependency>
    </dependencies>
(2)添加配置文件
# 服务端口
server.port=8208
# 服务名
spring.application.name=service-task
# 环境设置:dev、test、prod
spring.profiles.active=dev

# nacos服务地址
spring.cloud.nacos.discovery.server-addr=127.0.0.1:8848

#rabbitmq地址
spring.rabbitmq.host=192.168.121.140
spring.rabbitmq.port=5672
spring.rabbitmq.username=admin
spring.rabbitmq.password=admin
(3)添加启动类
@SpringBootApplication(exclude = DataSourceAutoConfiguration.class)
@EnableDiscoveryClient
@ComponentScan(basePackages = "com.donglin")
public class ServiceTaskApplication {
    public static void main(String[] args) {
        SpringApplication.run(ServiceTaskApplication.class, args);
    }
}
(4)添加常量配置
在rabbit-util模块MqConst类添加
//定时任务
public static final String EXCHANGE_DIRECT_TASK = "exchange.direct.task";
public static final String ROUTING_TASK_8 = "task.8";
//队列
public static final String QUEUE_TASK_8 = "queue.task.8";
(5)添加定时任务
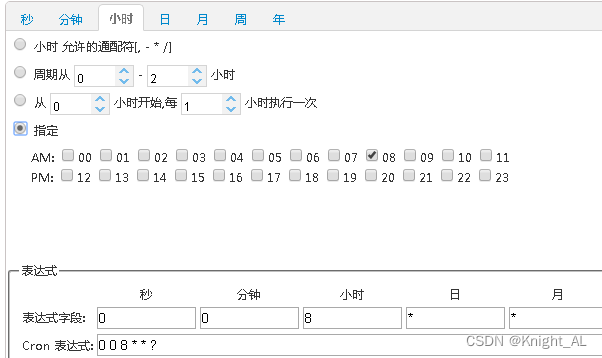
cron表达式
@Component
@EnableScheduling
public class PatientRemindJob {
//Quartz:
//Quartz:cron表达式: 秒 分 时 dayofMonth Month dayOfWeek Year[最高到2099年]
//*:表示任意xxx
//?:表示无所谓
//-:连续的时间段
// /n:表示每隔多长时间
// ,:可以使用,隔开没有规律的时间
@Autowired
private RabbitService rabbitService;
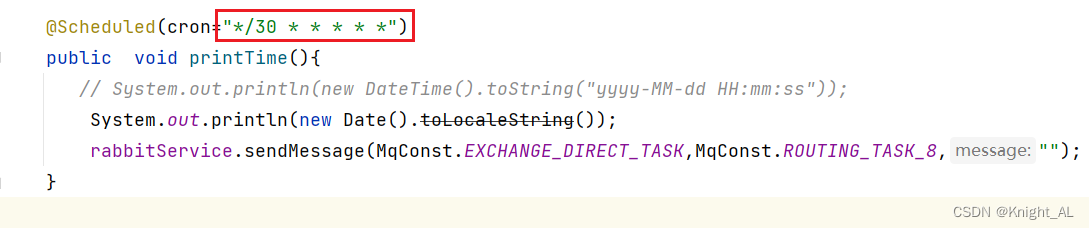
@Scheduled(cron="*/30 * * * * *")
public void printTime(){
// System.out.println(new DateTime().toString("yyyy-MM-dd HH:mm:ss"));
System.out.println(new Date().toLocaleString());
rabbitService.sendMessage(MqConst.EXCHANGE_DIRECT_TASK,MqConst.ROUTING_TASK_8,"");
}
//在springboot定时任务使用:1.在类上加@EnableScheduling 2.在定时任务Job的方法上加@Scheduled并指定石英表达式
//cron表达式写法:七域表达式
}
2、添加就医提醒处理
操作模块service-order
(1)添加OrderInfoService接口和实现
/**
* 就诊提醒
*/
void patientTips();
//实现方法
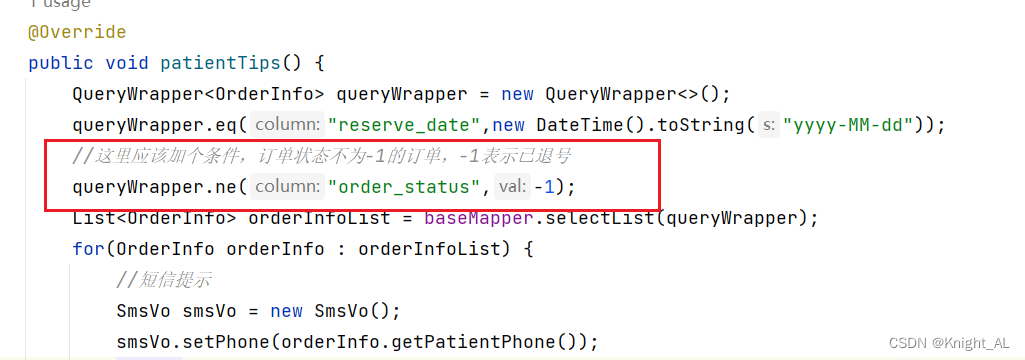
@Override
public void patientTips() {
QueryWrapper<OrderInfo> queryWrapper = new QueryWrapper<>();
queryWrapper.eq("reserve_date",new DateTime().toString("yyyy-MM-dd"));
//这里应该加个条件,订单状态不为-1的订单,-1表示已退号
queryWrapper.ne("order_status",-1);
List<OrderInfo> orderInfoList = baseMapper.selectList(queryWrapper);
for(OrderInfo orderInfo : orderInfoList) {
//短信提示
SmsVo smsVo = new SmsVo();
smsVo.setPhone(orderInfo.getPatientPhone());
String reserveDate = new DateTime(orderInfo.getReserveDate()).toString("yyyy-MM-dd") + (orderInfo.getReserveTime()==0 ? "上午": "下午");
Map<String,Object> param = new HashMap<String,Object>(){{
put("title", orderInfo.getHosname()+"|"+orderInfo.getDepname()+"|"+orderInfo.getTitle());
put("reserveDate", reserveDate);
put("name", orderInfo.getPatientName());
}};
smsVo.setParam(param);
rabbitService.sendMessage(MqConst.EXCHANGE_DIRECT_SMS, MqConst.ROUTING_SMS_ITEM, smsVo);
}
}
(2)添加mq监听
@Component
public class TaskListener {

    @Autowired
    private OrderInfoService orderService;

    @RabbitListener(bindings = @QueueBinding(
            value = @Queue(value = MqConst.QUEUE_TASK_8, durable = "true"),
            exchange = @Exchange(value = MqConst.EXCHANGE_DIRECT_TASK),
            key = {MqConst.ROUTING_TASK_8}
    ))
    public void patientTips(Message message, Channel channel) throws IOException {
        orderService.patientTips();
    }
}
找到自己当天预约的
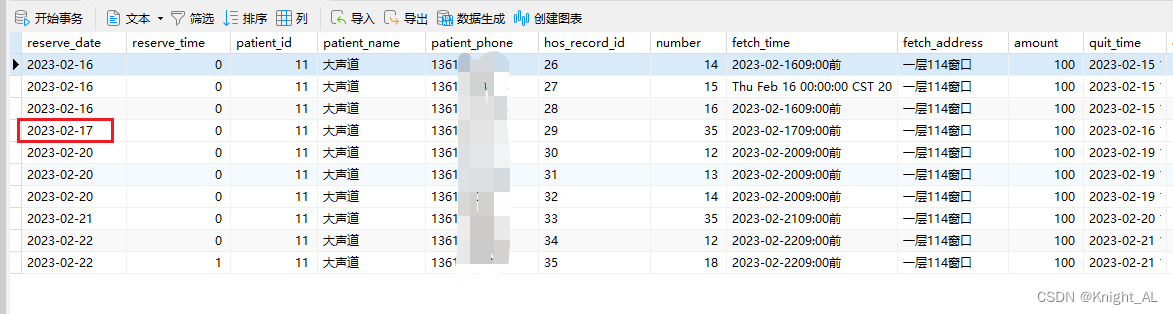
状态为-1为退款 不发短信
每隔30秒打印信息
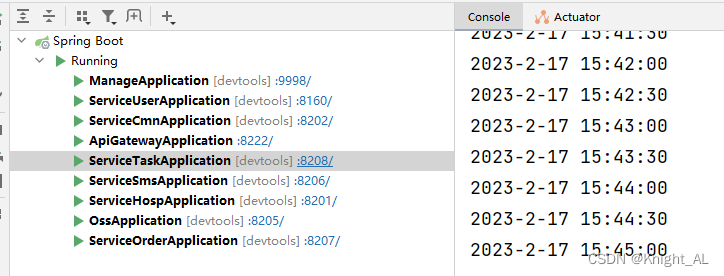
测试成功
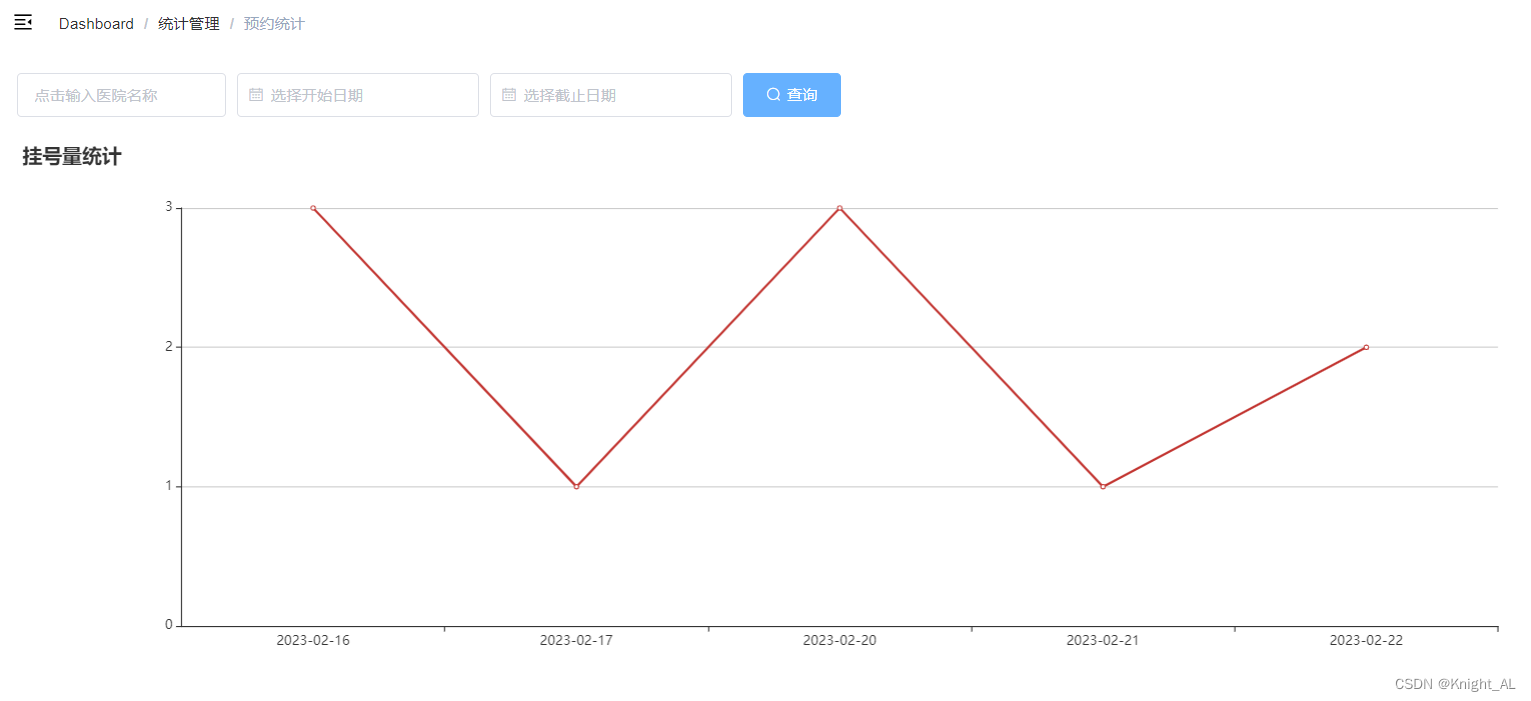
二、后台管理系统-预约统计功能
我们统计医院每天的预约情况,通过图表的形式展示,统计的数据都来自订单模块,因此我们在该模块封装好数据,在统计模块通过feign的形式获取数据。
我们为什么需要一个统计模块呢,因为在实际的生产环境中,有很多种各式统计,数据来源于各个服务模块,我们得有一个统计模块来专门管理

1、开发每天预约数据接口
操作模块:service_orders
(1)在OrderInfoMapper添加方法
public interface OrderMapper extends BaseMapper<OrderInfo> {

    //统计每天平台预约数据
    List<OrderCountVo> selectOrderCount(OrderCountQueryVo orderCountQueryVo);
}
(2)在OrderInfoMapper.xml添加方法
创建OrderInfoMapper.xml文件
<?xml version="1.0" encoding="UTF-8"?>
<!DOCTYPE mapper PUBLIC "-//mybatis.org//DTD Mapper 3.0//EN" "http://mybatis.org/dtd/mybatis-3-mapper.dtd">
<mapper namespace="com.donglin.yygh.order.mapper.OrderInfoMapper">
<select id="selectOrderCount" resultType="com.donglin.yygh.vo.order.OrderCountVo">
select reserve_date as reserveDate, count(reserve_date) as count
from order_info
<where>
<if test="hosname != null and hosname != ''">
and hosname like CONCAT('%',#{hosname},'%')
</if>
<if test="reserveDateBegin != null and reserveDateBegin != ''">
and reserve_date >= #{reserveDateBegin}
</if>
<if test="reserveDateEnd != null and reserveDateEnd != ''">
and reserve_date <= #{reserveDateEnd}
</if>
and is_deleted = 0
</where>
group by reserve_date
order by reserve_date
</select>
</mapper>
(3)添加配置
application.properties添加
mybatis-plus.mapper-locations=classpath:com/donglin/yygh/orders/mapper/xml/*.xml
service模块的pom.xml添加
<build>
    <plugins>
        <plugin>
            <groupId>org.springframework.boot</groupId>
            <artifactId>spring-boot-maven-plugin</artifactId>
        </plugin>
    </plugins>
    <resources>
        <resource>
            <directory>src/main/java</directory>
            <includes>
                <include>**/*.yml</include>
                <include>**/*.properties</include>
                <include>**/*.xml</include>
            </includes>
            <filtering>false</filtering>
        </resource>
        <resource>
            <directory>src/main/resources</directory>
            <includes> <include>**/*.yml</include>
                <include>**/*.properties</include>
                <include>**/*.xml</include>
            </includes>
            <filtering>false</filtering>
        </resource>
    </resources>
</build>
(4)OrderService添加方法和实现
     /**
     * 订单统计
     */
    Map<String, Object> getCountMap(OrderCountQueryVo orderCountQueryVo);

//实现方法
    @Override
    public Map<String, Object> getCountMap(OrderCountQueryVo orderCountQueryVo) {
        Map<String, Object> map = new HashMap<>();

        List<OrderCountVo> orderCountVoList
                = baseMapper.selectOrderCount(orderCountQueryVo);
        //日期列表
        List<String> dateList
                =orderCountVoList.stream().map(OrderCountVo::getReserveDate).collect(Collectors.toList());
        //统计列表
        List<Integer> countList
                =orderCountVoList.stream().map(OrderCountVo::getCount).collect(Collectors.toList());
        map.put("dateList", dateList);
        map.put("countList", countList);
        return map;
    }
(5)在OrderInfoController添加方法
    @ApiOperation(value = "获取订单统计数据")
    @PostMapping("inner/getCountMap")
    public Map<String, Object> getCountMap(@RequestBody OrderCountQueryVo orderCountQueryVo) {
        return orderInfoService.getCountMap(orderCountQueryVo);
    }
2、封装远程调用接口
(1)创建模块:service_order_client
(2)添加feign接口
@FeignClient(value = "service-orders")
@Repository
public interface OrderFeignClient {
    /**
     * 获取订单统计数据
     */
    @PostMapping("/api/order/orderInfo/inner/getCountMap")
    Map<String, Object> getCountMap(@RequestBody OrderCountQueryVo orderCountQueryVo);

}
3、搭建统计分析模块
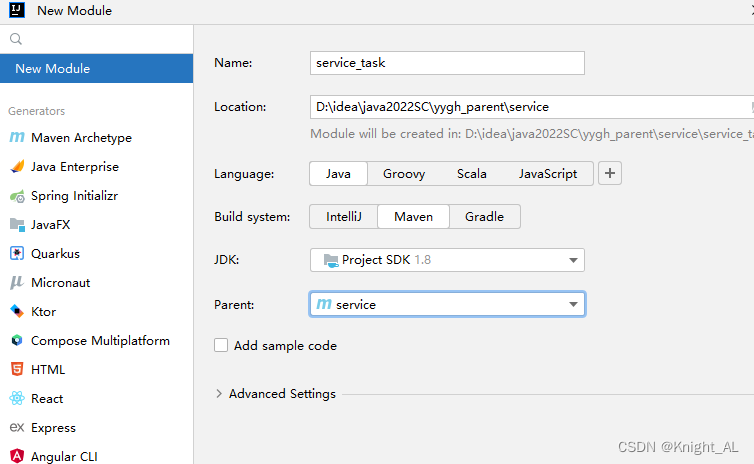
(1)创建service_statistics模块
(2)引入依赖
<dependencies>
    <dependency>
        <groupId>com.donglin</groupId>
        <artifactId>service_order_client</artifactId>
        <version>0.0.1-SNAPSHOT</version>
    </dependency>
</dependencies>
(3)添加配置文件
# 服务端口
server.port=8209
# 服务名
spring.application.name=service-sta
# 环境设置:dev、test、prod
spring.profiles.active=dev

# nacos服务地址
spring.cloud.nacos.discovery.server-addr=127.0.0.1:8848
(4)添加启动类
@SpringBootApplication(exclude = DataSourceAutoConfiguration.class)
@EnableDiscoveryClient
@EnableFeignClients(basePackages = {"com.donglin"})
@ComponentScan(basePackages = {"com.donglin"})
public class ServiceStatisticsApplication {

    public static void main(String[] args) {
        SpringApplication.run(ServiceStatisticsApplication.class, args);
    }

}
(5)添加controller方法
@Api(tags = "统计管理接口")
@RestController
@RequestMapping("/admin/statistics")
public class StatisticsController {

    @Autowired
    private OrderFeignClient orderFeignClient;

    @ApiOperation(value = "获取订单统计数据")
    @GetMapping("getCountMap")
    public R getCountMap(@ApiParam(name = "orderCountQueryVo", value = "查询对象", required = false) OrderCountQueryVo orderCountQueryVo) {
        Map<String, Object> map = orderFeignClient.getCountMap(orderCountQueryVo);
        return R.ok().data(map);
    }
}
service-gateway下的resource下的application.yml加上网关
        - id: service-sta
          uri: lb://service-sta
          predicates:
            - Path=/*/statistics/** # 路径匹配
4、整合统计功能前端
ECharts是百度的一个项目,后来百度把Echart捐给apache,用于图表展示,提供了常规的折线图、柱状图、散点图、饼图、K线图,用于统计的盒形图,用于地理数据可视化的地图、热力图、线图,用于关系数据可视化的关系图、treemap、旭日图,多维数据可视化的平行坐标,还有用于 BI 的漏斗图,仪表盘,并且支持图与图之间的混搭。
官方网站:https://echarts.apache.org/zh/index.html
(1)项目中安装 echarts组件
npm install --save echarts@4.1.0
(2)添加路由
 {
    path: '/statistics',
    component: Layout,
    redirect: '/statistics/order/index',
    name: 'BasesInfo',
    meta: { title: '统计管理', icon: 'table' },
    alwaysShow: true,
    children: [
        {
    path: 'order/index',
    name: '预约统计',
    component: () =>import('@/views/yygh/sta/index'),
    meta: { title: '预约统计' }
        }
      ]
  },
(3)封装api请求
sta.js
import request from '@/utils/request'

const api_name = '/admin/statistics'

export default {

    getCountMap(searchObj) {
        return request({
            url: `${api_name}/getCountMap`,
            method: 'get',
            params: searchObj
        })
    }
}
(4)添加组件
创建/views/yygh/sta/index.vue组件
<template>
    <div class="app-container">
    <!--表单-->
    <el-form :inline="true" class="demo-form-inline">
        <el-form-item>
            <el-input v-model="searchObj.hosname" placeholder="点击输入医院名称"/>
        </el-form-item>

        <el-form-item>
            <el-date-picker
                v-model="searchObj.reserveDateBegin"
                type="date"
                placeholder="选择开始日期"
                value-format="yyyy-MM-dd"/>
        </el-form-item>
        <el-form-item>
            <el-date-picker
                v-model="searchObj.reserveDateEnd"
                type="date"
                placeholder="选择截止日期"
                value-format="yyyy-MM-dd"/>
        </el-form-item>
        <el-button
            :disabled="btnDisabled"
            type="primary"
            icon="el-icon-search"
            @click="showChart()">查询</el-button>
    </el-form>

    <div class="chart-container">
        <div id="chart" ref="chart"
            class="chart" style="height:500px;width:100%"/>
    </div>
    </div>
</template>

<script>
import echarts from 'echarts'
import statisticsApi from '@/api/sta'

export default {

    data() {
        return {
            searchObj: {
                hosname: '',
                reserveDateBegin: '',
                reserveDateEnd: ''
            },
            btnDisabled: false,
            chart: null,
            title: '',
            xData: [], // x轴数据
            yData: [] // y轴数据
        }
    },

    methods: {
        // 初始化图表数据
        showChart() {
            statisticsApi.getCountMap(this.searchObj).then(response => {
                this.yData = response.data.countList
                this.xData = response.data.dateList
                this.setChartData()
            })
        },

        setChartData() {
            // 基于准备好的dom,初始化echarts实例
            var myChart = echarts.init(document.getElementById('chart'))
            // 指定图表的配置项和数据
            var option = {
                title: {
                    text: this.title + '挂号量统计'
                },
                tooltip: {},
                legend: {
                    data: [this.title]
                },
                xAxis: {
                    data: this.xData
                },
                yAxis: {
                    minInterval: 1
                },
                series: [{
                    name: this.title,
                    type: 'line',
                    data: this.yData
                }]
            }

            // 使用刚指定的配置项和数据显示图表。
            myChart.setOption(option)
        },
    }
}
</script>